
Improving Filebeat memory allocation


Share on Twitter


Share on LinkedIn


Share on Facebook


Share by email


Print
During a recent team offsite, one of the topics the Engineering team worked on was improving Filebeat performance. The idea was that we would generate and review pprof profiles and identify areas of improvement in our codebase. In particular, we looked into the memory profiles during specific logging use case scenarios.
As with every detective’s investigation work, we knew that we should be looking into the event hot-path to find improvements. So we started by looking at places that immediately seemed part of the hot-path and then investigated further by looking at the code.
In this blog, we will discuss one of those opportunities that immediately stood out when examining the memory profiles.
Investigation
We started by defining and executing our test case and collecting memory profiles. At a high level, the testing setup consisted of a Filebeat instance sending data to a remote cloud ES cluster. We have not configured any kind of processor, just a single input reading a 2 million lines log file.
We focused on the allocated heap (alloc_space), which would show the cumulative memory allocation for our benchmark. By focusing on the above and on reducing the allocation, we would help our GC by reducing the load on the GC stages. There is an interesting talk by Thomas Dullien discussing similar adventures on the path to performance analysis and the impact of GC.
Opening the profile was as simple as running the following command.
go tool pprof -http=:8080 -alloc_objects heap-profile.pprofThe following is a partial view:
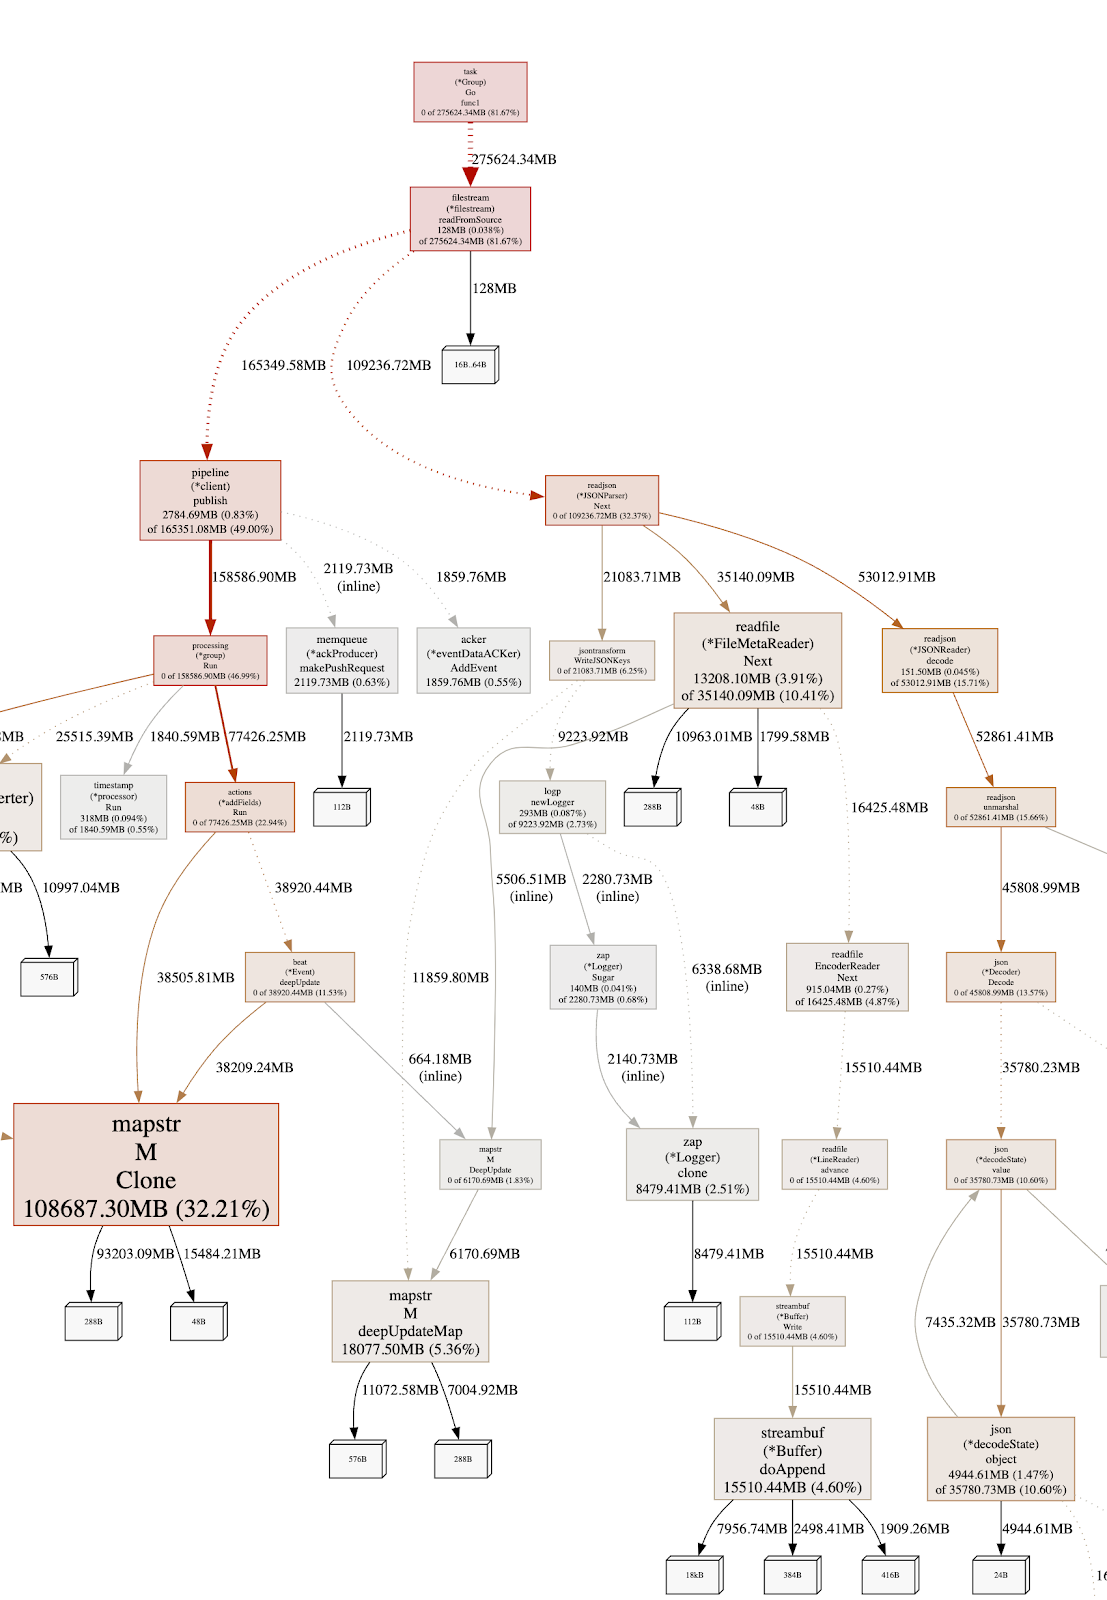
In the above view, you see arrows that are not of the same color, width, and format. The more solid and red the arrows are, the more memory is allocated along that path. By following the path, we can see that it maps into the “event processing” path as we perform memory allocation for each event.
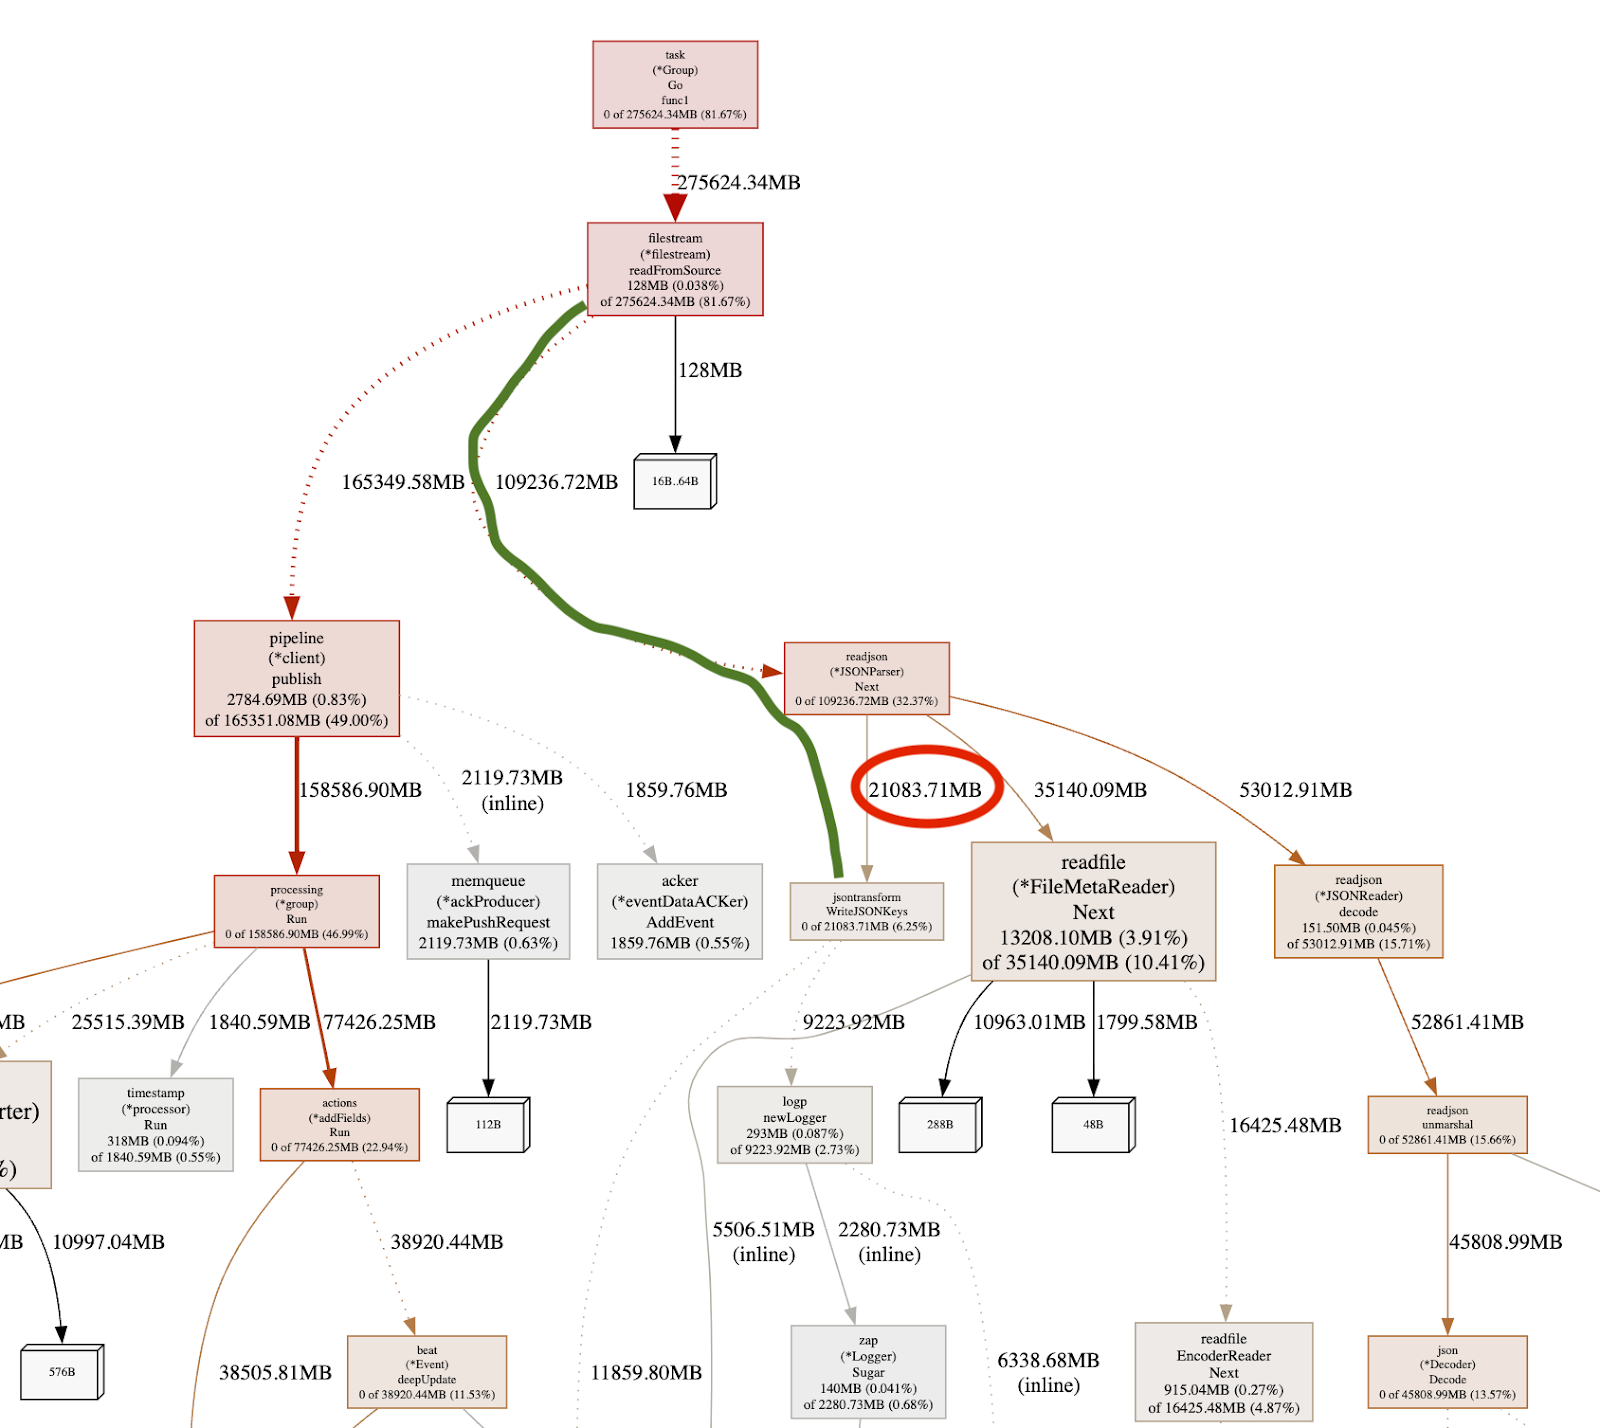
Taking a look at the green path above, we notice that from readFromSource we move down to readjson.Next, as expected, as we are reading from a NDJSON file source. Interestly, from there, we see a function call to jsontransform.WriteJSONKeys that is actually allocating the needed memory. This immediately looks suspicious because by looking at the diagram below that function, we see that the majority of the memory allocation is happening in the logp.newLogger.
Taking a look at the source code of that function, we see that we instantiate a new logger per function invocation. Since that function is called for each line, we end up allocating a new logger for each log event that has been read from the file.
To understand the memory consumption of this logic, we look again at the graph to see that overall the function consumed 21GB of memory as highlighted by the red circle. In our specific benchmark, the logger alone consumed 9.2GB, which is very close to 50% of the memory usage (!!).
As this looks like a good candidate for improvement, we immediately raised a Pull Request. After discussing it with the team, it turned out that we did not need the logger as the error was set in the event.
After removing the logger and re-testing, we got a different view:
go tool pprof -http=:8080 -alloc_objects heap-profile.pprof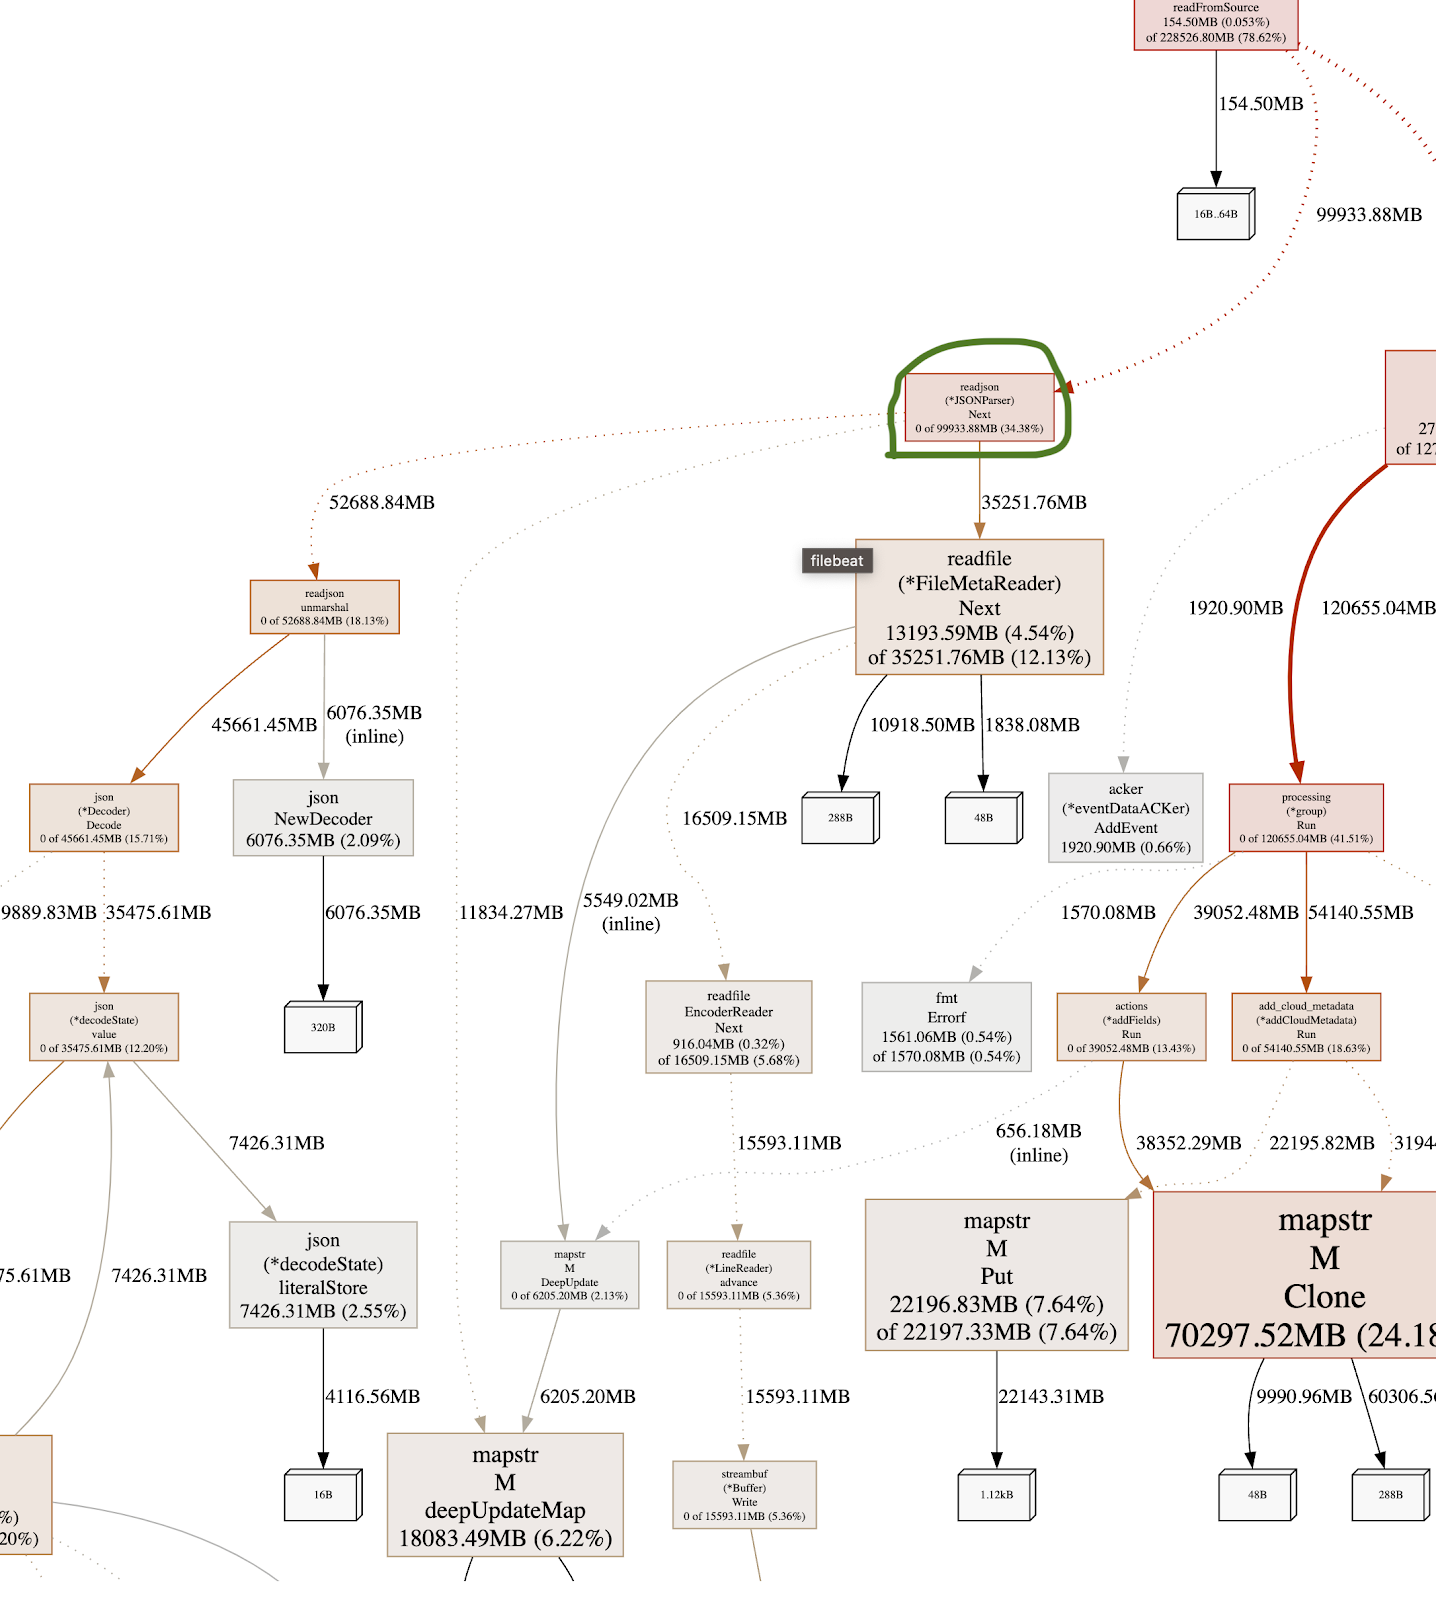
If we focus again on the readjson.Next (the one circled with Green in the image), we can see that the allocated space is now 99GB, reduced from 109GB simply by removing the use of the logger. We’re certain there’s still room for improvement.
The search for improvements continues
This example was just one of the improvements Elastic’s Platform Ingest team found during that offsite. We’ll continue with more posts around performance improvements in the following weeks.
The release and timing of any features or functionality described in this post remain at Elastic's sole discretion. Any features or functionality not currently available may not be delivered on time or at all.
Share
Share on Twitter
Share on LinkedIn
Share on Facebook
Share by email
Print

