
Improving memory allocation with Libbeat output client and Elasticsearch


Share on Twitter


Share on LinkedIn


Share on Facebook


Share by email


Print
Our journey of improving performance is not complete without diving into the path events follow toward their destination. When Filebeat or any other beat is publishing events to a remote Elasticsearch®, it relies on its _bulk API. This means that Beats doesn’t only make requests to Elasticsearch, but it also parses its responses, which increases the memory utilization as a result.
Previously, we showed how we managed to reduce Beats allocation by reducing the use of Logger in the event’s hot path, which reduced the overall allocated memory.
In this post, we will dive into the path of the publishing method and discuss how we managed to improve the memory allocation, which results in a direct increase of speed.
Investigation
Before any performance problem can be solved, we first need to understand the baseline. For that, we started by analyzing a pprof from the benchmark suite and focused on memory allocation of the publishEvent function. This function is responsible for sending the _bulk request and parsing the response from the Elasticsearch.
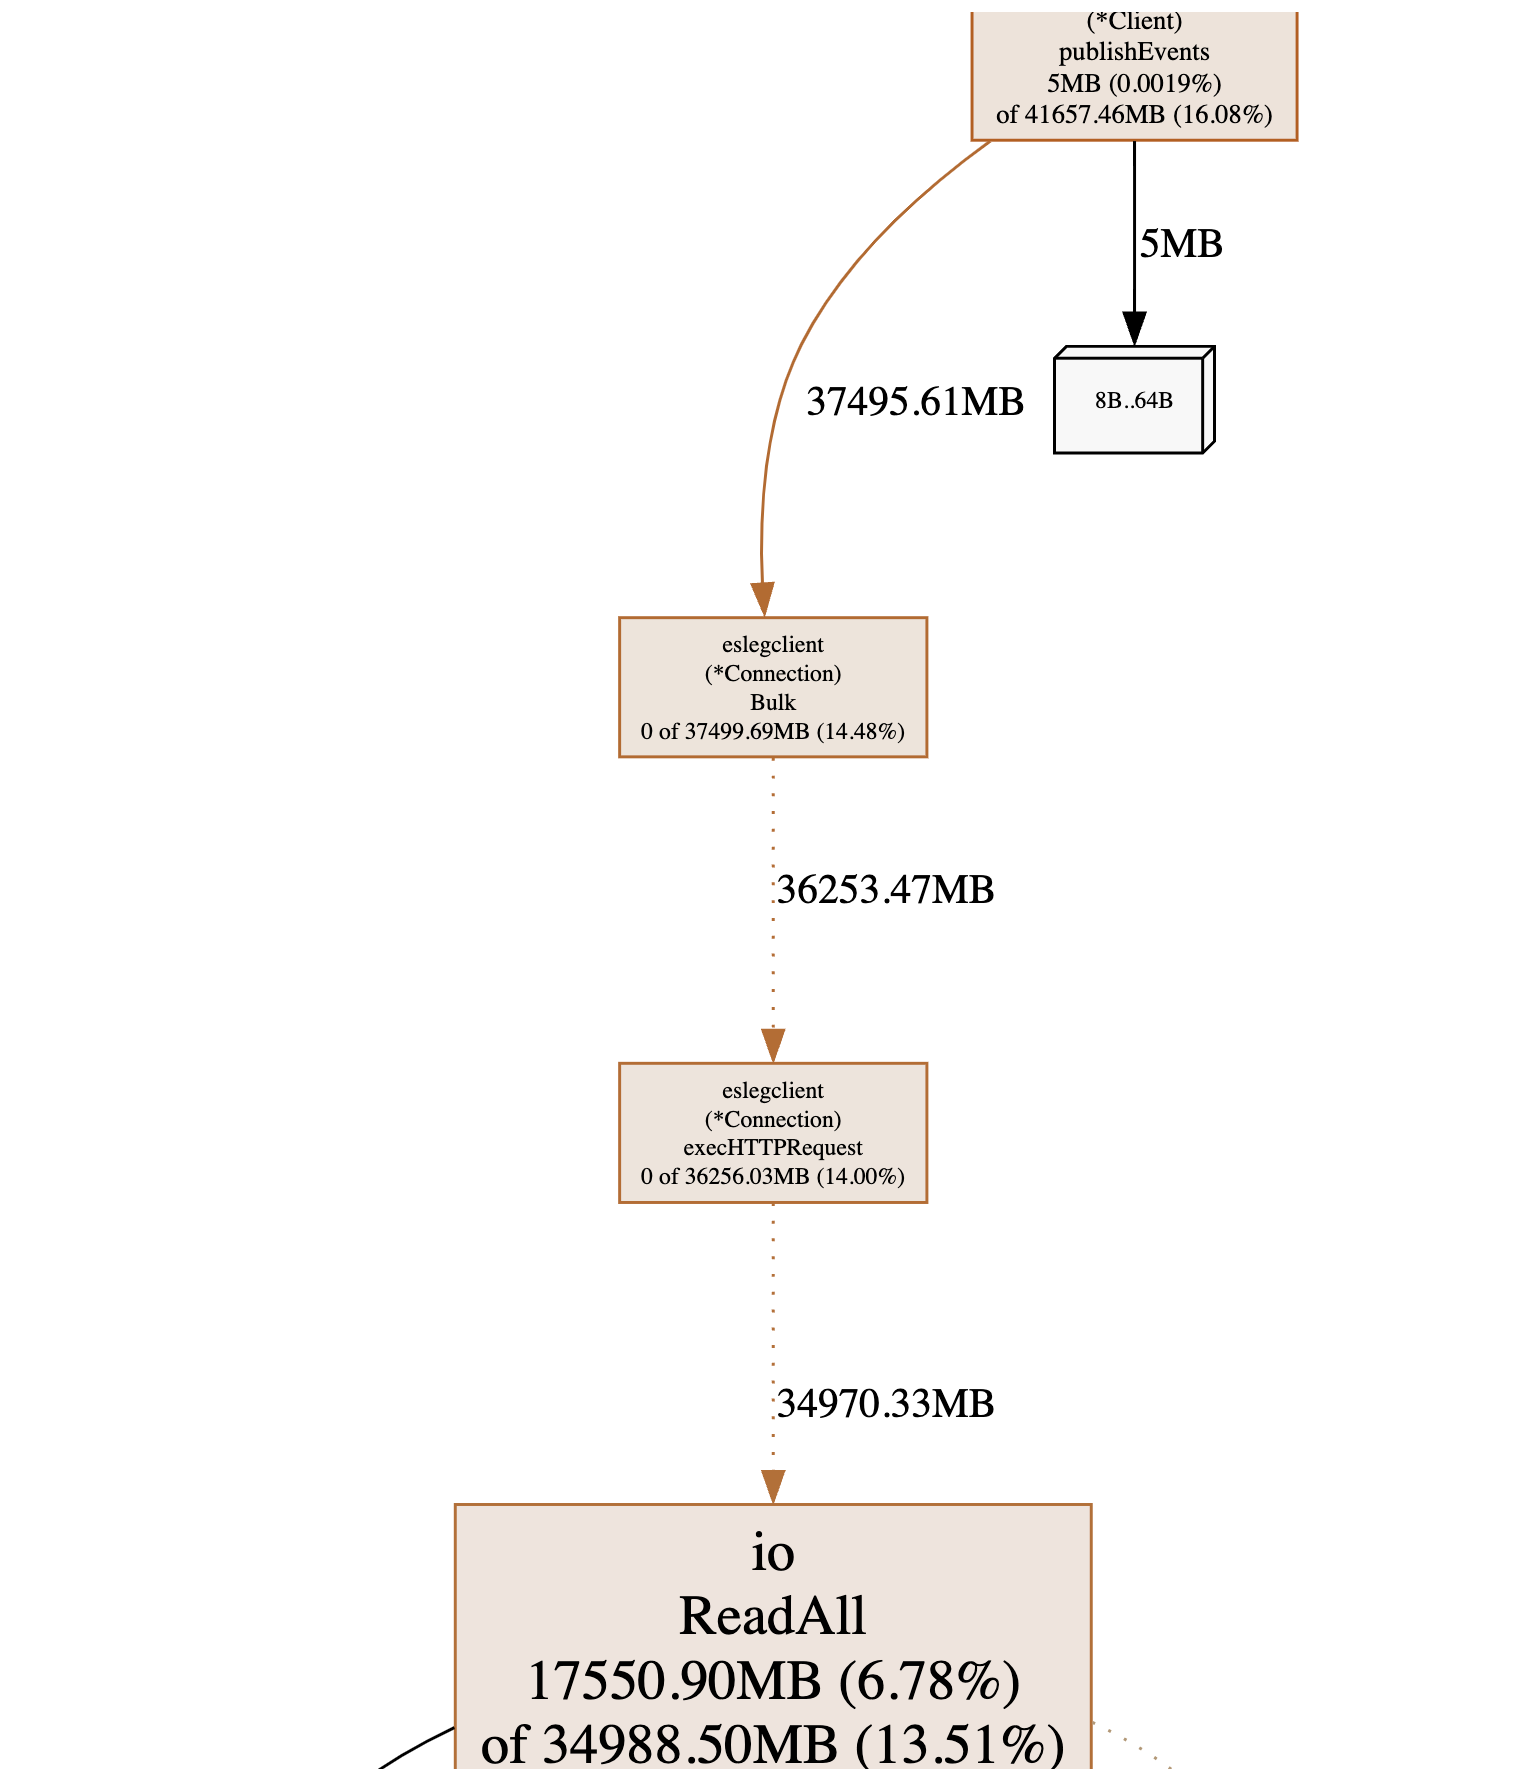
Looking at the publishEvents method, we saw that it allocates 5MB directly and ~41GB indirect memory from other methods. Based on these results, we started by looking into those indirect allocations and where they are coming from.
Taking a look at the code path and the involved functions, we saw that it executes the _bulk HTTP call, to later consume the response using the io.ReadAll. From following that function definition, we saw a deprecation warning.
Deprecated: As of Go 1.16, this function simply calls io.ReadAll.This was the first improvement hint we aimed at addressing, by replacing the deprecated function. We began with creating a Go benchmark to measure the execHttpRequest performance. The methodology we followed was to create a Go benchmark reproduction and create a baseline to assess the impact of removing the deprecated function.
The next step is to deal with the way we consume the response itself. Since the response is something that is going to happen in the context of a NewConnection, it would make sense to reuse the same buffer for consuming that response compared to previously calling io.ReadAll for each response. This way, we use a more memory-efficient and up-to-date implementation and reduce the number of allocations we are going to do each time we initialize a connection.
Once we are done with the changes, we go back to our Go benchmark test and validate the impact. To make comparing results easier, Go provides a tool called benchstat that can help us compare the two outputs.
# benchstat baseline.txt initialize_per_connection.txt
goos: darwin
goarch: arm64
pkg: github.com/elastic/beats/v7/libbeat/esleg/eslegclient
                   │ baseline.txt │   initialize_per_connection.txt   │
                   │    sec/op    │   sec/op     vs base              │
ExecHTTPRequest-12    2.995µ ± 2%   2.905µ ± 1%  -3.01% (p=0.000 n=8)

                   │ baseline.txt │   initialize_per_connection.txt    │
                   │     B/op     │     B/op      vs base              │
ExecHTTPRequest-12   6.055Ki ± 0%   5.555Ki ± 0%  -8.26% (p=0.000 n=8)

                   │ baseline.txt │  initialize_per_connection.txt   │
                   │  allocs/op   │ allocs/op   vs base              │
ExecHTTPRequest-12     27.00 ± 0%   26.00 ± 0%  -3.70% (p=0.000 n=8)
We reduced the time of execution by 3%, the memory consumption by 8%, and the number of allocations by ~3%. The numbers above give us confidence that the changes we are proposing will improve the performance.
The actual amount of allocated memory is dependent on the size of the response we get from Elasticsearch, so another area that we can consider taking into account is if there is anything we can do to reduce that response size. The code that deserialized the response is already doing some lazy initialization and is skipping sections of the response. But to parse it, we still need to parse the full response, including the part of the response we don't need.
The idea is to only consume the field of the response that we use, reducing the response bytes from the Elasticsearch side. Looking at the Elasticsearch documentation, we see the feature of Response Filtering, which we can take advantage of and reduce the response fields for bulk responses to the ones only required from our custom deserializer. All of this is in theory!
Moving back to our end-to-end benchmark suite, re-running the same benchmark, and collecting the profiles as before, we should expect to see improvements. Opening the profiles and looking at the results, we can see:
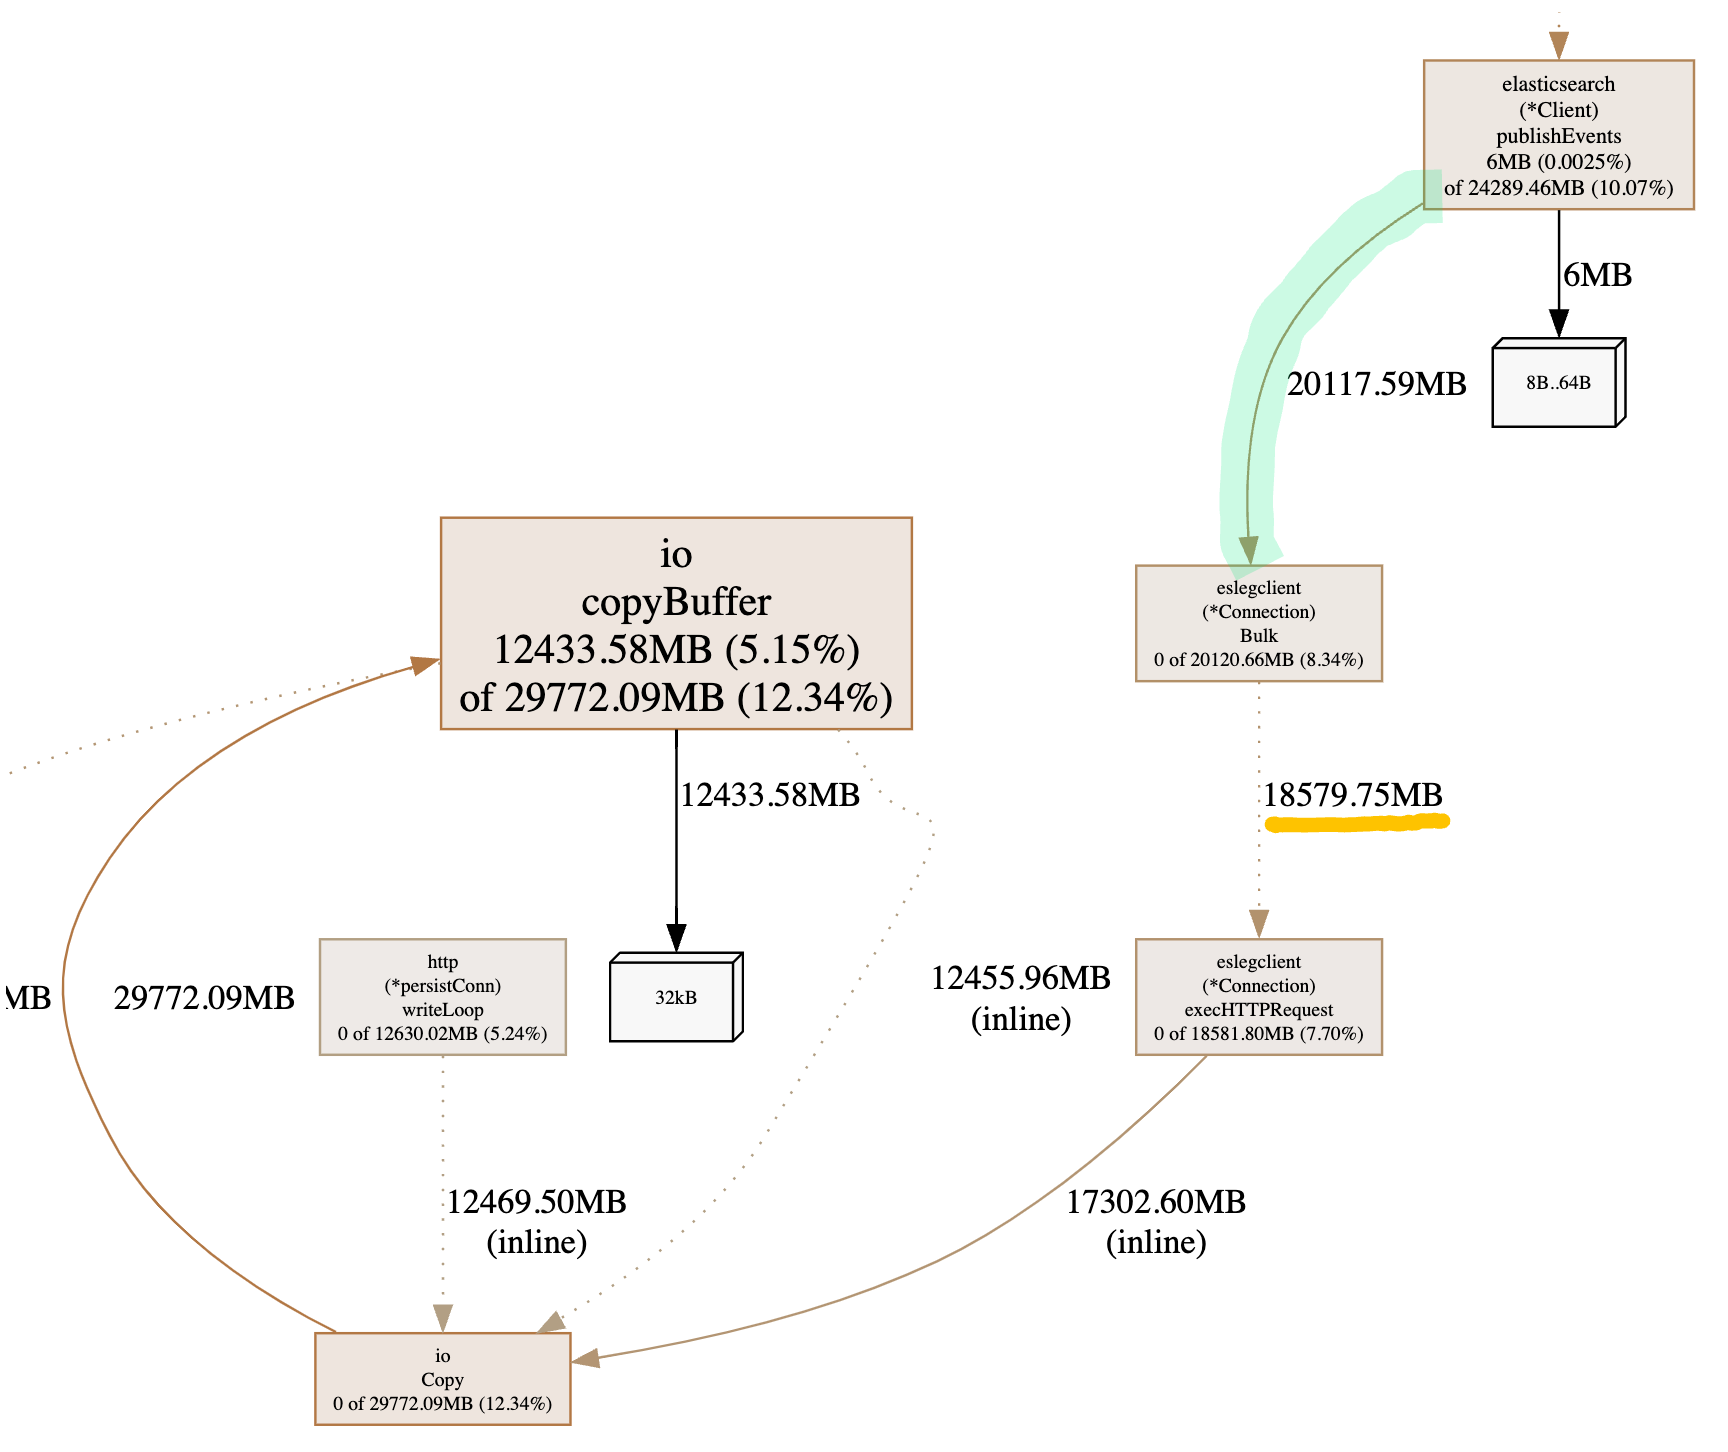
The execHTTPRequest cumulative allocation dropped from the original 32GB of allocation to 18GB of allocation. This is ~43% less memory allocation overall. We now see that we use the io.copy to consume the response bytes, which is more efficient for memory, as seen from our Go benchmarks earlier, and the reduction of the response size in combination with the io.copy shows an improvement in how much memory we allocate.
This is important, as now we have reduced the amount of memory the GC has to clean up, and we have freed some of the CPU cycles for other tasks! Switching the pprof to CPU profile and in particular comparing the two CPU profiles of the same benchmark, taken on the same checkpoint.
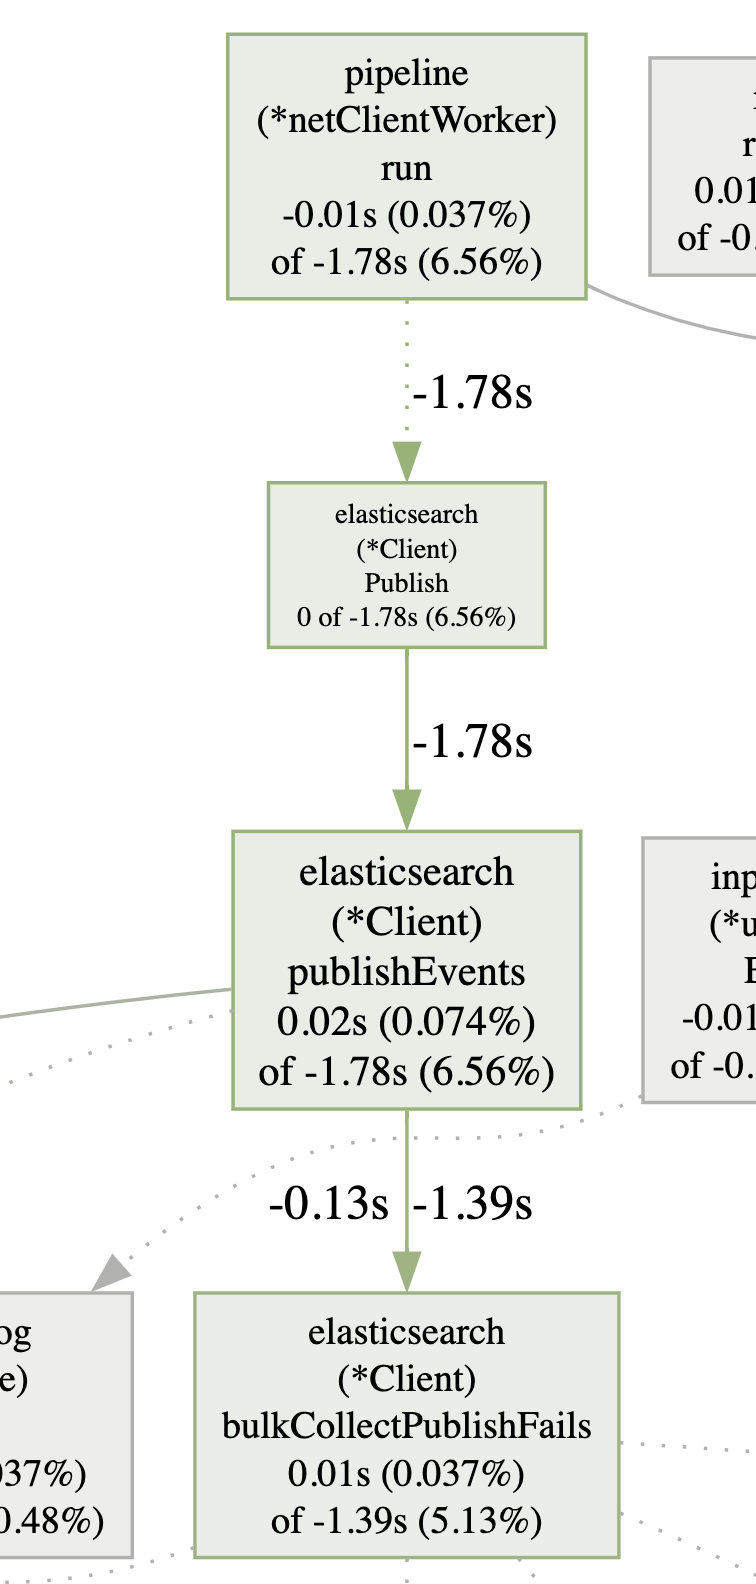
It shows us that in our benchmark scenario, we managed to improve the CPU cycles by 1.78 seconds for the publishEvents and 1.3 on the bulkConnectPublishFails methods.
The outcome
The outcome of our investigation resulted in improvements made for Beats in v8.11.0. Interestingly, this investigation also resulted in us making changes in the Logstash® Elasticsearch output plugin, to implement the same response filtering technique.
Lessons learned
This investigation proved one thing: you should follow up on deprecated warnings. It's a good opportunity to revisit the implementation and find ways to improve memory allocation. Additionally, for applications that send/receive large amounts of data, we should use only the parts of the response we need because the response size is allocated in our application heap when we care about the content of the response.
The release and timing of any features or functionality described in this post remain at Elastic's sole discretion. Any features or functionality not currently available may not be delivered on time or at all.
Share
Share on Twitter
Share on LinkedIn
Share on Facebook
Share by email
Print

