Elasticsearch, Kibana, and Elastic Cloud 7.16: Integrations and more actionable insights

 Share on Twitter
Share on Twitter

 Share on LinkedIn
Share on LinkedIn

 Share on Facebook
Share on Facebook

 Share by Email
Share by Email

 Print this page
Print
With the release of Elastic 7.16, it’s easier than ever to collect, store, search, and analyze data securely and at scale, no matter the use case. Explore third-party solutions like ServiceNow and cloud-native integrations like Amazon Web Services (AWS) FireLens to make your data actionable and streamline workflows across teams and systems.
In addition, 7.16 improves performance and maximizes resource consumption with enhancements to Elasticsearch, gives users the ability to add more context to Kibana visualizations, and more.
Ready to roll up your sleeves and get started? We have the links you need:
- Try out the new features on Elastic Cloud
- Download the latest versions of Elasticsearch, Kibana, Elastic Cloud on Kubernetes
- Dig deeper in the release notes: Elasticsearch, Kibana, Elastic Cloud, Elastic Cloud on Kubernetes
- See Elasticsearch breaking changes
New ways to collect and connect your data with integrations
Go from data to insights with ease
Our growing library of integrations — including native integrations for Microsoft Azure, Google Cloud, and AWS — makes it easy to collect and connect data across applications, infrastructure, public content sources, and more.
In 7.16, a new unified Integrations UI in Kibana makes it even faster to find ways to ingest data from a new source — with just a few clicks for Elastic Agent-enabled integrations. The Integrations UI allows you to search for all integrations supported by Elastic Agent, Beats, Logstash, the Elastic App Search web crawler, Workplace Search content source connectors, and Elasticsearch language clients.
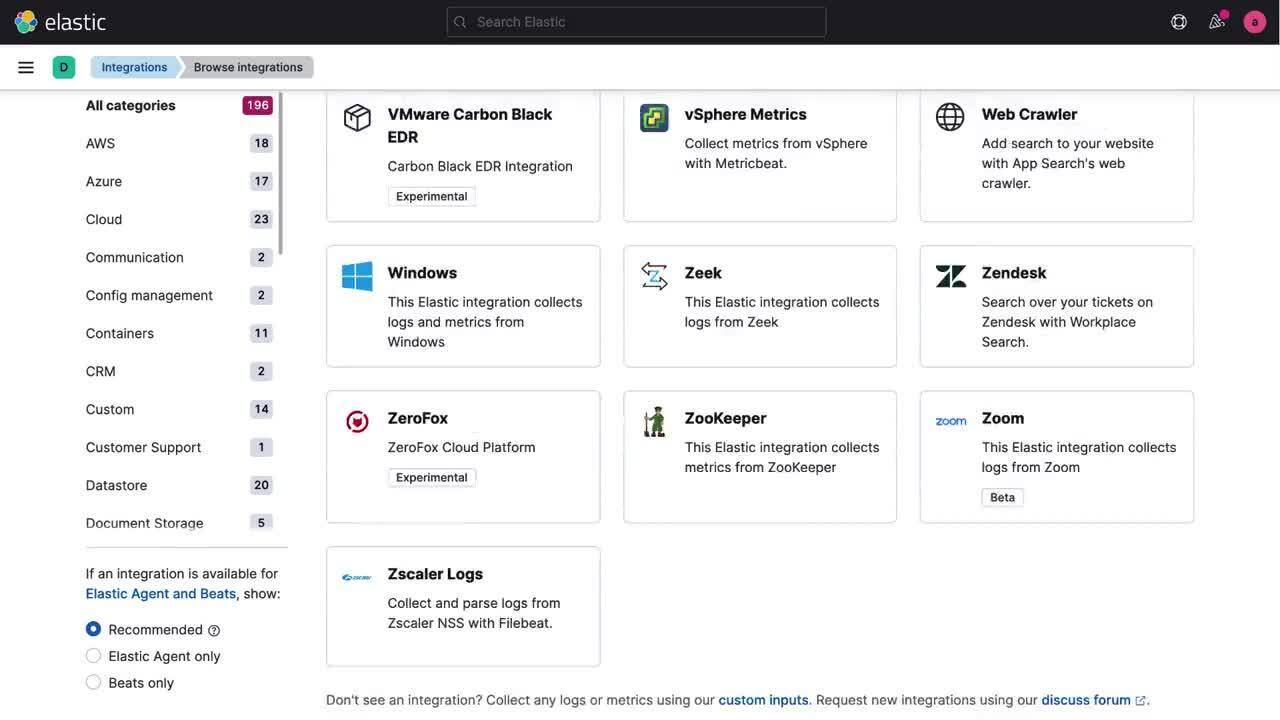
Developers, practitioners, and analysts alike can get started from one place and use the ingest method that best suits their needs. And, with even more Elastic Agent-enabled integrations entering general availability, users can spend less time wrestling with custom ingest pipelines and editing long YAML files and more time exploring their data using the Elastic Stack.
Streamline ServiceNow workflows

New ServiceNow certified applications for existing IT Service Management (ITSM) and Security Incident Response (SIR) integrations and a new integration for IT Operations Management (ITOM) increase automation for generating application, security, or infrastructure ServiceNow incidents and reduce time and resources spent on manually filing incidents and double-documenting information.
These updates help teams ensure that they are always working off the most up-to-date information in ServiceNow when using Elastic source data to generate and update incidents and cases. Teams can customize alerting rules in Kibana for observability and security use cases to automate follow-up and push case observables to ServiceNow to enrich investigations. And there’s more to come for making workflows even more streamlined as Elastic continues to partner with ServiceNow to deepen these integrations.
Reduce operational complexity with the new native integration for AWS FireLens

We are excited to announce a way to easily ingest data into Elastic Cloud with the native integration for AWS FireLens, a container log router for Amazon Elastic Container Service (Amazon ECS) launch types: Amazon Elastic Compute Cloud (Amazon EC2) and AWS Fargate. You can now use ECS and Fargate logs to further improve the observability and security of your AWS workloads without installing and managing standalone data shippers. Ingest data into Elastic Cloud faster, with a simplified data architecture, and reduce operational complexity.
Better performance, lower TCO
With 7.16, we’ve introduced several features that enhance performance, improve resilience, and reduce disk and memory usage — ultimately lowering your total cost of ownership.
Scale to new heights
You can now take advantage of lower heap consumption per field on data nodes. Testing shows that prior to 7.16, 1,000 Beats indices on data nodes required 4GB of heap to store data structure; now, this requires only a few hundred MB. Search speed is also significantly improved — it used to fan out requests to every shard matching the index pattern, but now has been reduced to a single request per node. Lowering heap consumption and optimizing shard requests allows you to further grow with your data and scale your Elasticsearch clusters to new heights.
Performance boosts in Elasticsearch
Event query language (EQL), introduced in Elasticsearch 7.9, is a correlation language that matches events across different time spans for event-based time series data, such as logs, metrics, and traces. In 7.16, we improved EQL performance by removing the use of null values as join keys in sequences, resulting in an impressive increase in performance exceeding 830x!
Another notable performance improvement is in search_after on sorted long fields (including timestamp). We developed and contributed this important capability to Lucene and immediately exposed it in Elasticsearch 7.16. With this change, you benefit from a performance improvement of up to 4x for retrieving results from an index of machine-generated data that is sorted by timestamp and for queries that do not require aggregate information. For a deeper and more complete explanation of this change, check out our blog post on optimizing sort queries in Elasticsearch.
Lastly, the vector tiles API, generally available in 7.16, provides a huge performance and scalability improvement when searching geo_points and geo_shapes drawn to a map (through use of vector tiles). This new standard and type of API does not behave like our other APIs and return JSON — instead, it returns MapBox vector tile specification, which can easily be rendered by any map supporting this format.
The benefits are clear when compared side by side. Offloading these calculations to the local GPU significantly improves performance to provide a smooth and scalable zoom.

Smooth and scalable UX with vector tiles (left) and without vector tiles (right). Note that the video on the right is played at 2x speed, and still cannot keep up with the video on the left.
This change to vector tiles means that the simplification of the geometries happens at the data node. As a result, less data is communicated both to the end user and within the cluster between the data nodes and the coordinating nodes, with a potential impact not just on performance and scalability, but also on lowering total cost of ownership.
Other updates across the Elastic Stack and Elastic Cloud
Kibana
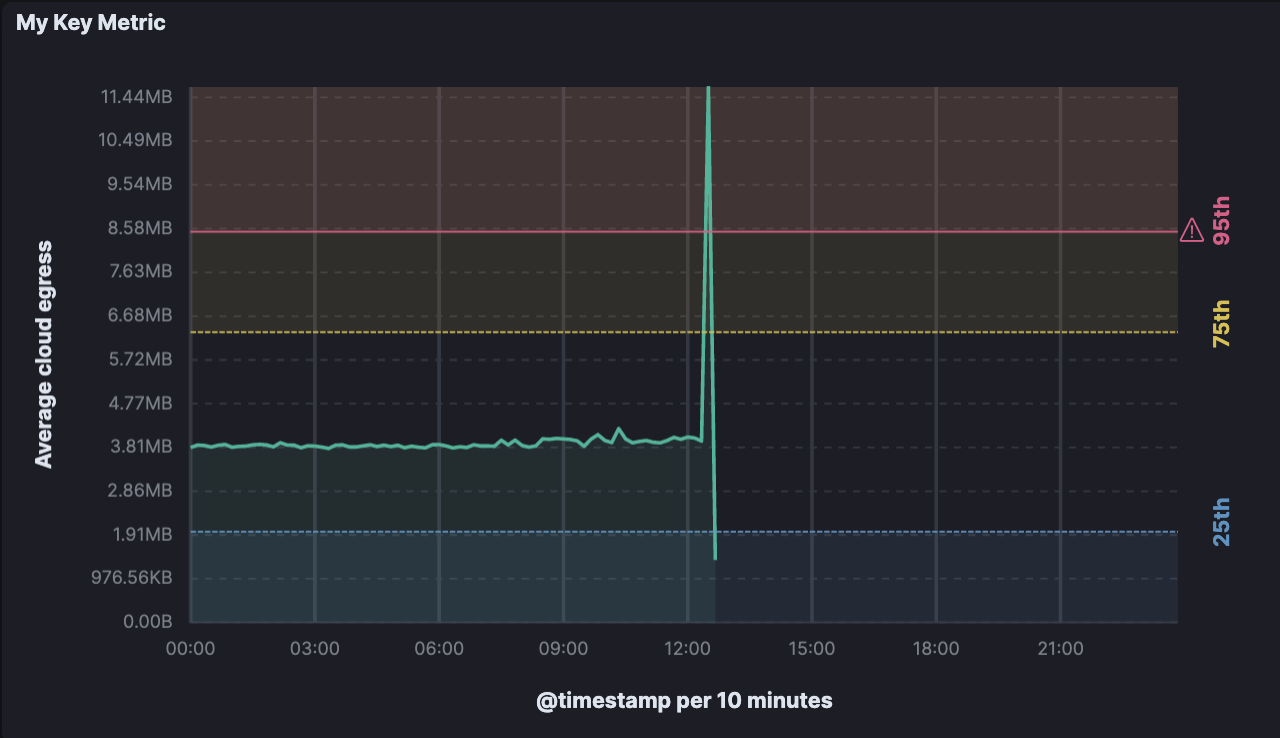
- Know if you’re on target: Reference lines in Kibana visualizations can help you track metrics against targets, warning zones, and other meaningful metric standards for your teams and organization. Use these to represent thresholds, key results, and performance criteria in visualizations to tell a more robust story about your data.
- Upgrade to 8.0 and beyond: The Upgrade Assistant shows which steps you need to complete prior to upgrading a cluster and identifies any Elasticsearch or Kibana deprecated settings in a 7.16 configuration. The assistant will guide you through the process of resolving any issues and will also provide additional context for making decisions to move forward. Check out this ElasticON session for more.
- Monitor transform health with ease: A new rule type for Kibana alerting enables you to stay informed when continuous transforms for machine learning experience operational issues. This includes checking if a transform has stopped indexing data or is in a failed state.
- Learn more about 7.16 features in the Kibana docs.
Elastic Cloud
- Use Elastic Cloud on AWS in three new regions in EMEA: Now you can run your Elastic Cloud deployment on AWS in Bahrain, Cape Town, and Milan. We’ve added support for the Middle East (Bahrain), Africa (Cape Town), and Europe South (Milan) regions, so you can search, observe, and protect your applications, data, and infrastructure across more than 45 regions and 3 cloud providers. Visit our regions page to see all of our supported regions.
- Multi-user access: Did you know you can leverage multi-user access to invite multiple users to collaborate under a single organization in Elastic Cloud? All users who are members of the same organization can easily create, delete, and operate the Elastic Cloud deployments associated with that organization. This eliminates the need to share a single set of credentials between multiple users. Check out our blog to learn more.
Elasticsearch
- Prebuilt ILM policies: In 7.16, we have included five built-in index lifecycle management (ILM) policies as starting points until you switch to using a custom ILM policy.
- Love Logstash Grok? The Grok processor now supports the Elastic Common Schema (ECS) by bringing over the Logstash Grok filter's ECS patterns.
- Try text categorization aggregations: Prior to 7.16, text categorization was only in machine learning anomaly detection. Now text categories can be found and explored on the fly, without the need for an anomaly detection job. Answer questions like, “Which log message types are happening during periods of network latency?” or “What are the typical log messages seen after upgrading?”
- Learn more about 7.16 features in the Elasticsearch docs.
Try it out
Existing Elastic Cloud customers can access many of these features directly from the Elastic Cloud console. If you’re new to Elastic Cloud, take a look at our Quick Start guides (bite-sized training videos to get you started quickly) or our free fundamentals training courses. You can always get started with a free 14-day trial of Elastic Cloud or download the self-managed version of the Elastic Stack for free.
Read about these capabilities and more in the 7.16 release notes (Elasticsearch, Kibana, Elastic Cloud, Elastic Cloud on Kubernetes), and other Elastic 7.16 highlights in the Elastic 7.16 announcement post.
The release and timing of any features or functionality described in this post remain at Elastic's sole discretion. Any features or functionality not currently available may not be delivered on time or at all.
Share
- Share on Twitter
Share on Twitter
- Share on LinkedIn
Share on LinkedIn
- Share on Facebook
Share on Facebook
- Share by Email
Share by Email
- Print this page
Print