Create, Manage, and Visualize Rollup Data in Kibana
Keeping historical data around for analysis is extremely useful, but storage costs can become a problem as the amount of stored data grows. By "rolling up" the data into a single, summary document in Elasticsearch, the rollup APIs let you summarize the data and store it more compactly. You can then archive or delete the original data to save storage. When you create a rollup, you get to pick all the fields that you’re interested in for future analysis, and a new index is created with just that rolled up data. This new rollup index then lives side by side with the index that it’s being rolled up from. Since rollups are just like any other index — only a lot smaller — you already know how to query and aggregate the data inside.
Want to learn more about rolled up data? See this video from Elastic{ON} 2018 keynote or check out our documentation on rolling up historical data in Elasticsearch.
Version 6.5 introduces new features in Kibana for creating, starting, stopping, and deleting rollup jobs, and also provides beta features for visualizing rolled up data in a dashboard.
Getting started
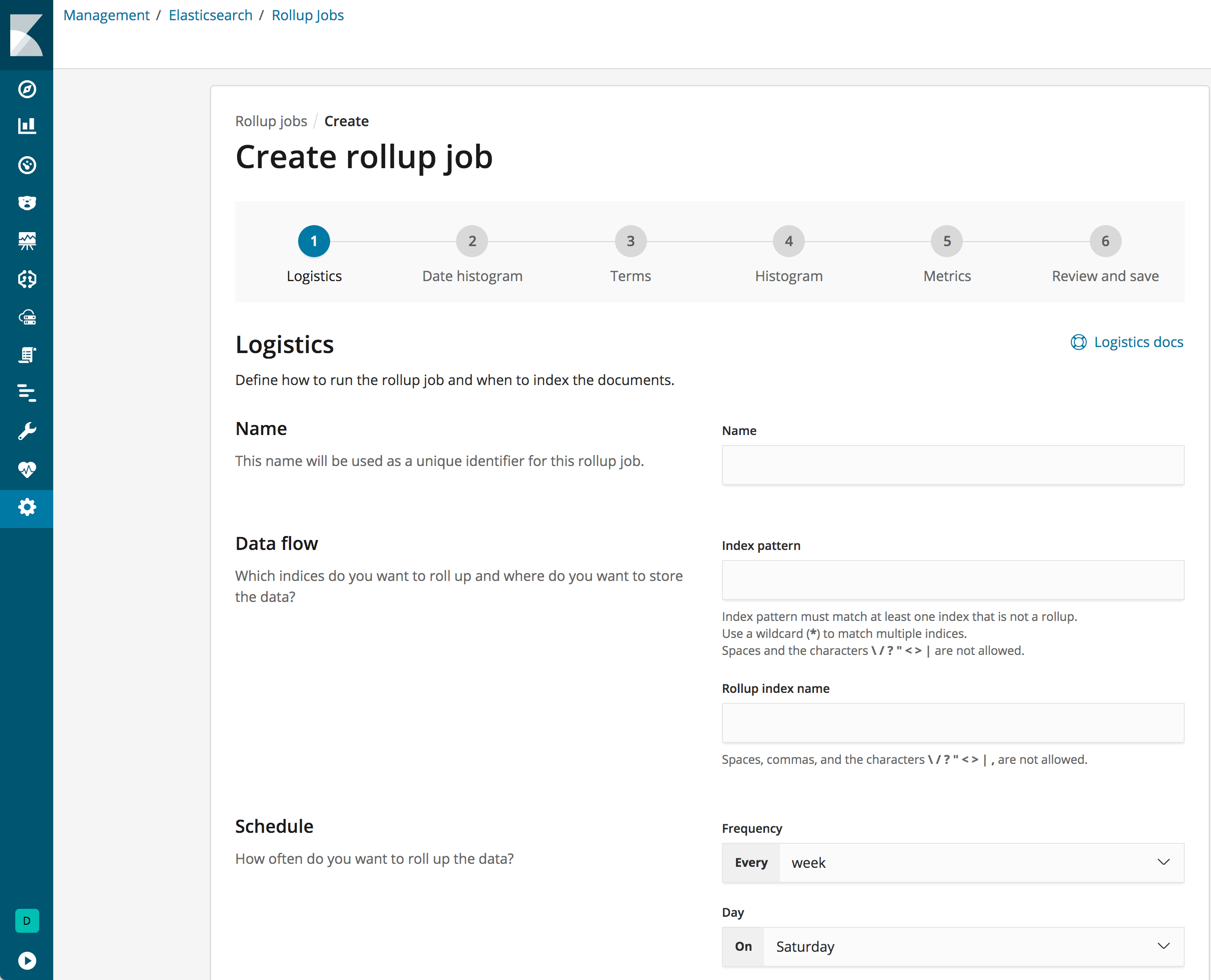
To check out the new features in Kibana, go to Management, and under Elasticsearch, click Rollup Jobs. If you don’t have any existing rollup jobs, there won’t be much to see here at first, but never fear! Click Create a rollup job to let Kibana guide you through the steps to get started.
Create a rollup job
To create a new rollup, just fill in the name, data flow, and how often you want to roll up the data. Then define a date histogram aggregation for the rollup job and optionally terms, histogram and metrics aggregations.
Before you save the new job, Kibana will show you a summary of the rollup details so that you can double check the info before you hit save.

Manage your rollups
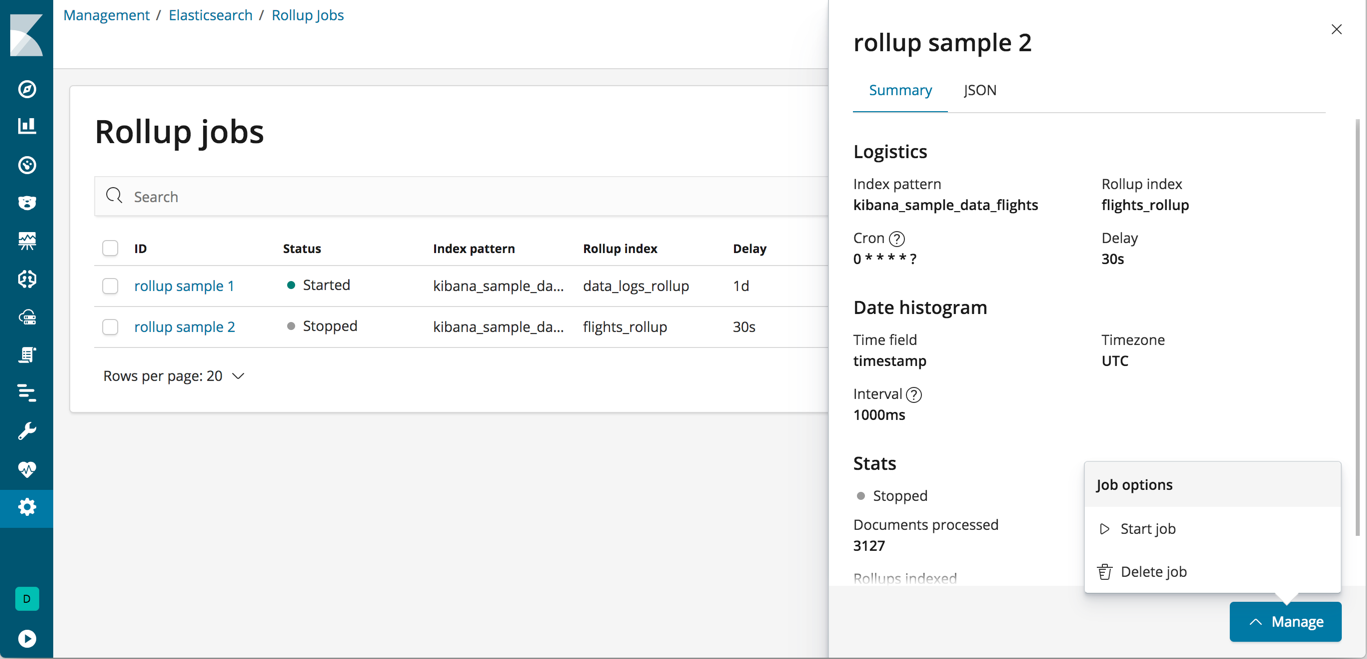
Once you’ve saved one or more rollups, you can click on the name of each job to view its details. The Manage menu in the lower right corner enables you to start, stop, and delete the rollup job.

Configuration Changes
Rollup job settings can’t be changed after the job has been created. If you want to select additional fields or redefine any terms, you would need to delete the existing job and create a new one with the updated specifications. Be sure to use a different name for the new rollup job, as reusing the same name could lead to mismatched job configurations. You can read more about logistical details for the rollup job configuration in the Elasticsearch documentation.
Using rolled up data
One way to check out these new features in Kibana is to create a rollup to capture log data from sample web logs. If you’d like to follow along with this example, you can load the sample data set by clicking the link next to Add sample data on the Kibana home page. Click Add under Sample web logs, and then go to Management and under Elasticsearch, click Rollup Jobs to create a new rollup.
For this example, let’s say that we want data that is older than 7 days in the target index pattern (kibana_sample_data_logs) to be rolled up once a day into the index rollup_logstash. The rolled up data can be bucketed on an hourly basis, using 60m for the time bucket configuration to allow for more granular queries, like 2h and 12h.
In the configuration below, you’ll see that the terms, histogram, and metrics fields reflect the key information we want to retain in the rolled up data, such as where visitors are from (geo.src), what operating system they are using (machine.os.keyword), and how much data is being sent to them (bytes).
The rolled up data can now be used for analysis at a fraction of the storage cost of the original index. The original data can live side by side with the new rollup index, or be removed or archived manually or via the Index Lifecycle Management API (coming soon).
Example rollup configuration
Name: logs_job
Index pattern: kibana_sample_data_logs
Rollup index name: rollup_logstash
Frequency: Every day at midnight
Page size: 1000
Delay (latency buffer): 7d
Date field: @timestamp
Time bucket size: 60m
Time zone: UTC
Terms: geo.src, machine.os.keyword
Histogram: bytes, memory
Histogram interval: 1000
Metrics: bytes (average)
Visualize your rollup data
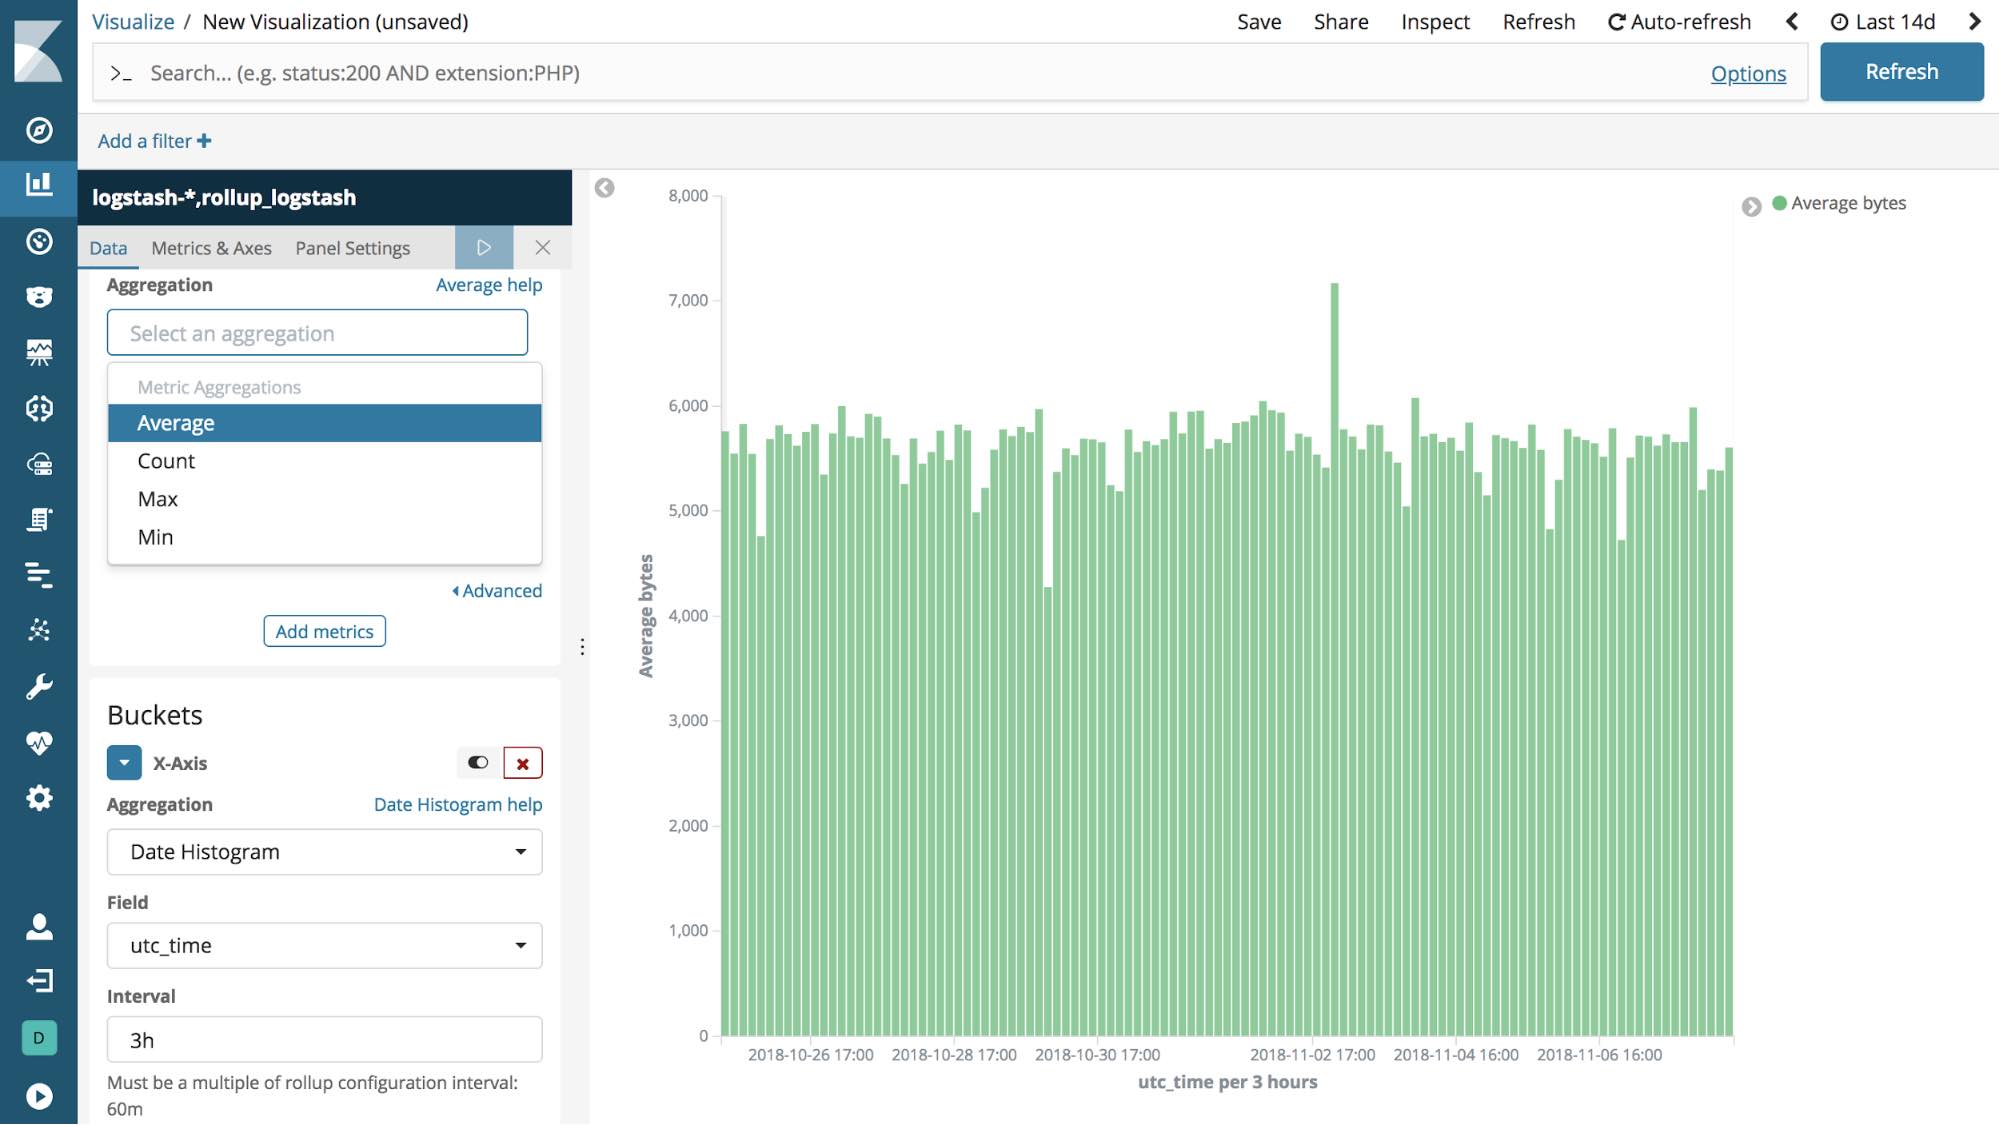
Once you’ve created a rollup job, you can create an index pattern and visualize the data in a variety of charts, tables, maps, and more. Most visualizations support rolled up data, with the exception of Timelion, Visual Builder, and Vega visualizations (coming soon).
You can match an index pattern to rolled up data only, or mix both rolled up and raw data to visualize all data together. An index pattern can match only one rolled up index, but there is no restriction on the number of standard indices that an index pattern can match.
Combination index patterns use the same notation as other multiple indices in Elasticsearch. To match multiple indices to create a combination index pattern, use a comma to separate the names, with no space after the comma. The notation for wildcards (*) and the ability to "exclude" (-) also apply (for example, test*,-test3). Using the information from the example rollup configuration described above, rollup_logstash would be used to match only the rolled up index pattern, and kibana_sample_data_logs would match only the index pattern for raw data. The notation for a combination index pattern with both raw and rolled up data, would be rollup_logstash,kibana_sample_data_logs.

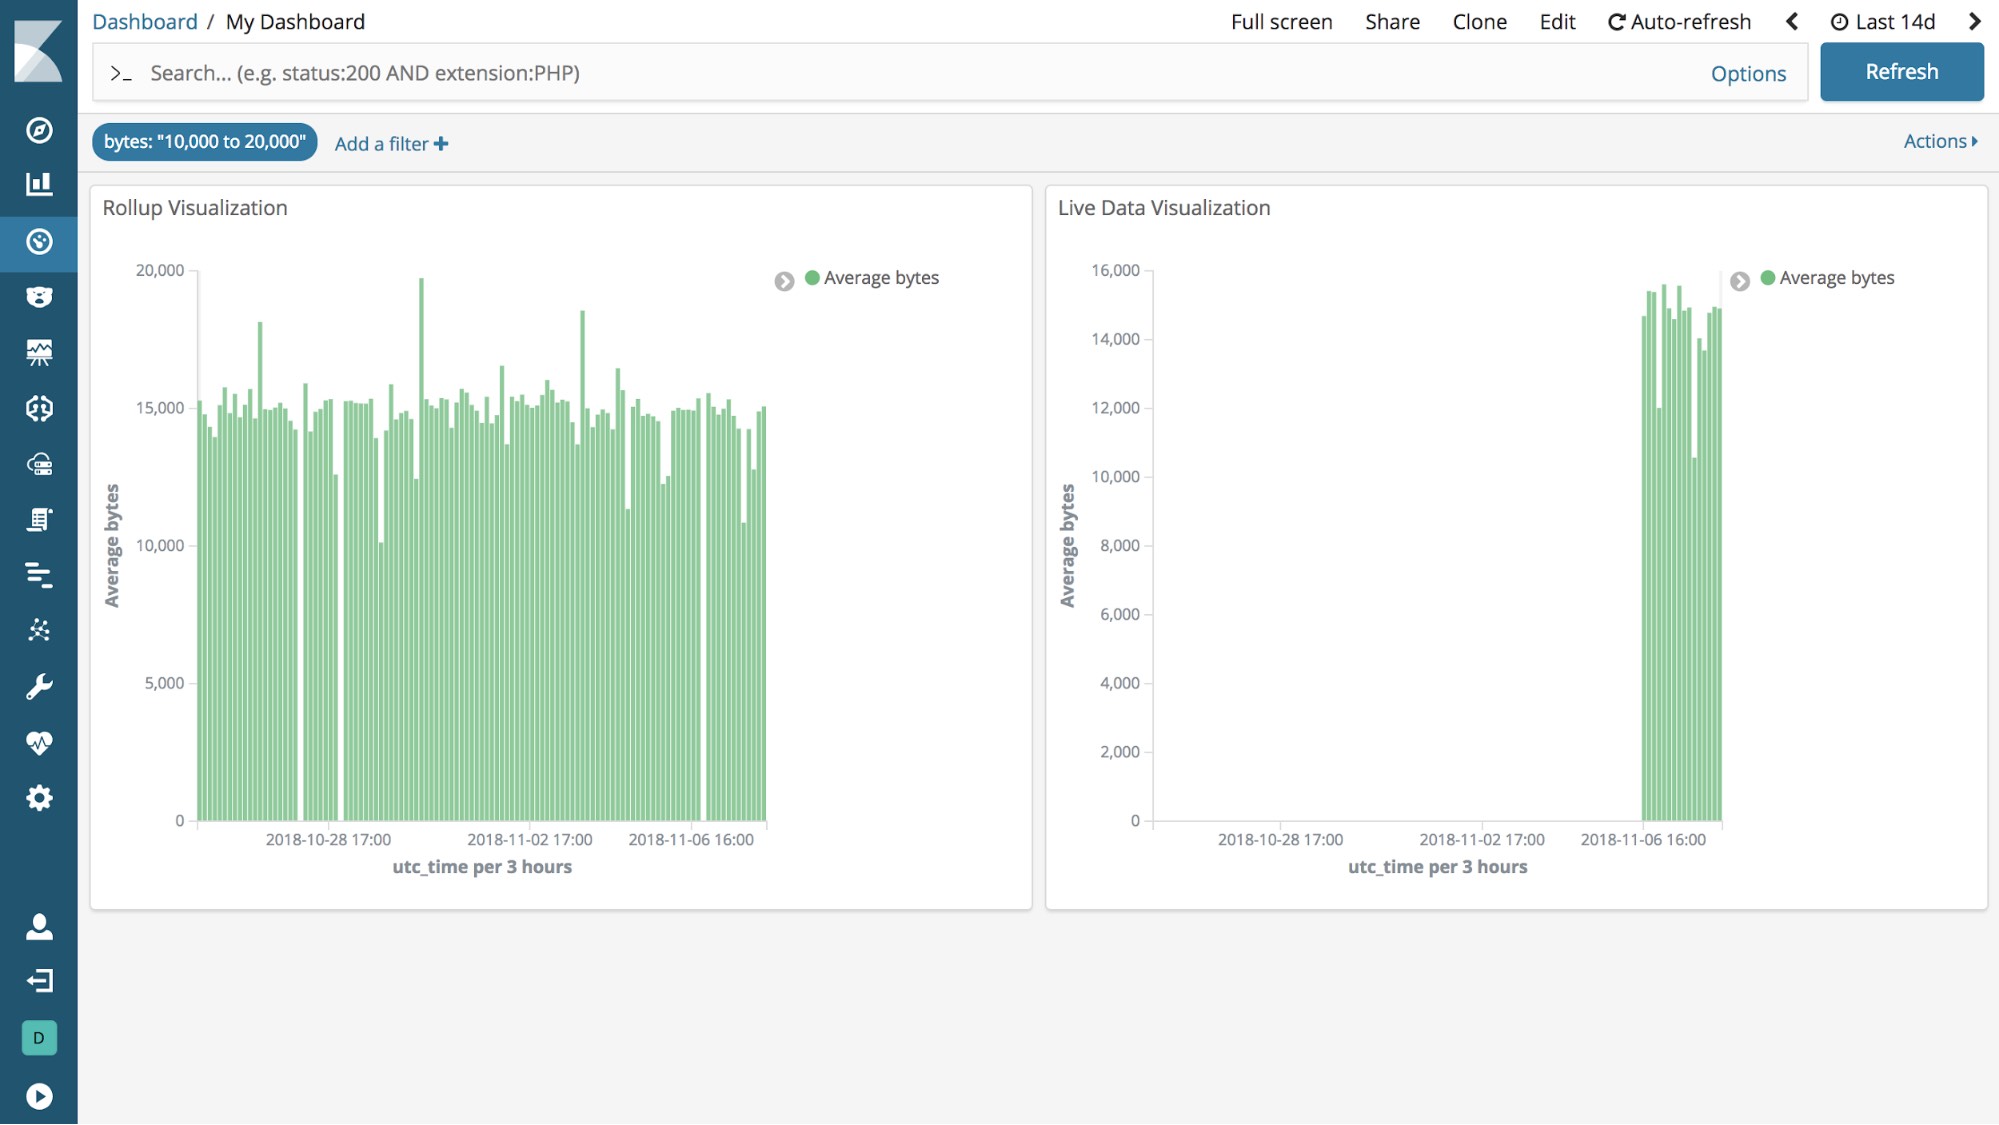
You can also create dashboards that use visualizations based on rolled up and raw data.

Wrapping up
Rollups are like any other Elasticsearch index, only much smaller, so you can query and aggregate them as you would any other index. The features introduced in Kibana 6.5 provide new tools for you to create, manage, and visualize rolled up data.
You can check out the Elasticsearch documentation to learn more about rolled up data and the rollup API.