Elastic APM 7.8.0 released
We are pleased to announce the release of Elastic APM 7.8.0 — available on Elasticsearch Service, or when you download the Elastic Stack. This release brings exciting new changes to the APM app with smarter service maps, an annotation API, and a lot of new out-of-the-box instrumentations across our agents.
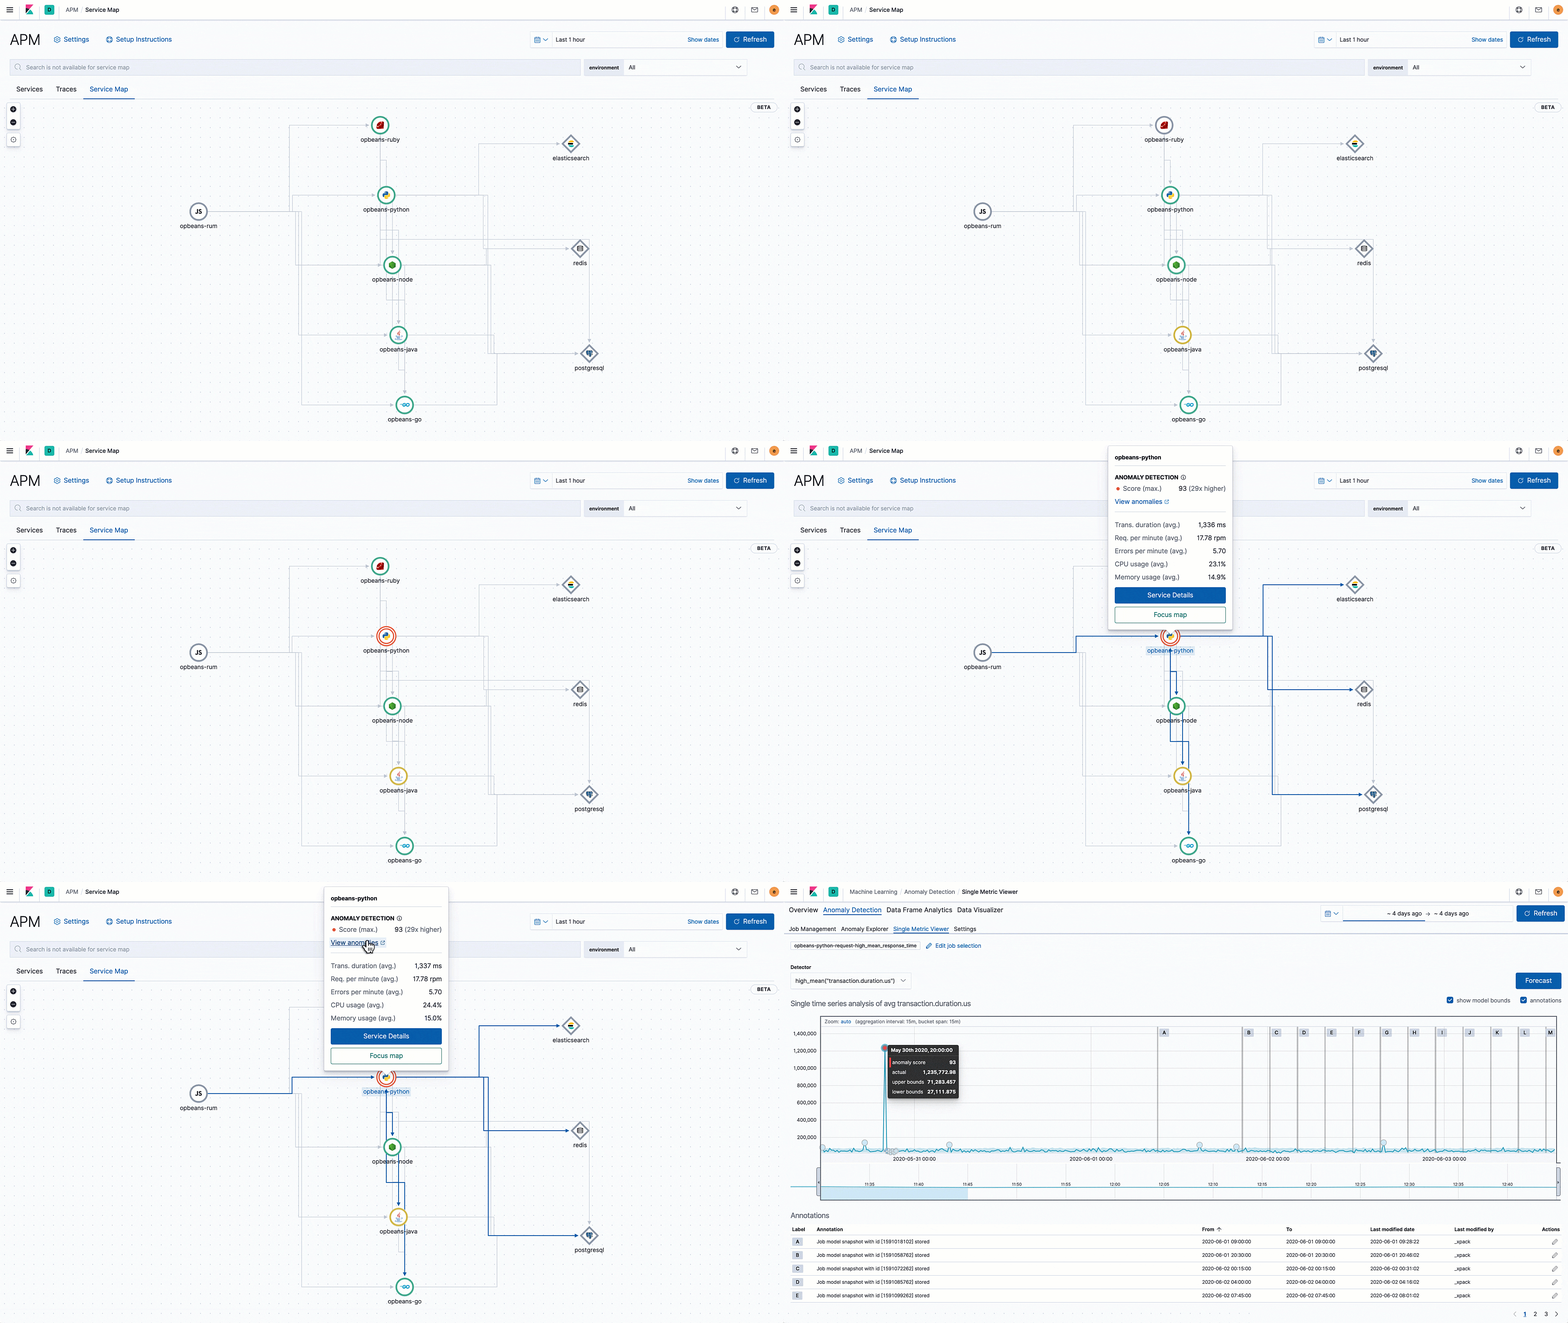
Smarter service maps with contextual health information
Service maps just got a whole lot smarter in 7.8! Service maps are now integrated with machine learning anomaly detection jobs, which means that once enabled, the maps will surface the real-time health of all your instrumented services.
We see a lot of cloud and app ops facing challenges while monitoring complex modern applications, continuously digging for a root cause. Being able to quickly pinpoint troubled services along with the health of all upstream and downstream services will help you fix issues before they impact end users.
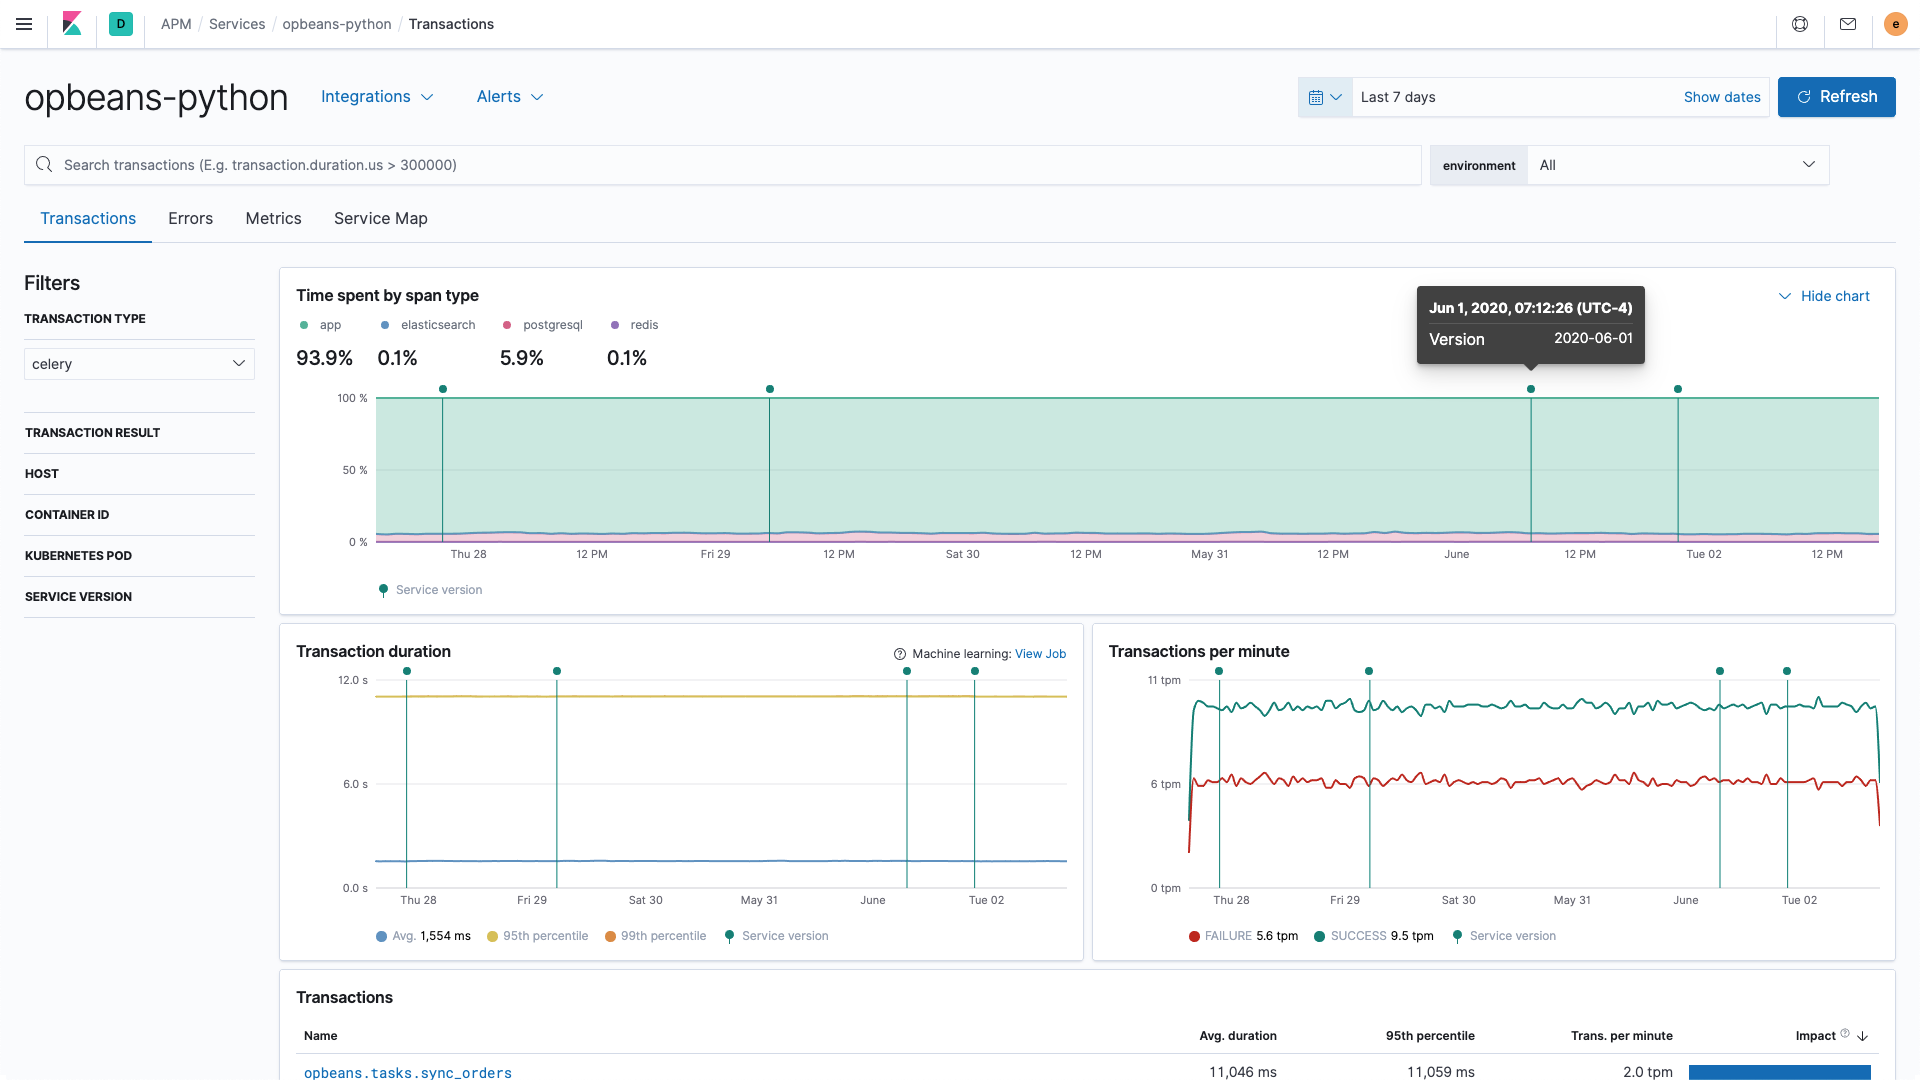
Track your deployments — your way!
In 7.6 we introduced deployment annotations on APM charts. With support for deployment annotations, it is easy to identify performance issues that might have been introduced by a new deployment or track the performance of your applications across the different deployed versions over time. This release makes deployment tracking infinitely more customizable. The Annotation API allows you to integrate with your favorite CI/CD pipeline tools to track deployments. Alternatively, you can also call the Annotation API to annotate your charts with other interesting events that you may want to track along with your application performance. Check out our documentation to help you get started with annotations in Elastic APM!
For example, to set the release to "2020-06-01," using curl and the required headers (substituting the actual password), we can run:
curl http://localhost:5601/api/apm/services/opbeans-java/annotation \
--user elastic:<password> \
--header "kbn-xsrf: API" \
--header 'Content-Type: application/json' \
--data '
{
    "@timestamp": "2020-06-01T11:12:26.000Z",
    "service": {
        "version": "2020-06-01",
        "environment": "production"
    },
    "message": "2020-06-01",
    "tags": [
        "elastic.co", "customer"
    ]
}
'
To add a deployment annotation:
Layer real user monitoring in the Maps app
Real user monitoring (RUM) is about understanding how your website is performing on the devices of real users. In production, there’s no one single “load time”; the experience a user has is heavily influenced by which device and browser they are using and where they are physically located.
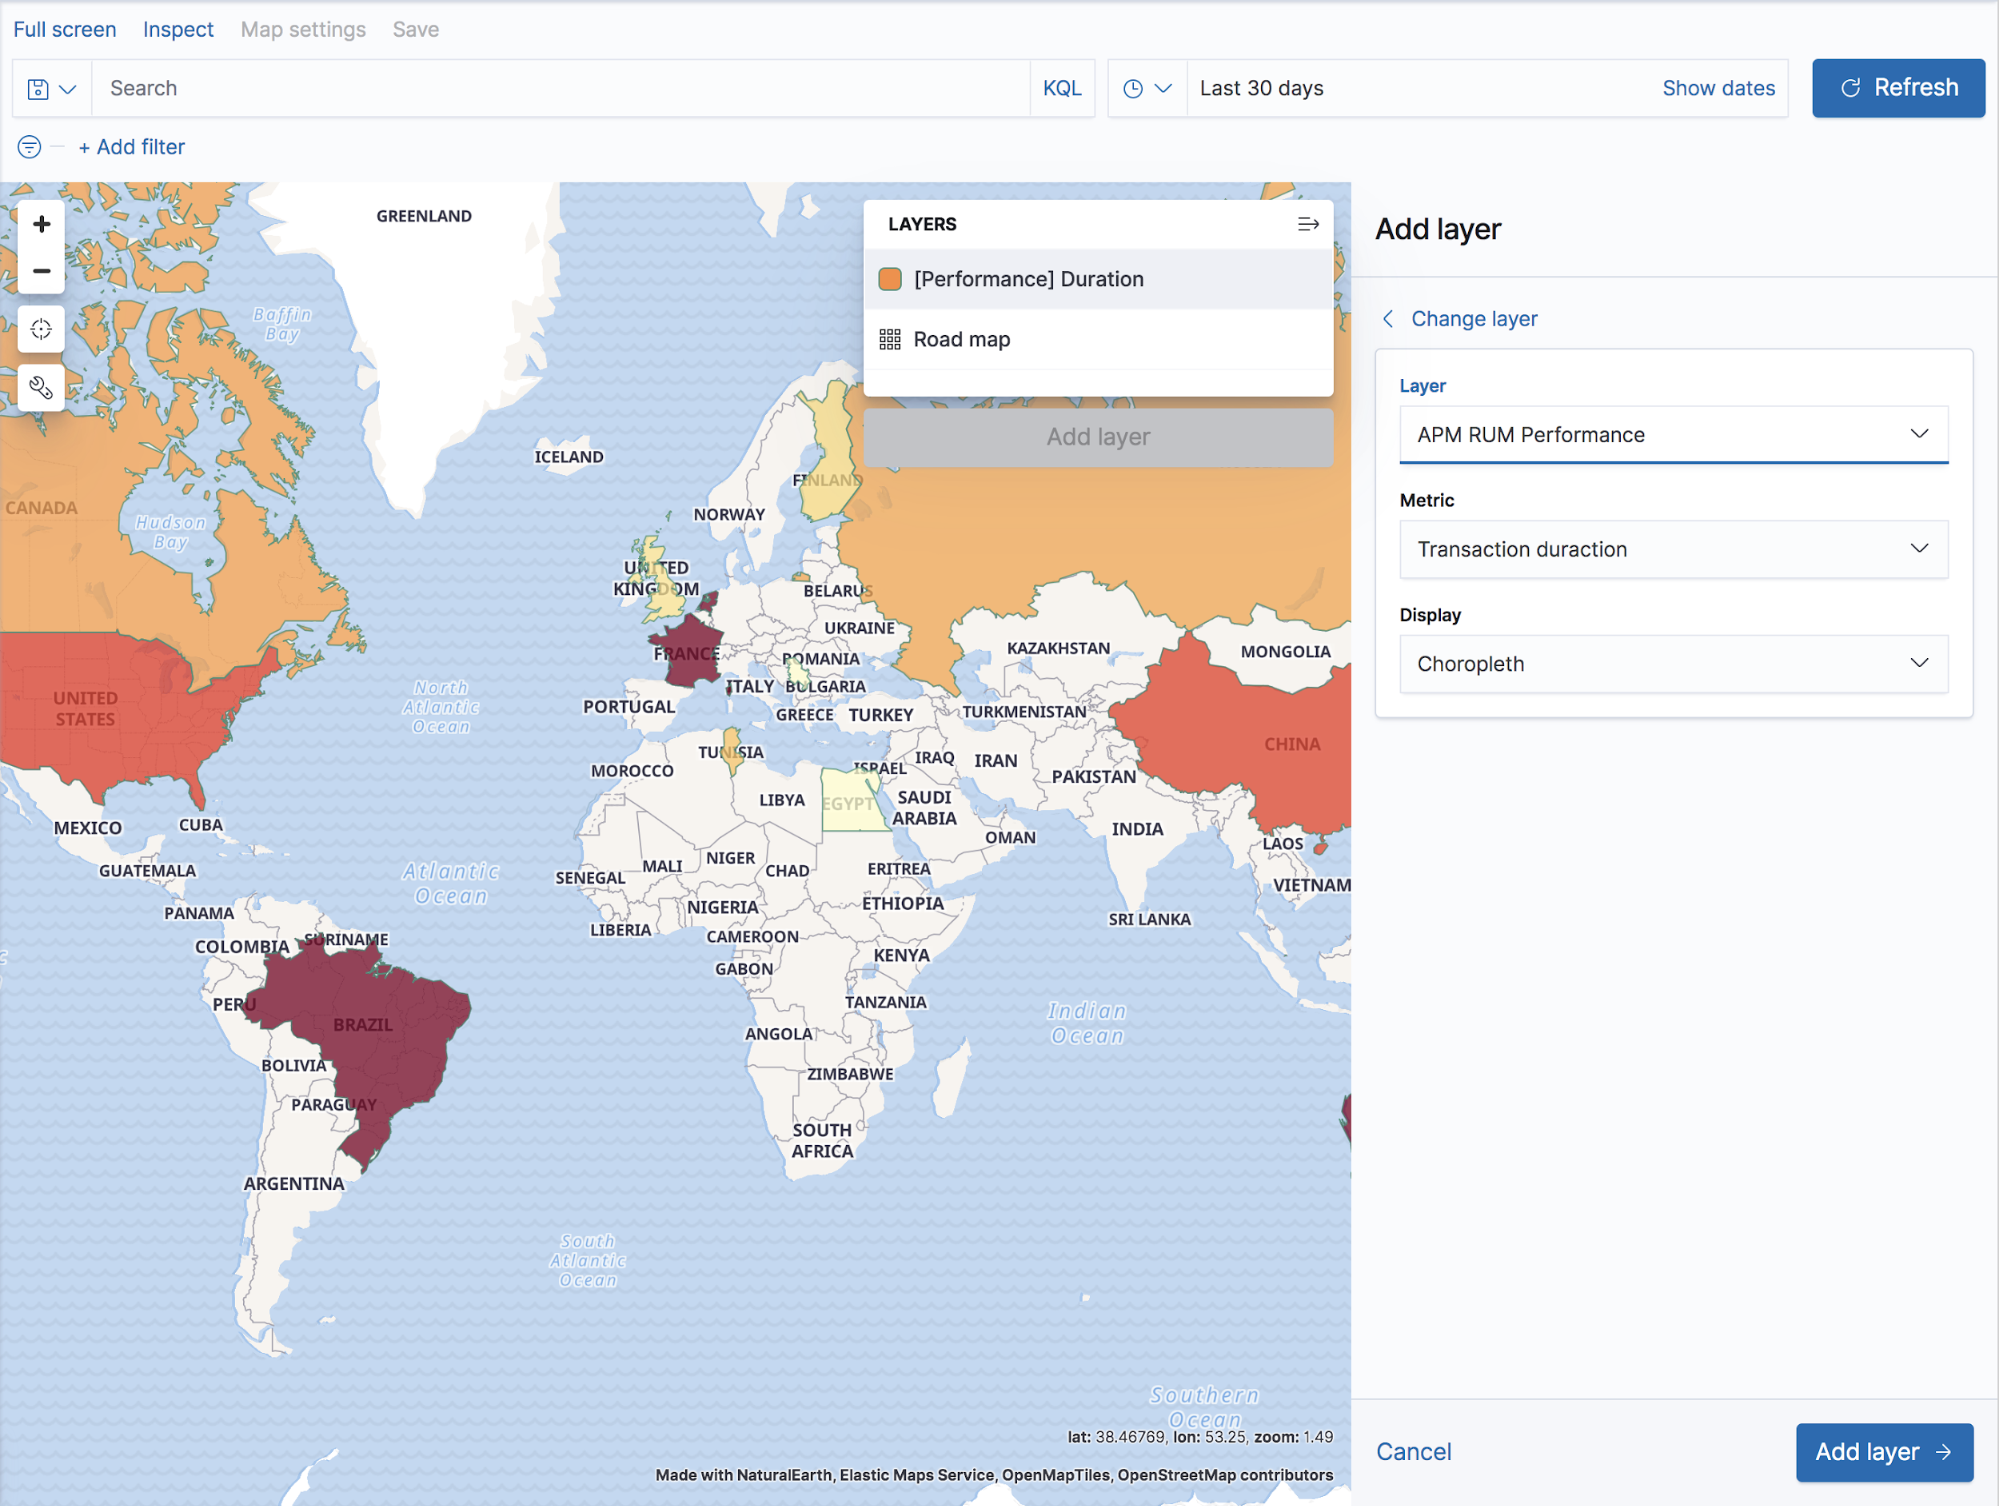
To make it easier to geographically visualize the performance of a website that’s instrumented with the Elastic RUM Agent, we’re very excited to announce the release of a dedicated Observability solution layer in the Maps app.
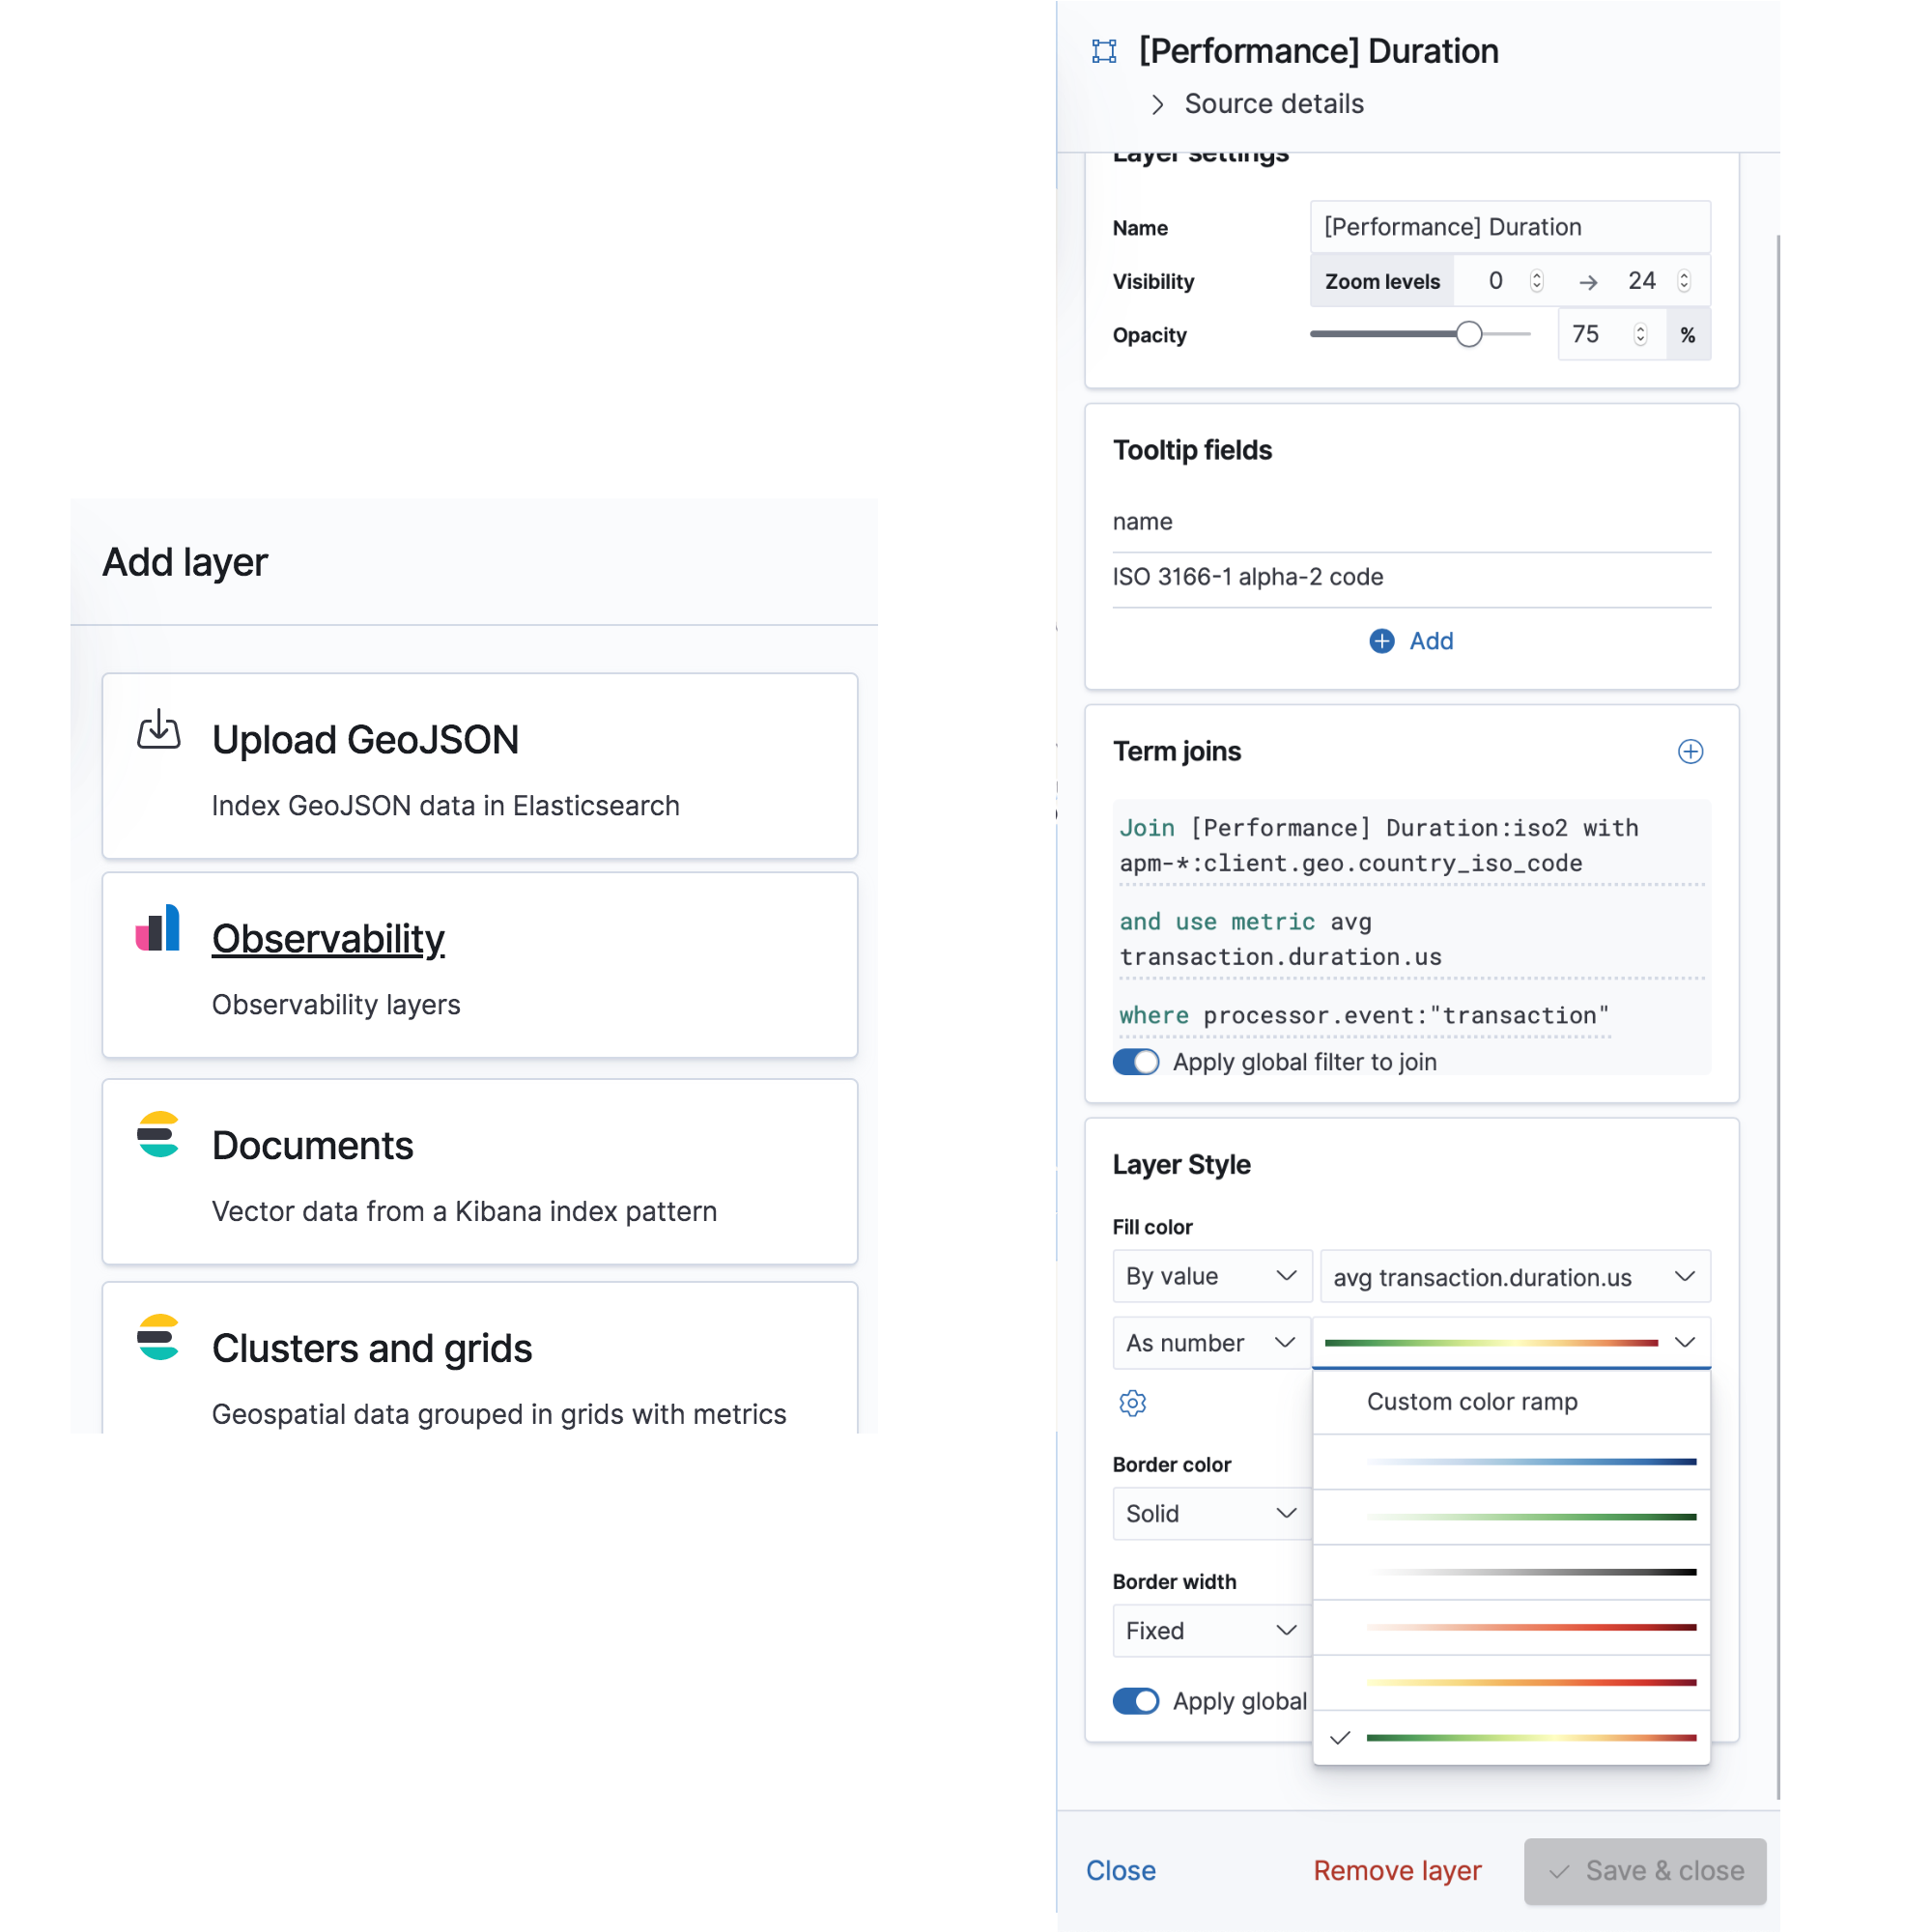
WIth this new feature, all it takes is three clicks to instantly gain easy-to-understand insight about your users’ experience and where they are coming from. And, if you want to take it further, there are advanced configuration options available. This kind of visualization is fantastic for spotting poorly optimized network connections (time to invest in a CDN?) or unexpected sources of traffic (maybe it’s time to tweak that targeted advertising campaign?). Give it a go yourself and see what insight is hidden in the data you already have.
Support for SqlClient in .NET APM Agent
In the theme of constantly improving the quality of data collected by our APM agents, we recently added out-of-the-box visibility into the SqlClient calls made from .NET applications.
SqlClient is the ADO.NET provider you use in your applications to access SQL server and Azure SQL databases. Now it is even easier to see those SQL databases both on the service maps and inside the distributed traces, which can be a lifesaver when analyzing performance issues caused by poor-performing SQL queries.
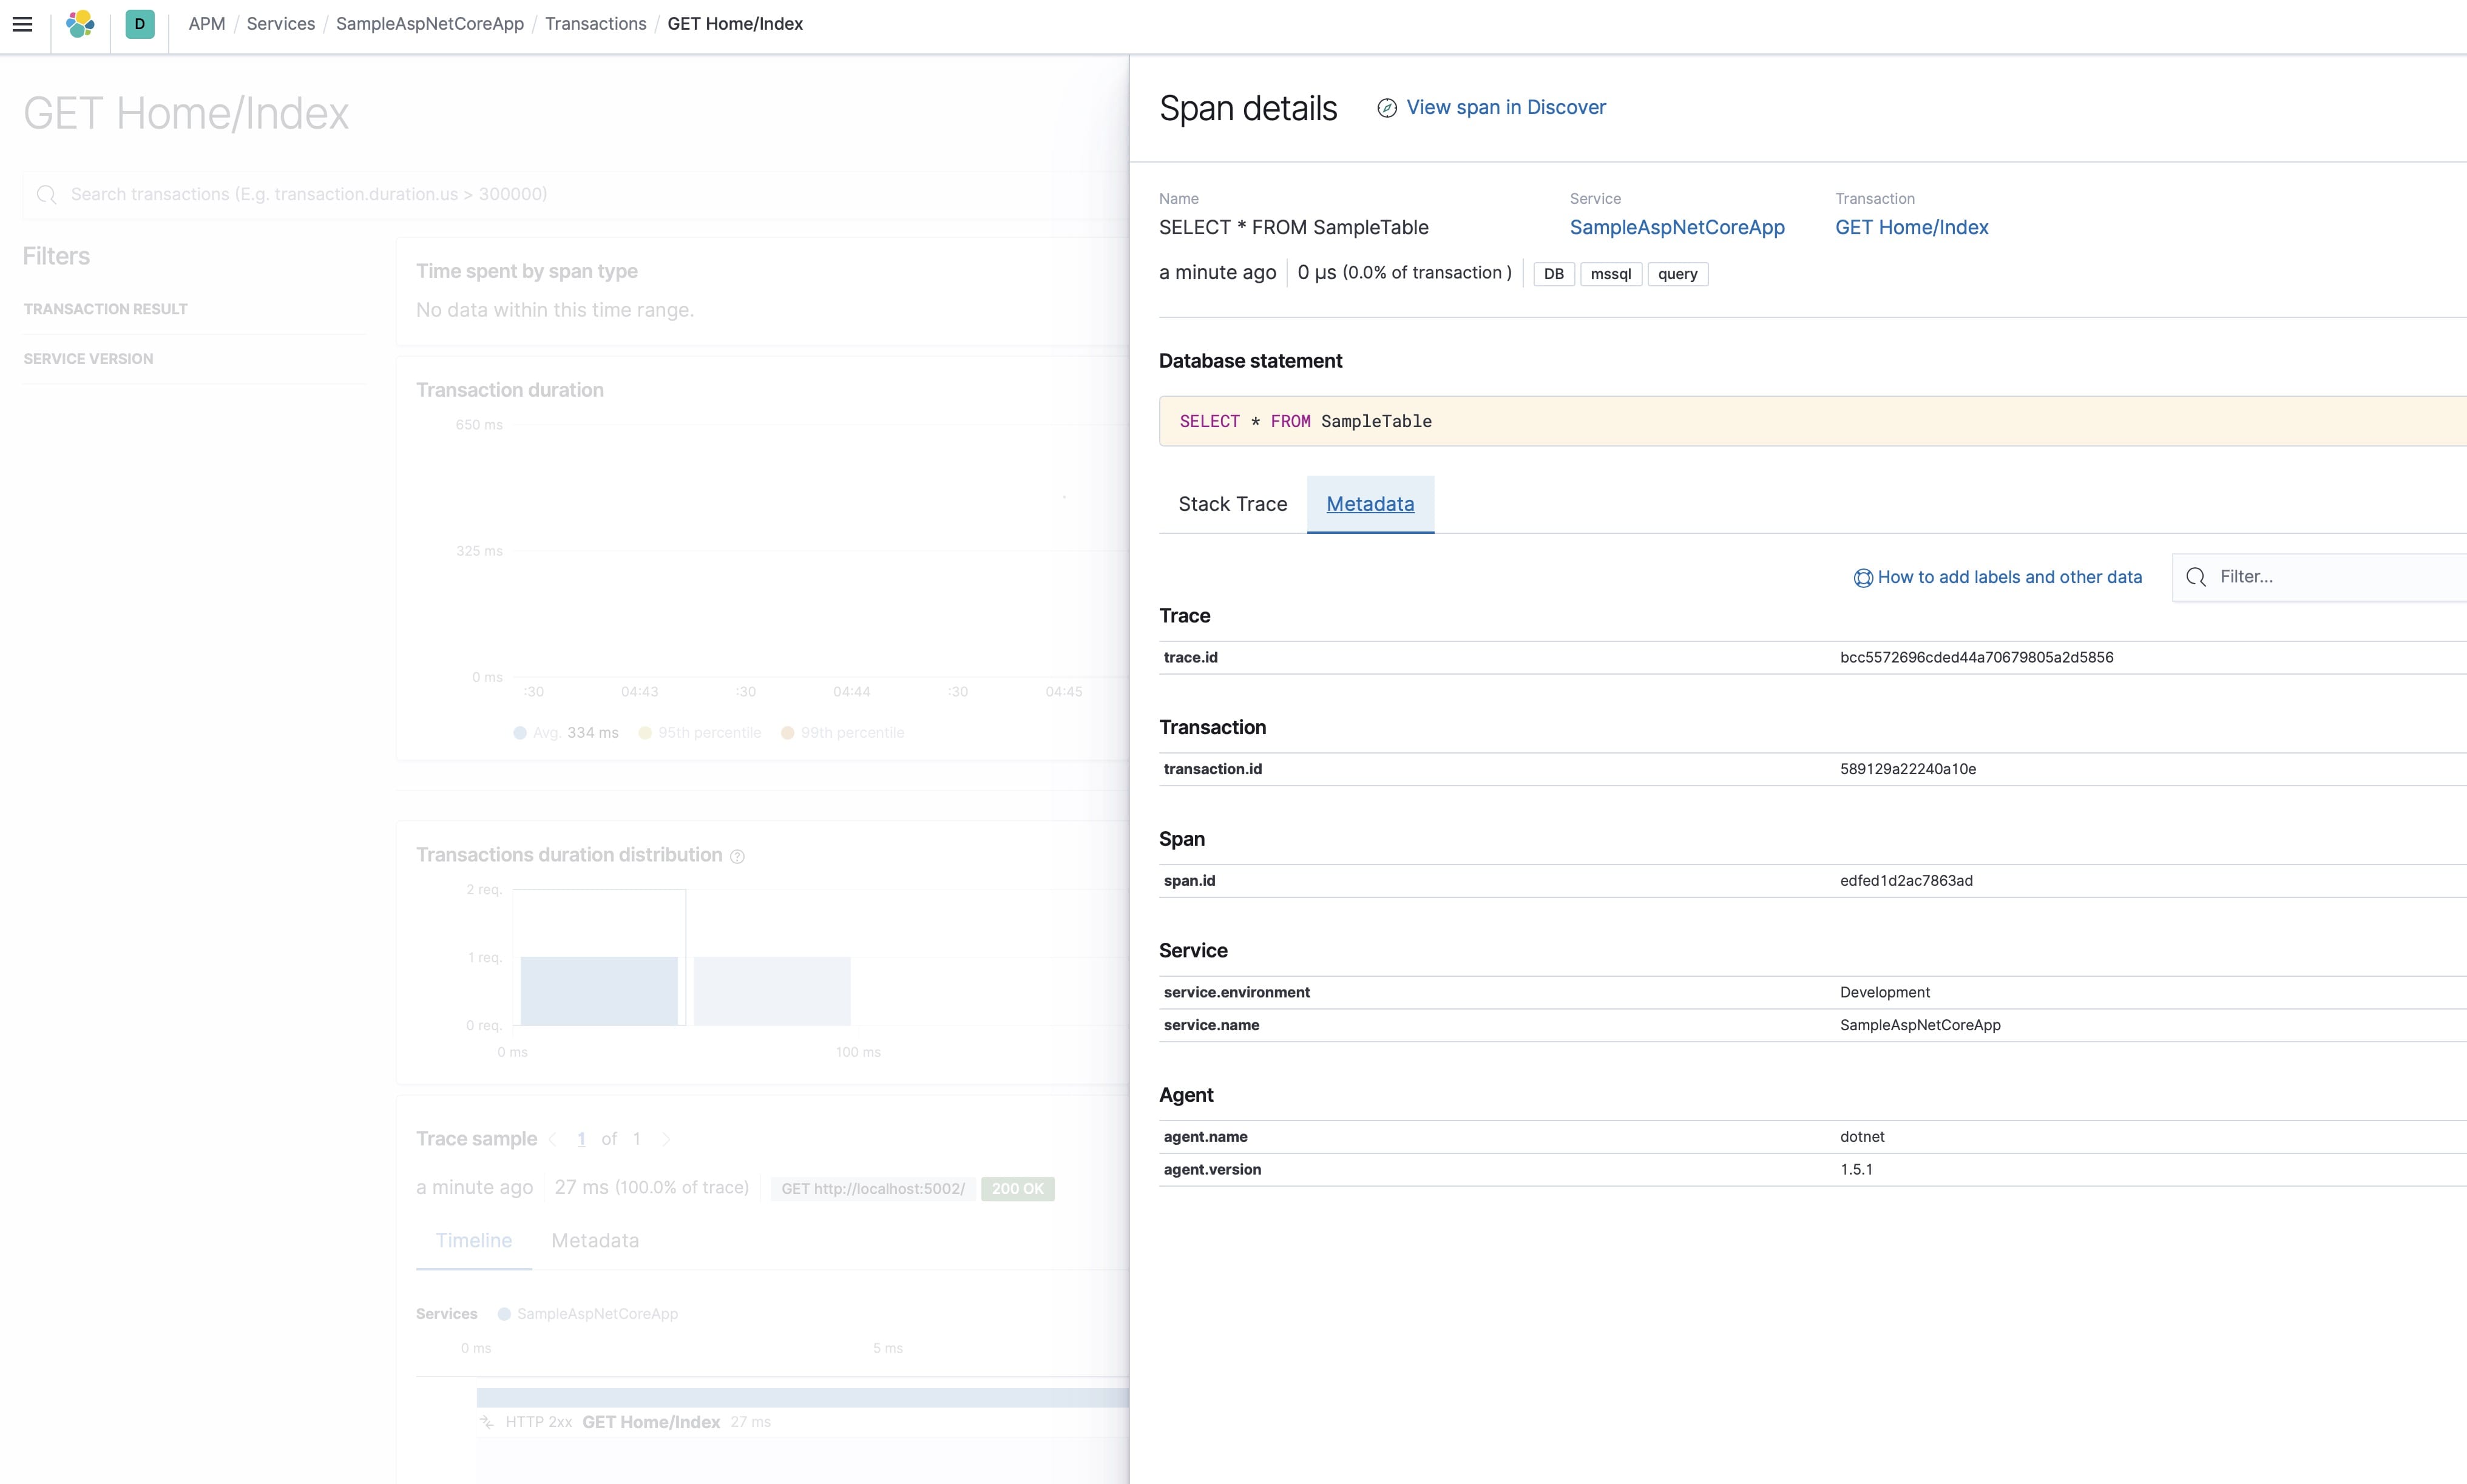
In order to get started, you only need to upgrade to the latest version of the .NET agent NetCoreAll NuGet package and re-deploy the application.
Try it out!
You can access the 7.8.0 Elastic APM app on Elasticsearch Service on Elastic Cloud, or you can download the Elastic Stack. Grab the APM Server (or leverage the one included with an Elasticsearch Service account), instrument your applications with the APM agents, and start monitoring your applications.