HAProxy Integration
| Version | 1.17.2 (View all) |
| Subscription level What's this? |
Basic |
| Developed by What's this? |
Elastic |
| Ingestion method(s) | API, File, Network Protocol |
| Minimum Kibana version(s) | 9.0.0 8.13.0 |
This integration periodically fetches logs and metrics from HAProxy servers.
The Integration can collect metrics in two datastreams from HAProxy: info and stat. info is not available when using the stats page. For more information, refer to the HAProxy module.
The log dataset was tested with logs from HAProxy 1.8, 1.9 and 2.0, 2.6 running on a Debian. It is not available on Windows.
The integration supports the following default log patterns:
The info and stat datasets were tested with HAProxy versions from 1.6, 1.7, 1.8 to 2.0.
If source.address is shown conflicted under metrics-* data view, then this issue can be solved by reindexing the stat data stream indices.
The log dataset collects the HAProxy application logs.
Example
{
    "@timestamp": "2018-07-30T09:03:52.726Z",
    "agent": {
        "ephemeral_id": "7eccbe53-c1e3-424d-8a1b-c290b8c2ca88",
        "id": "25ee0259-10b8-4a16-9f80-d18ce8ad6442",
        "name": "docker-fleet-agent",
        "type": "filebeat",
        "version": "8.0.0-beta1"
    },
    "data_stream": {
        "dataset": "haproxy.log",
        "namespace": "ep",
        "type": "logs"
    },
    "ecs": {
        "version": "8.11.0"
    },
    "elastic_agent": {
        "id": "25ee0259-10b8-4a16-9f80-d18ce8ad6442",
        "snapshot": false,
        "version": "8.0.0-beta1"
    },
    "event": {
        "agent_id_status": "verified",
        "category": [
            "web"
        ],
        "dataset": "haproxy.log",
        "duration": 2000000,
        "ingested": "2022-01-11T00:35:53Z",
        "kind": "event",
        "outcome": "success",
        "timezone": "+00:00"
    },
    "haproxy": {
        "backend_name": "docs_microservice",
        "backend_queue": 0,
        "bytes_read": 168,
        "connection_wait_time_ms": 1,
        "connections": {
            "active": 6,
            "backend": 0,
            "frontend": 6,
            "retries": 0,
            "server": 0
        },
        "frontend_name": "incoming~",
        "http": {
            "request": {
                "captured_cookie": "-",
                "captured_headers": [
                    "docs.example.internal"
                ],
                "raw_request_line": "GET /component---src-pages-index-js-4b15624544f97cf0bb8f.js HTTP/1.1",
                "time_wait_ms": 0,
                "time_wait_without_data_ms": 0
            },
            "response": {
                "captured_cookie": "-",
                "captured_headers": []
            }
        },
        "server_name": "docs",
        "server_queue": 0,
        "termination_state": "----",
        "total_waiting_time_ms": 0
    },
    "host": {
        "architecture": "x86_64",
        "containerized": true,
        "hostname": "docker-fleet-agent",
        "id": "4ccba669f0df47fa3f57a9e4169ae7f1",
        "ip": [
            "172.18.0.7"
        ],
        "mac": [
            "02-42-AC-1F-00-07"
        ],
        "name": "docker-fleet-agent",
        "os": {
            "codename": "Core",
            "family": "redhat",
            "kernel": "5.11.0-43-generic",
            "name": "CentOS Linux",
            "platform": "centos",
            "type": "linux",
            "version": "7 (Core)"
        }
    },
    "http": {
        "request": {
            "method": "GET"
        },
        "response": {
            "bytes": 168,
            "status_code": 304
        },
        "version": "1.1"
    },
    "input": {
        "type": "log"
    },
    "log": {
        "file": {
            "path": "/tmp/service_logs/haproxy.log"
        },
        "offset": 0
    },
    "process": {
        "name": "haproxy",
        "pid": 32450
    },
    "related": {
        "ip": [
            "67.43.156.13"
        ]
    },
    "source": {
        "address": "67.43.156.13",
        "as": {
            "number": 35908
        },
        "geo": {
            "continent_name": "Asia",
            "country_iso_code": "BT",
            "country_name": "Bhutan",
            "location": {
                "lat": 27.5,
                "lon": 90.5
            }
        },
        "ip": "67.43.156.13",
        "port": 38862
    },
    "tags": [
        "haproxy-log"
    ],
    "temp": {},
    "url": {
        "extension": "js",
        "original": "/component---src-pages-index-js-4b15624544f97cf0bb8f.js",
        "path": "/component---src-pages-index-js-4b15624544f97cf0bb8f.js"
    }
}
ECS Field Reference
Refer to the following document for detailed information on ECS fields.
Exported fields
| Field | Description | Type |
|---|---|---|
| @timestamp | Event timestamp. | date |
| cloud.image.id | Image ID for the cloud instance. | keyword |
| data_stream.dataset | Data stream dataset. | constant_keyword |
| data_stream.namespace | Data stream namespace. | constant_keyword |
| data_stream.type | Data stream type. | constant_keyword |
| event.dataset | Event dataset | constant_keyword |
| event.module | Event module | constant_keyword |
| haproxy.backend_name | Name of the backend (or listener) which was selected to manage the connection to the server. | keyword |
| haproxy.backend_queue | Total number of requests which were processed before this one in the backend's global queue. | long |
| haproxy.bind_name | Name of the listening address which received the connection. | keyword |
| haproxy.bytes_read | Total number of bytes transmitted to the client when the log is emitted. | long |
| haproxy.connection_wait_time_ms | Total time in milliseconds spent waiting for the connection to establish to the final server | long |
| haproxy.connections.active | Total number of concurrent connections on the process when the session was logged. | long |
| haproxy.connections.backend | Total number of concurrent connections handled by the backend when the session was logged. | long |
| haproxy.connections.fc_err | Returns the ID of the error that might have occurred on the current connection. Any strictly positive value of this fetch indicates that the connection did not succeed and would result in an error log being output | long |
| haproxy.connections.frontend | Total number of concurrent connections on the frontend when the session was logged. | long |
| haproxy.connections.retries | Number of connection retries experienced by this session when trying to connect to the server. | long |
| haproxy.connections.server | Total number of concurrent connections still active on the server when the session was logged. | long |
| haproxy.connections.ssl_c_ca_err | When the incoming connection was made over an SSL/TLS transport layer, returns the ID of the first error detected during verification of the client certificate at depth > 0, or 0 if no error was encountered during this verification process. | long |
| haproxy.connections.ssl_c_err | When the incoming connection was made over an SSL/TLS transport layer, returns the ID of the first error detected during verification at depth 0, or 0 if no error was encountered during this verification process. | long |
| haproxy.connections.ssl_fc_err | When the incoming connection was made over an SSL/TLS transport layer, returns the ID of the last error of the first error stack raised on the frontend side, or 0 if no error was encountered. It can be used to identify handshake related errors other than verify ones (such as cipher mismatch), as well as other read or write errors occurring during the connection's lifetime. | long |
| haproxy.error_message | Error message logged by HAProxy in case of error. | text |
| haproxy.frontend_name | Name of the frontend (or listener) which received and processed the connection. | keyword |
| haproxy.http.request.captured_cookie | Optional "name=value" entry indicating that the server has returned a cookie with its request. | keyword |
| haproxy.http.request.captured_headers | List of headers captured in the request due to the presence of the "capture request header" statement in the frontend. | keyword |
| haproxy.http.request.raw_request_line | Complete HTTP request line, including the method, request and HTTP version string. | keyword |
| haproxy.http.request.time_wait_ms | Total time in milliseconds spent waiting for a full HTTP request from the client (not counting body) after the first byte was received. | long |
| haproxy.http.request.time_wait_without_data_ms | Total time in milliseconds spent waiting for the server to send a full HTTP response, not counting data. | long |
| haproxy.http.response.captured_cookie | Optional "name=value" entry indicating that the client had this cookie in the response. | keyword |
| haproxy.http.response.captured_headers | List of headers captured in the response due to the presence of the "capture response header" statement in the frontend. | keyword |
| haproxy.mode | mode that the frontend is operating (TCP or HTTP) | keyword |
| haproxy.server_name | Name of the last server to which the connection was sent. | keyword |
| haproxy.server_queue | Total number of requests which were processed before this one in the server queue. | long |
| haproxy.source | The HAProxy source of the log | keyword |
| haproxy.tcp.connection_waiting_time_ms | Total time in milliseconds elapsed between the accept and the last close | long |
| haproxy.termination_state | Condition the session was in when the session ended. | keyword |
| haproxy.time_backend_connect | Total time in milliseconds spent waiting for the connection to establish to the final server, including retries. | long |
| haproxy.time_queue | Total time in milliseconds spent waiting in the various queues. | long |
| haproxy.total_waiting_time_ms | Total time in milliseconds spent waiting in the various queues | long |
| host.containerized | If the host is a container. | boolean |
| host.os.build | OS build information. | keyword |
| host.os.codename | OS codename, if any. | keyword |
| input.type | Input type | keyword |
| log.offset | Log offset | long |
The HAProxy info dataset collects general information about HAProxy processes.
Example
{
    "@timestamp": "2017-10-12T08:05:34.853Z",
    "agent": {
        "hostname": "host.example.com",
        "name": "host.example.com"
    },
    "event": {
        "dataset": "haproxy.info",
        "duration": 115000,
        "module": "haproxy"
    },
    "haproxy": {
        "info": {
            "compress": {
                "bps": {
                    "in": 0,
                    "out": 0,
                    "rate_limit": 0
                }
            },
            "connection": {
                "current": 0,
                "hard_max": 4000,
                "max": 4000,
                "rate": {
                    "limit": 0,
                    "max": 0,
                    "value": 0
                },
                "ssl": {
                    "current": 0,
                    "max": 0,
                    "total": 0
                },
                "total": 30
            },
            "idle": {
                "pct": 1
            },
            "memory": {
                "max": {
                    "bytes": 0
                }
            },
            "pipes": {
                "free": 0,
                "max": 0,
                "used": 0
            },
            "process_num": 1,
            "processes": 1,
            "requests": {
                "total": 30
            },
            "run_queue": 0,
            "session": {
                "rate": {
                    "limit": 0,
                    "max": 0,
                    "value": 0
                }
            },
            "sockets": {
                "max": 8034
            },
            "ssl": {
                "backend": {
                    "key_rate": {
                        "max": 0,
                        "value": 0
                    }
                },
                "cache_misses": 0,
                "cached_lookups": 0,
                "frontend": {
                    "key_rate": {
                        "max": 0,
                        "value": 0
                    },
                    "session_reuse": {
                        "pct": 0
                    }
                },
                "rate": {
                    "limit": 0,
                    "max": 0,
                    "value": 0
                }
            },
            "tasks": 7,
            "ulimit_n": 8034,
            "uptime": {
                "sec": 30
            },
            "zlib_mem_usage": {
                "max": 0,
                "value": 0
            }
        }
    },
    "metricset": {
        "name": "info"
    },
    "process": {
        "pid": 7
    },
    "service": {
        "address": "127.0.0.1:14567",
        "type": "haproxy"
    }
}
The fields reported are:
ECS Field Reference
Refer to the following document for detailed information on ECS fields.
Exported fields
| Field | Description | Type | Metric Type |
|---|---|---|---|
| @timestamp | Event timestamp. | date | |
| agent.id | keyword | ||
| cloud.account.id | The cloud account or organization id used to identify different entities in a multi-tenant environment. Examples: AWS account id, Google Cloud ORG Id, or other unique identifier. | keyword | |
| cloud.availability_zone | Availability zone in which this host is running. | keyword | |
| cloud.image.id | Image ID for the cloud instance. | keyword | |
| cloud.instance.id | Instance ID of the host machine. | keyword | |
| cloud.provider | Name of the cloud provider. Example values are aws, azure, gcp, or digitalocean. | keyword | |
| cloud.region | Region in which this host is running. | keyword | |
| container.id | Unique container id. | keyword | |
| data_stream.dataset | Data stream dataset. | constant_keyword | |
| data_stream.namespace | Data stream namespace. | constant_keyword | |
| data_stream.type | Data stream type. | constant_keyword | |
| event.dataset | Event dataset | constant_keyword | |
| event.module | Event module | constant_keyword | |
| haproxy.info.busy_polling | Number of busy polling. | long | gauge |
| haproxy.info.bytes.out.rate | Average bytes output rate. | long | gauge |
| haproxy.info.bytes.out.total | Number of bytes sent out. | long | gauge |
| haproxy.info.compress.bps.in | Incoming compressed data in bits per second. | long | gauge |
| haproxy.info.compress.bps.out | Outgoing compressed data in bits per second. | long | gauge |
| haproxy.info.compress.bps.rate_limit | Rate limit of compressed data in bits per second. | long | gauge |
| haproxy.info.connection.current | Current connections. | long | gauge |
| haproxy.info.connection.hard_max | long | gauge | |
| haproxy.info.connection.max | Maximum connections. | long | gauge |
| haproxy.info.connection.rate.limit | Rate limit of connections. | long | gauge |
| haproxy.info.connection.rate.max | Maximum rate of connections. | long | gauge |
| haproxy.info.connection.rate.value | Number of connections in the last second. | long | gauge |
| haproxy.info.connection.ssl.current | Current SSL connections. | long | gauge |
| haproxy.info.connection.ssl.max | Maximum SSL connections. | long | gauge |
| haproxy.info.connection.ssl.total | Total SSL connections. | long | counter |
| haproxy.info.connection.total | Total connections. | long | counter |
| haproxy.info.dropped_logs | Number of dropped logs. | long | gauge |
| haproxy.info.failed_resolutions | Number of failed resolutions. | long | gauge |
| haproxy.info.idle.pct | Percentage of idle time. | scaled_float | gauge |
| haproxy.info.jobs | Number of all jobs. | long | gauge |
| haproxy.info.listeners | Number of listeners. | long | gauge |
| haproxy.info.memory.max.bytes | Maximum amount of memory usage in bytes (the 'Memmax_MB' value converted to bytes). | long | gauge |
| haproxy.info.peers.active | Number of active peers. | long | gauge |
| haproxy.info.peers.connected | Number of connected peers. | long | gauge |
| haproxy.info.pipes.free | Number of free pipes. | integer | gauge |
| haproxy.info.pipes.max | Maximum number of used pipes. | integer | gauge |
| haproxy.info.pipes.used | Number of used pipes during kernel-based tcp splicing. | integer | gauge |
| haproxy.info.pool.allocated | Size of the allocated pool. | long | gauge |
| haproxy.info.pool.failed | Number of failed connections to pool members. | long | counter |
| haproxy.info.pool.used | Number of members used from the allocated pool. | long | gauge |
| haproxy.info.process_num | Process number. | long | gauge |
| haproxy.info.processes | Number of processes. | long | gauge |
| haproxy.info.requests.max | Maximum number of requests. | long | gauge |
| haproxy.info.requests.total | Total number of requests. | long | counter |
| haproxy.info.run_queue | long | gauge | |
| haproxy.info.session.rate.limit | Rate limit of sessions. | integer | gauge |
| haproxy.info.session.rate.max | Maximum rate of sessions. | integer | gauge |
| haproxy.info.session.rate.value | Rate of session per seconds. | integer | gauge |
| haproxy.info.sockets.max | Maximum number of sockets. | long | gauge |
| haproxy.info.ssl.backend.key_rate.max | Maximum key rate of SSL backend sessions. | integer | gauge |
| haproxy.info.ssl.backend.key_rate.value | Key rate of SSL backend sessions. | integer | gauge |
| haproxy.info.ssl.cache_misses | Number of SSL cache misses. | long | counter |
| haproxy.info.ssl.cached_lookups | Number of SSL cache lookups. | long | counter |
| haproxy.info.ssl.frontend.key_rate.max | Maximum key rate of SSL frontend. | integer | gauge |
| haproxy.info.ssl.frontend.key_rate.value | Key rate of SSL frontend. | integer | gauge |
| haproxy.info.ssl.frontend.session_reuse.pct | Rate of reuse of SSL frontend sessions. | scaled_float | gauge |
| haproxy.info.ssl.rate.limit | Rate limit of SSL requests. | integer | gauge |
| haproxy.info.ssl.rate.max | Maximum rate of SSL requests. | integer | gauge |
| haproxy.info.ssl.rate.value | Rate of SSL requests. | integer | gauge |
| haproxy.info.stopping | Number of stopping jobs. | long | gauge |
| haproxy.info.tasks | long | gauge | |
| haproxy.info.threads | Number of threads. | long | gauge |
| haproxy.info.ulimit_n | Maximum number of open files for the process. | long | gauge |
| haproxy.info.unstoppable_jobs | Number of unstoppable jobs. | long | gauge |
| haproxy.info.uptime.sec | Current uptime in seconds. | long | gauge |
| haproxy.info.zlib_mem_usage.max | Maximum memory usage of zlib. | integer | gauge |
| haproxy.info.zlib_mem_usage.value | Memory usage of zlib. | integer | gauge |
| host.containerized | If the host is a container. | boolean | |
| host.name | Name of the host. It can contain what hostname returns on Unix systems, the fully qualified domain name, or a name specified by the user. The sender decides which value to use. |
keyword | |
| host.os.build | OS build information. | keyword | |
| host.os.codename | OS codename, if any. | keyword | |
| process.pid | Process id. | long | |
| service.address | Address where data about this service was collected from. This should be a URI, network address (ipv4:port or [ipv6]:port) or a resource path (sockets). | keyword |
The HAProxy stat metricset collects stat fields from HAProxy processes.
See section "9.1. CSV format" of the official HAProxy Management Guide for a full list of stat fields.
Example
{
    "@timestamp": "2017-10-12T08:05:34.853Z",
    "agent": {
        "hostname": "host.example.com",
        "name": "host.example.com"
    },
    "event": {
        "dataset": "haproxy.stat",
        "duration": 115000,
        "module": "haproxy"
    },
    "haproxy": {
        "stat": {
            "check": {
                "agent.last": "",
                "health.last": "",
                "status": ""
            },
            "component_type": 0,
            "compressor": {
                "bypassed.bytes": 0,
                "in.bytes": 0,
                "out.bytes": 0,
                "response.bytes": 0
            },
            "connection": {
                "total": 0
            },
            "in.bytes": 0,
            "out.bytes": 0,
            "proxy": {
                "id": 2,
                "name": "stat"
            },
            "queue": {},
            "request": {
                "denied": 0,
                "errors": 0,
                "rate": {
                    "max": 0,
                    "value": 0
                },
                "total": 0
            },
            "response": {
                "denied": 0,
                "http": {
                    "1xx": 0,
                    "2xx": 0,
                    "3xx": 0,
                    "4xx": 0,
                    "5xx": 0,
                    "other": 0
                }
            },
            "server": {
                "id": 0
            },
            "service_name": "FRONTEND",
            "session": {
                "current": 0,
                "limit": 25000,
                "max": 0,
                "rate": {
                    "limit": 0,
                    "max": 0,
                    "value": 0
                }
            },
            "status": "OPEN"
        }
    },
    "metricset": {
        "name": "stat"
    },
    "process": {
        "pid": 1
    },
    "service": {
        "address": "127.0.0.1:14567",
        "type": "haproxy"
    }
}
The fields reported are:
ECS Field Reference
Refer to the following document for detailed information on ECS fields.
Exported fields
| Field | Description | Type | Metric Type |
|---|---|---|---|
| @timestamp | Event timestamp. | date | |
| agent.id | keyword | ||
| cloud.account.id | The cloud account or organization id used to identify different entities in a multi-tenant environment. Examples: AWS account id, Google Cloud ORG Id, or other unique identifier. | keyword | |
| cloud.availability_zone | Availability zone in which this host is running. | keyword | |
| cloud.image.id | Image ID for the cloud instance. | keyword | |
| cloud.instance.id | Instance ID of the host machine. | keyword | |
| cloud.provider | Name of the cloud provider. Example values are aws, azure, gcp, or digitalocean. | keyword | |
| cloud.region | Region in which this host is running. | keyword | |
| container.id | Unique container id. | keyword | |
| data_stream.dataset | Data stream dataset. | constant_keyword | |
| data_stream.namespace | Data stream namespace. | constant_keyword | |
| data_stream.type | Data stream type. | constant_keyword | |
| event.dataset | Event dataset | constant_keyword | |
| event.module | Event module | constant_keyword | |
| haproxy.stat.agent.check.description | Human readable version of check. | keyword | |
| haproxy.stat.agent.check.fall | Fall value of server. | integer | |
| haproxy.stat.agent.check.health | Health parameter of server. Between 0 and agent.check.rise+agent.check.fall-1. |
integer | |
| haproxy.stat.agent.check.rise | Rise value of server. | integer | |
| haproxy.stat.agent.code | Value reported by agent. | integer | |
| haproxy.stat.agent.description | Human readable version of agent.status. | keyword | |
| haproxy.stat.agent.duration | Duration of the last check in ms. | integer | |
| haproxy.stat.agent.fall | Fall value of agent. | integer | |
| haproxy.stat.agent.health | Health parameter of agent. Between 0 and agent.rise+agent.fall-1. |
integer | |
| haproxy.stat.agent.rise | Rise value of agent. | integer | |
| haproxy.stat.agent.status | Status of the last health check. One of: UNK -> unknown INI -> initializing SOCKERR -> socket error L4OK -> check passed on layer 4, no upper layers enabled L4TOUT -> layer 1-4 timeout L4CON -> layer 1-4 connection problem, for example "Connection refused" (tcp rst) or "No route to host" (icmp) L7OK -> agent reported "up" L7STS -> agent reported "fail", "stop" or "down" | keyword | |
| haproxy.stat.check.agent.last | integer | ||
| haproxy.stat.check.code | Layer 5-7 code, if available. | long | |
| haproxy.stat.check.down | Number of UP->DOWN transitions. For backends, this value is the number of transitions to the whole backend being down, rather than the sum of the transitions for each server. | long | counter |
| haproxy.stat.check.duration | Time in ms that it took to finish the last health check. | long | gauge |
| haproxy.stat.check.failed | Number of checks that failed while the server was up. | long | counter |
| haproxy.stat.check.health.fail | Number of failed checks. | long | |
| haproxy.stat.check.health.last | The result of the last health check. | keyword | |
| haproxy.stat.check.status | Status of the last health check. One of: UNK -> unknown INI -> initializing SOCKERR -> socket error L4OK -> check passed on layer 4, no upper layers testing enabled L4TOUT -> layer 1-4 timeout L4CON -> layer 1-4 connection problem, for example "Connection refused" (tcp rst) or "No route to host" (icmp) L6OK -> check passed on layer 6 L6TOUT -> layer 6 (SSL) timeout L6RSP -> layer 6 invalid response - protocol error L7OK -> check passed on layer 7 L7OKC -> check conditionally passed on layer 7, for example 404 with disable-on-404 L7TOUT -> layer 7 (HTTP/SMTP) timeout L7RSP -> layer 7 invalid response - protocol error L7STS -> layer 7 response error, for example HTTP 5xx | keyword | |
| haproxy.stat.client.aborted | Number of data transfers aborted by the client. | integer | counter |
| haproxy.stat.component_type | Component type (0=frontend, 1=backend, 2=server, or 3=socket/listener). | integer | |
| haproxy.stat.compressor.bypassed.bytes | Number of bytes that bypassed the HTTP compressor (CPU/BW limit). | long | counter |
| haproxy.stat.compressor.in.bytes | Number of HTTP response bytes fed to the compressor. | long | counter |
| haproxy.stat.compressor.out.bytes | Number of HTTP response bytes emitted by the compressor. | integer | counter |
| haproxy.stat.compressor.response.bytes | Number of HTTP responses that were compressed. | long | counter |
| haproxy.stat.connection.attempt.total | Number of connection establishment attempts. | long | counter |
| haproxy.stat.connection.cache.hits | Number of cache hits. | long | counter |
| haproxy.stat.connection.cache.lookup.total | Number of cache lookups. | long | counter |
| haproxy.stat.connection.idle.limit | Limit on idle connections available for reuse. | long | gauge |
| haproxy.stat.connection.idle.total | Number of idle connections available for reuse. | long | gauge |
| haproxy.stat.connection.rate | Number of connections over the last second. | long | gauge |
| haproxy.stat.connection.rate_max | Highest value of connection.rate. | long | gauge |
| haproxy.stat.connection.retried | Number of times a connection to a server was retried. | long | counter |
| haproxy.stat.connection.reuse.total | Number of connection reuses. | long | counter |
| haproxy.stat.connection.time.avg | Average connect time in ms over the last 1024 requests. | long | gauge |
| haproxy.stat.connection.total | Cumulative number of frontend connections. | long | counter |
| haproxy.stat.cookie | Cookie value of the server or the name of the cookie of the backend. | keyword | |
| haproxy.stat.downtime | Total downtime (in seconds). For backends, this value is the downtime for the whole backend, not the sum of the downtime for the servers. | long | counter |
| haproxy.stat.header.rewrite.failed.total | Number of failed header rewrite warnings. | long | counter |
| haproxy.stat.in.bytes | Bytes in. | long | counter |
| haproxy.stat.last_change | Number of seconds since the last UP->DOWN or DOWN->UP transition. | integer | gauge |
| haproxy.stat.load_balancing_algorithm | Load balancing algorithm. | keyword | |
| haproxy.stat.out.bytes | Bytes out. | long | counter |
| haproxy.stat.proxy.id | Unique proxy ID. | integer | |
| haproxy.stat.proxy.mode | Proxy mode (tcp, http, health, unknown). | keyword | |
| haproxy.stat.proxy.name | Proxy name. | keyword | |
| haproxy.stat.queue.limit | Configured queue limit (maxqueue) for the server, or nothing if the value of maxqueue is 0 (meaning no limit). | integer | |
| haproxy.stat.queue.time.avg | The average queue time in ms over the last 1024 requests. | integer | gauge |
| haproxy.stat.request.connection.errors | Number of requests that encountered an error trying to connect to a server. For backends, this field reports the sum of the stat for all backend servers, plus any connection errors not associated with a particular server (such as the backend having no active servers). | long | counter |
| haproxy.stat.request.denied | Requests denied because of security concerns. * For TCP this is because of a matched tcp-request content rule. * For HTTP this is because of a matched http-request or tarpit rule. | long | counter |
| haproxy.stat.request.denied_by_connection_rules | Requests denied because of TCP request connection rules. | long | counter |
| haproxy.stat.request.denied_by_session_rules | Requests denied because of TCP request session rules. | long | counter |
| haproxy.stat.request.errors | Request errors. Some of the possible causes are: * early termination from the client, before the request has been sent * read error from the client * client timeout * client closed connection * various bad requests from the client. * request was tarpitted. | long | counter |
| haproxy.stat.request.intercepted | Number of intercepted requests. | long | counter |
| haproxy.stat.request.queued.current | Current queued requests. For backends, this field reports the number of requests queued without a server assigned. | long | gauge |
| haproxy.stat.request.queued.max | Maximum value of queued.current. | long | gauge |
| haproxy.stat.request.rate.max | Maximum number of HTTP requests per second. | long | gauge |
| haproxy.stat.request.rate.value | Number of HTTP requests per second over the last elapsed second. | long | gauge |
| haproxy.stat.request.redispatched | Number of times a request was redispatched to another server. For servers, this field reports the number of times the server was switched away from. | long | counter |
| haproxy.stat.request.total | Total number of HTTP requests received. | long | counter |
| haproxy.stat.response.denied | Responses denied because of security concerns. For HTTP this is because of a matched http-request rule, or "option checkcache". | integer | counter |
| haproxy.stat.response.errors | Number of response errors. This value includes the number of data transfers aborted by the server (haproxy.stat.server.aborted). Some other errors are: * write errors on the client socket (won't be counted for the server stat) * failure applying filters to the response | long | counter |
| haproxy.stat.response.http.1xx | HTTP responses with 1xx code. | long | counter |
| haproxy.stat.response.http.2xx | HTTP responses with 2xx code. | long | counter |
| haproxy.stat.response.http.3xx | HTTP responses with 3xx code. | long | counter |
| haproxy.stat.response.http.4xx | HTTP responses with 4xx code. | long | counter |
| haproxy.stat.response.http.5xx | HTTP responses with 5xx code. | long | counter |
| haproxy.stat.response.http.other | HTTP responses with other codes (protocol error). | long | counter |
| haproxy.stat.response.time.avg | Average response time in ms over the last 1024 requests (0 for TCP). | long | gauge |
| haproxy.stat.selected.total | Total number of times a server was selected, either for new sessions, or when re-dispatching. For servers, this field reports the the number of times the server was selected. | long | counter |
| haproxy.stat.server.aborted | Number of data transfers aborted by the server. This value is included in haproxy.stat.response.errors. | integer | counter |
| haproxy.stat.server.active | Number of backend servers that are active, meaning that they are healthy and can receive requests from the load balancer. | integer | gauge |
| haproxy.stat.server.backup | Number of backend servers that are backup servers. | integer | gauge |
| haproxy.stat.server.id | Server ID (unique inside a proxy). | integer | |
| haproxy.stat.service_name | Service name (FRONTEND for frontend, BACKEND for backend, or any name for server/listener). | keyword | |
| haproxy.stat.session.current | Number of current sessions. | long | gauge |
| haproxy.stat.session.limit | Configured session limit. | long | gauge |
| haproxy.stat.session.max | Maximum number of sessions. | long | gauge |
| haproxy.stat.session.rate.limit | Configured limit on new sessions per second. | integer | gauge |
| haproxy.stat.session.rate.max | Maximum number of new sessions per second. | integer | gauge |
| haproxy.stat.session.rate.value | Number of sessions per second over the last elapsed second. | integer | gauge |
| haproxy.stat.session.total | Number of all sessions. | long | counter |
| haproxy.stat.source.address | Address of the source. | keyword | |
| haproxy.stat.status | Status (UP, DOWN, NOLB, MAINT, or MAINT(via)...). | keyword | |
| haproxy.stat.throttle.pct | Current throttle percentage for the server when slowstart is active, or no value if slowstart is inactive. | scaled_float | gauge |
| haproxy.stat.tracked.id | ID of the proxy/server if tracking is enabled. | long | |
| haproxy.stat.weight | Total weight (for backends), or server weight (for servers). | long | gauge |
| host.containerized | If the host is a container. | boolean | |
| host.name | Name of the host. It can contain what hostname returns on Unix systems, the fully qualified domain name, or a name specified by the user. The sender decides which value to use. |
keyword | |
| host.os.build | OS build information. | keyword | |
| host.os.codename | OS codename, if any. | keyword | |
| process.pid | Process id. | long | |
| service.address | Address where data about this service was collected from. This should be a URI, network address (ipv4:port or [ipv6]:port) or a resource path (sockets). | keyword |
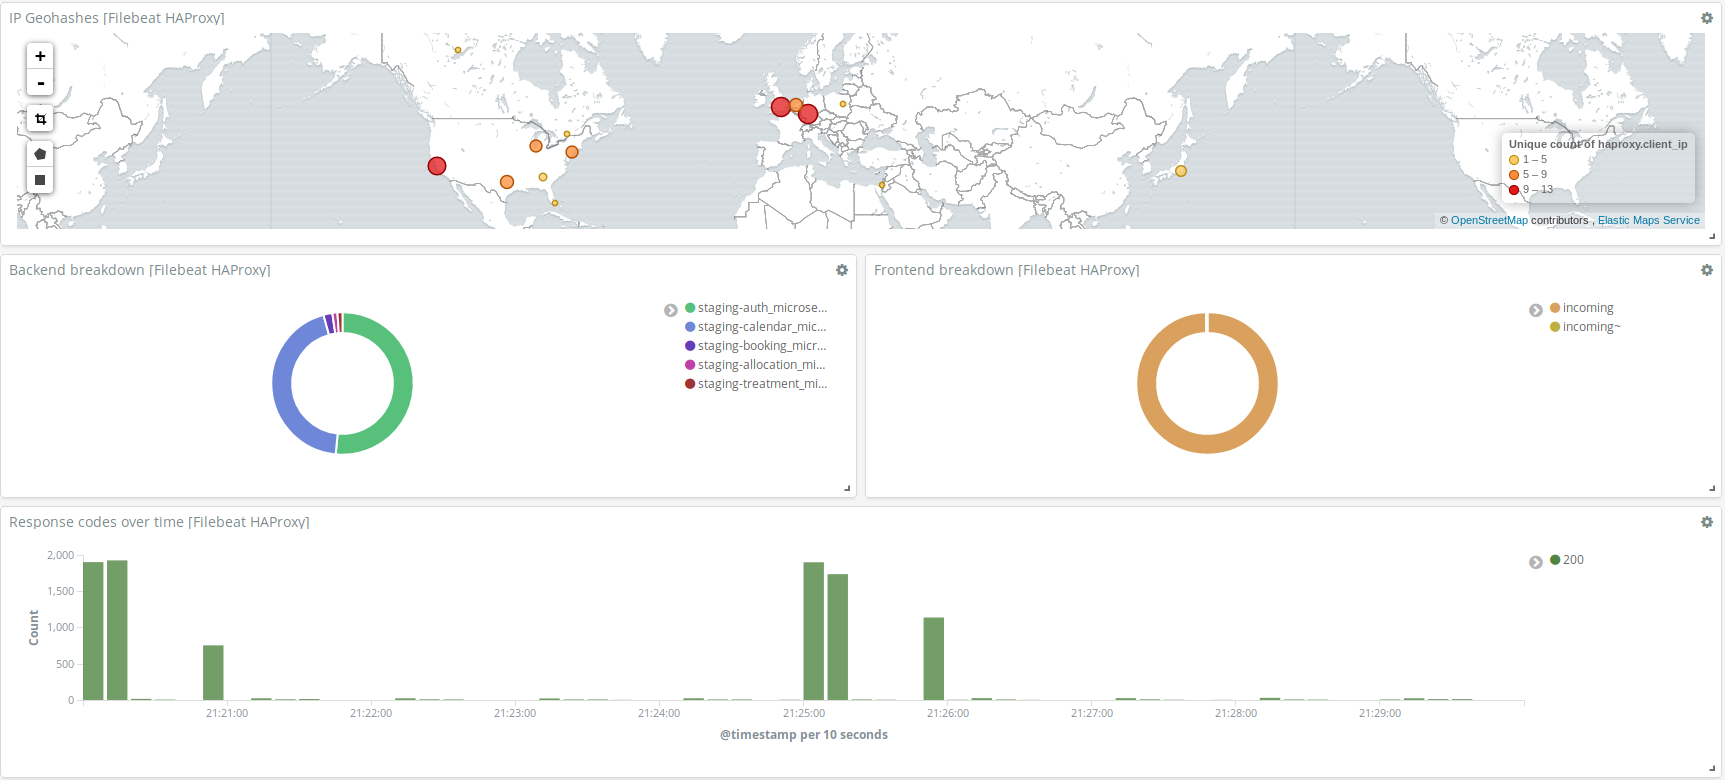
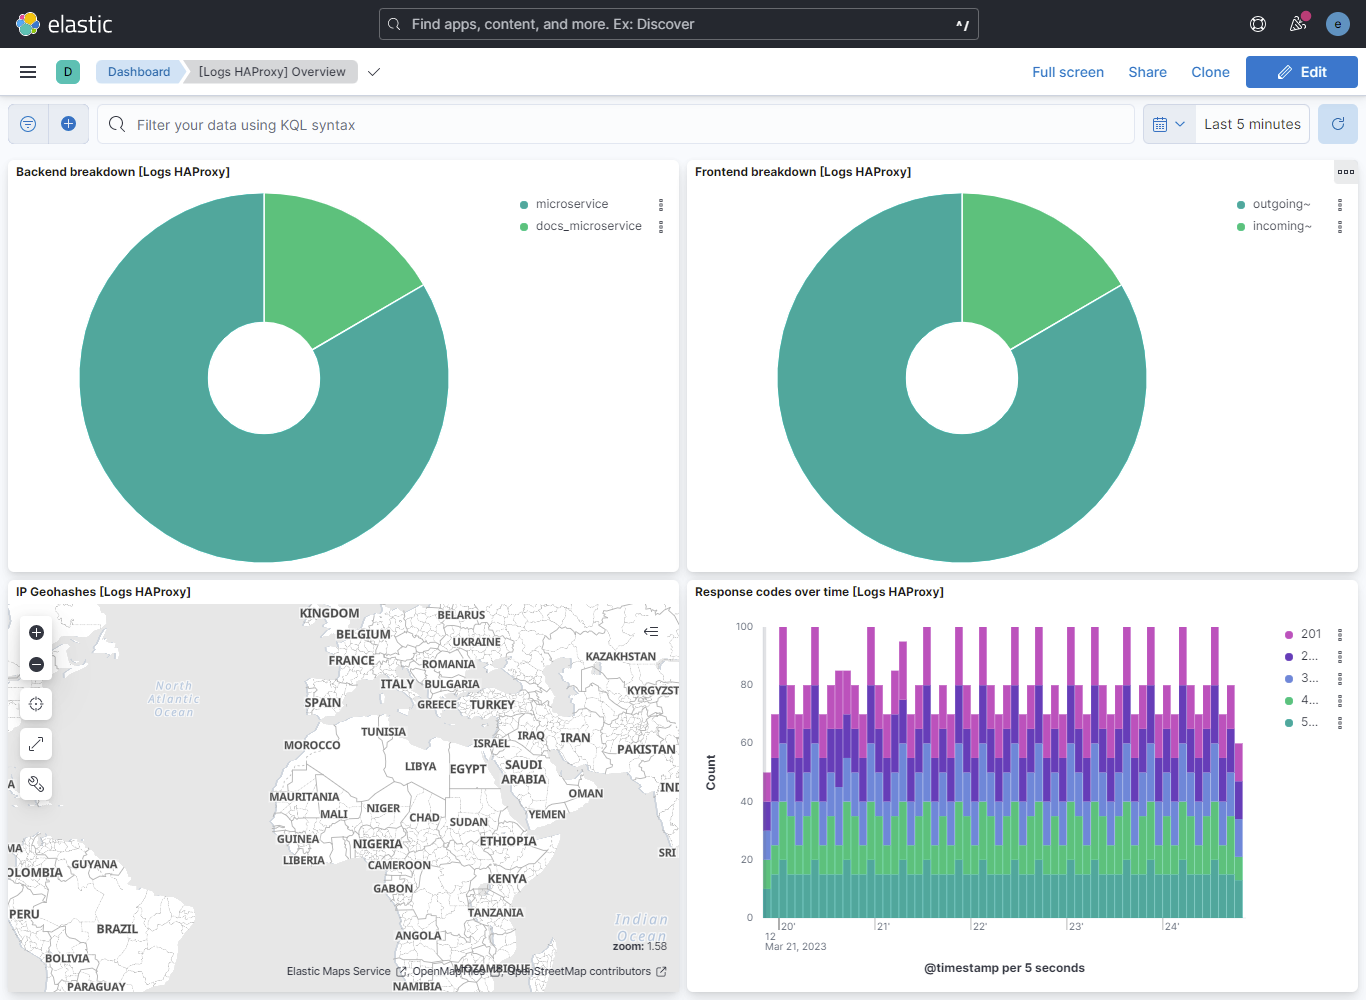
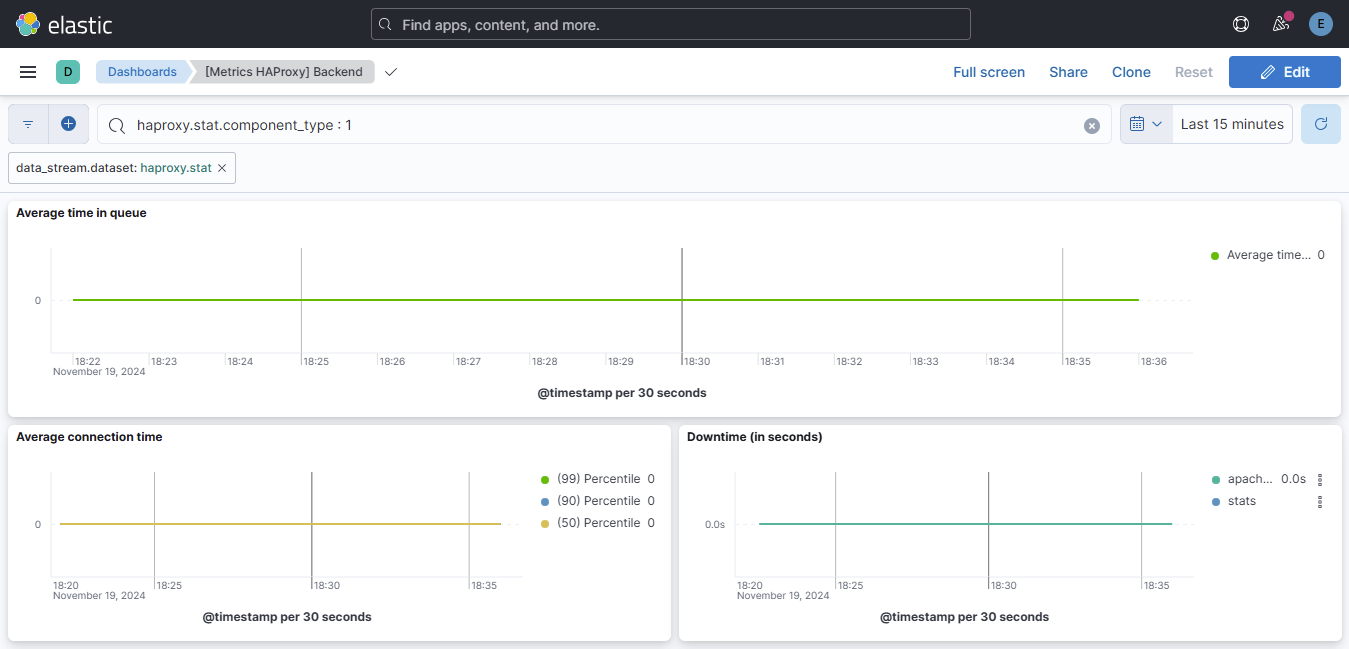
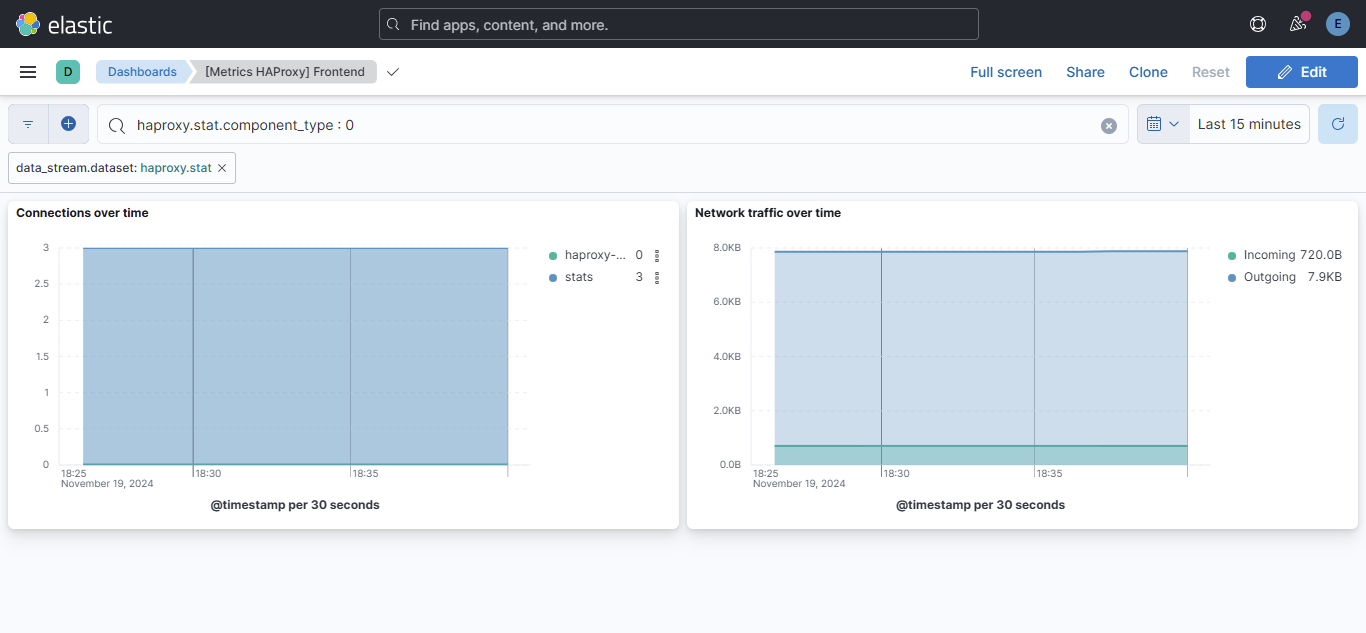
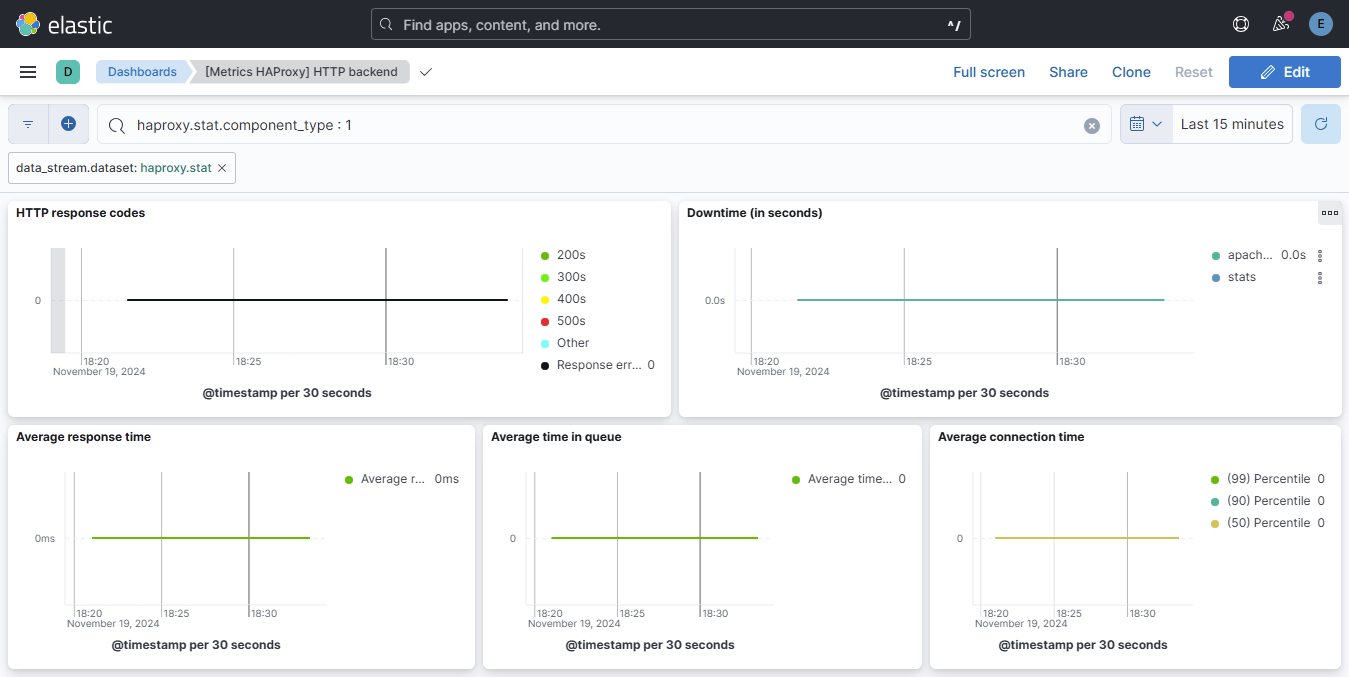
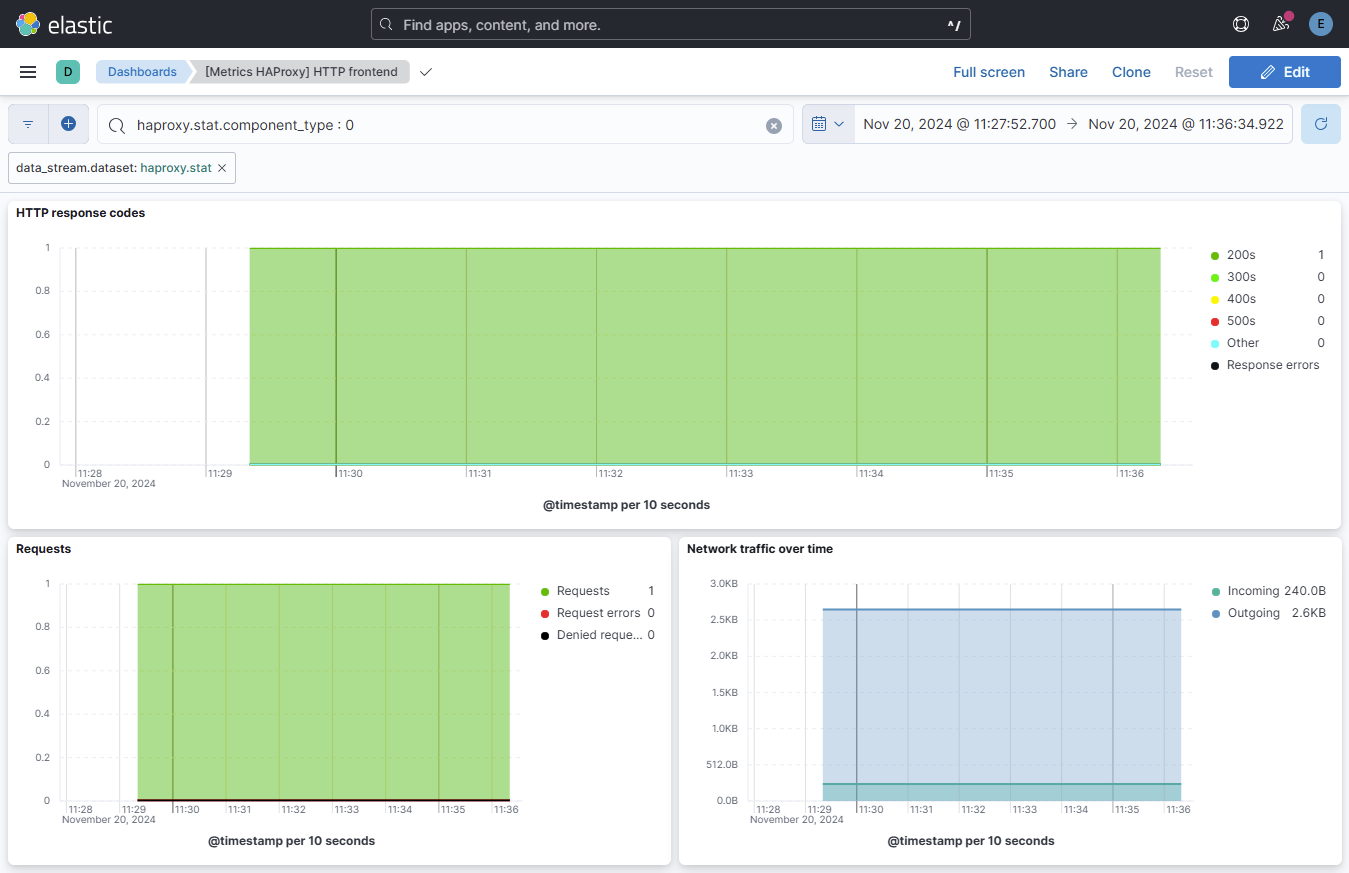
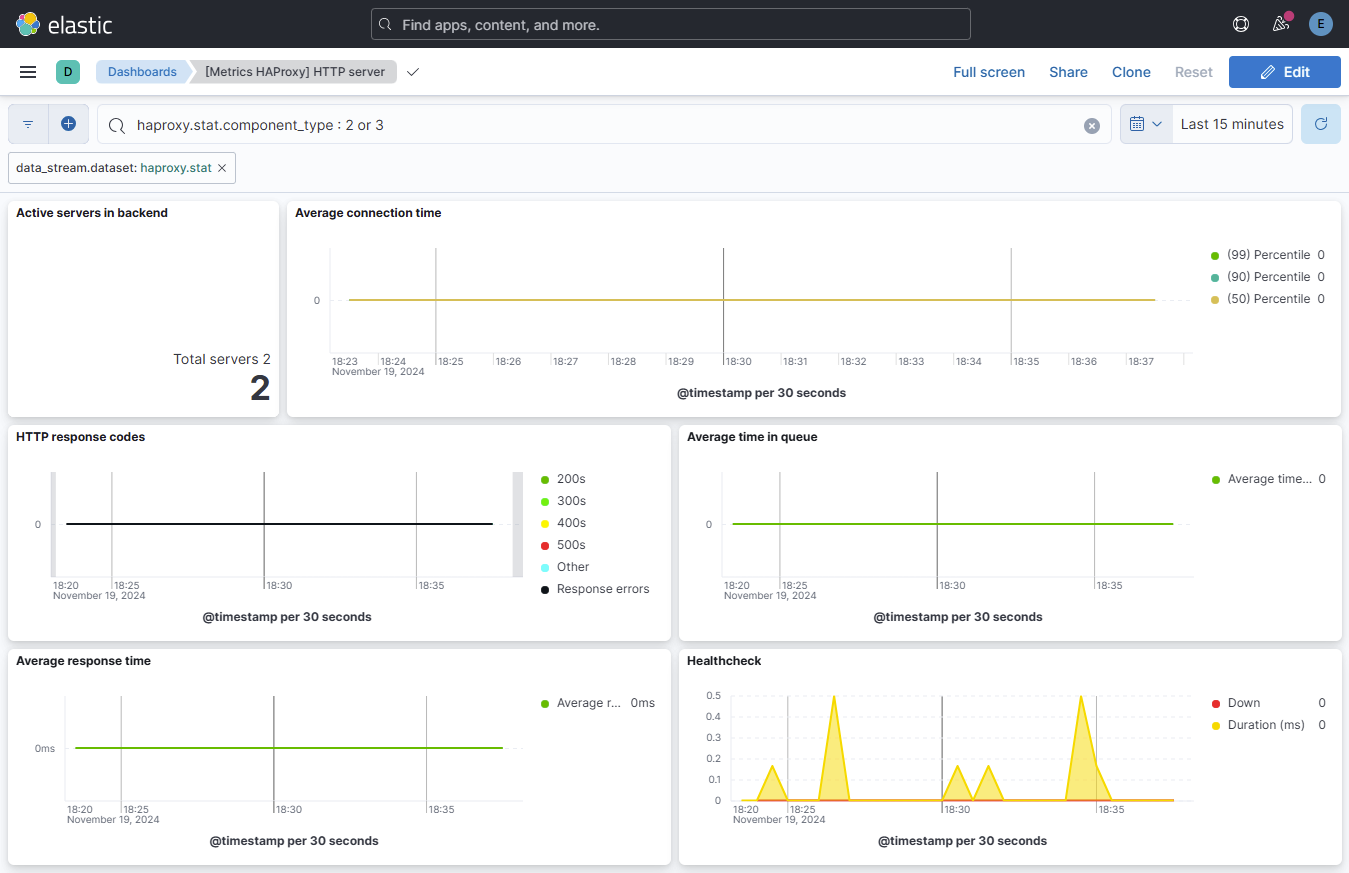
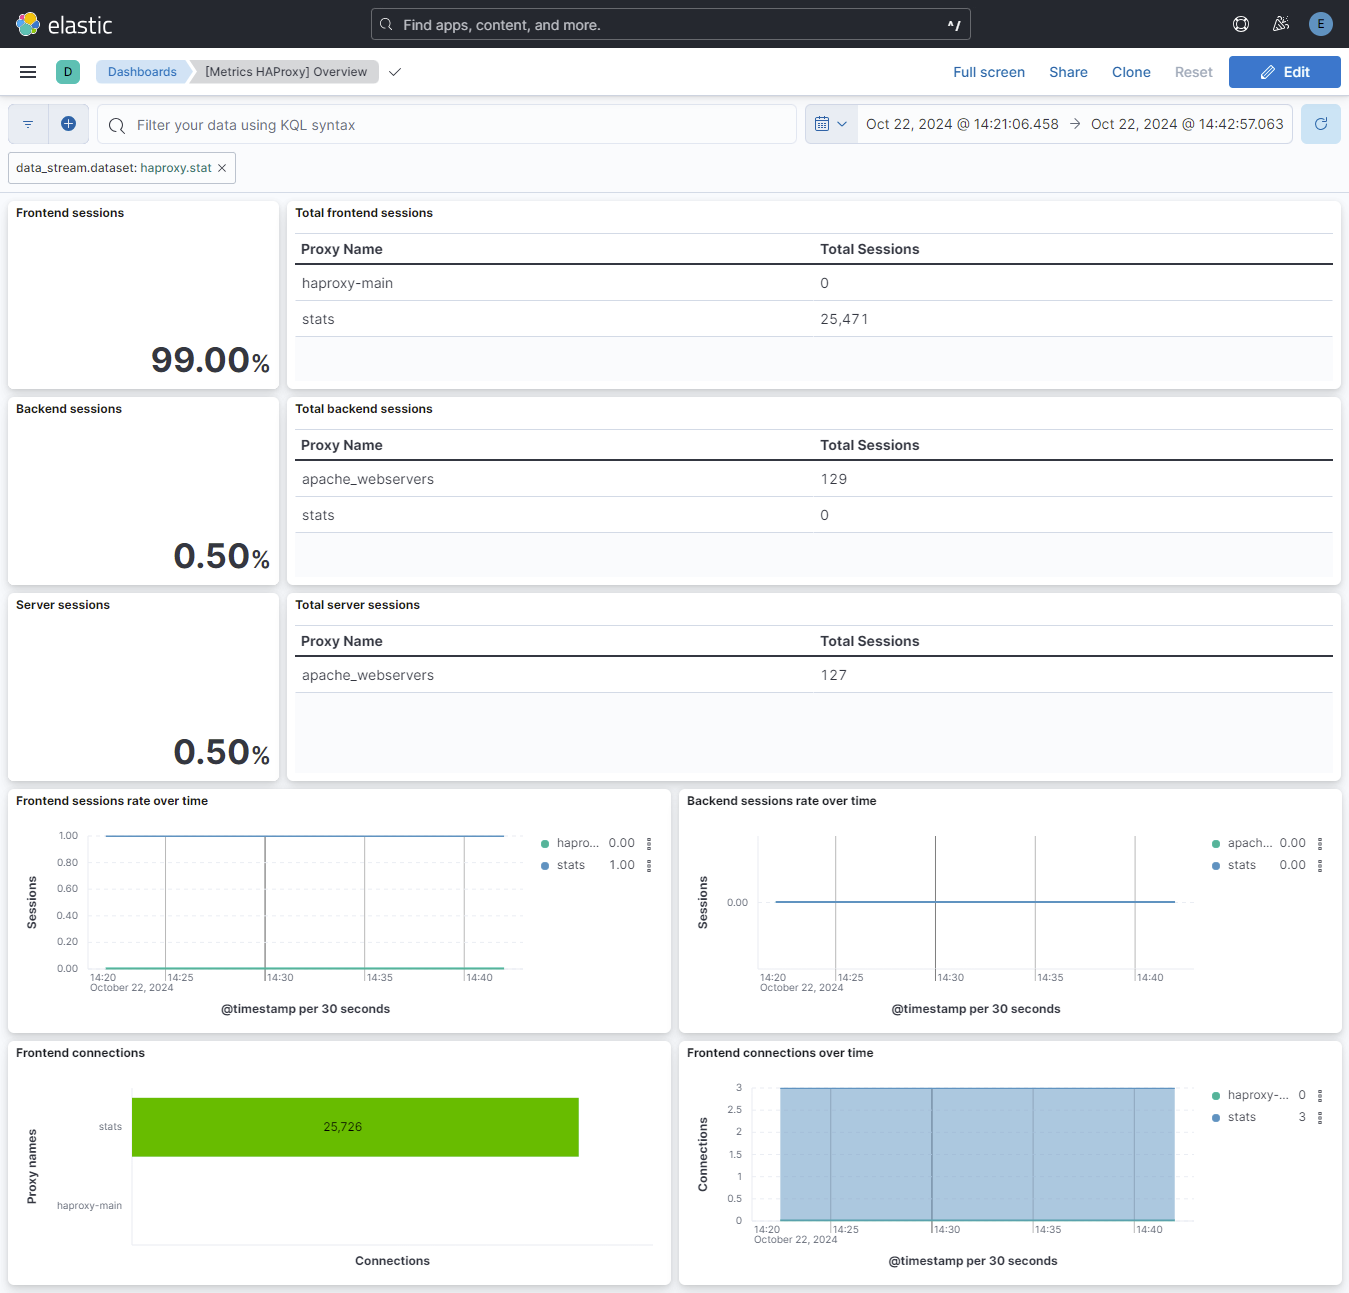
This integration includes one or more Kibana dashboards that visualizes the data collected by the integration. The screenshots below illustrate how the ingested data is displayed.
Changelog
| Version | Details | Minimum Kibana version |
|---|---|---|
| 1.17.2 | Bug fix (View pull request) Fix parsing of HAProxy logs containing <BADREQ> in the request line. |
9.0.0 8.13.0 |
| 1.17.1 | Bug fix (View pull request) Add missing information on the HAProxy Integration documentation. |
9.0.0 8.13.0 |
| 1.17.0 | Enhancement (View pull request) Allow @custom pipeline access to event.original without setting preserve_original_event. |
9.0.0 8.13.0 |
| 1.16.1 | Bug fix (View pull request) Update ingest pipeline for haproxy.http.request.raw_request_line to ignore Malformed URLs. |
9.0.0 8.13.0 |
| 1.16.0 | Enhancement (View pull request) Add support for Kibana 9.0.0. |
9.0.0 8.13.0 |
| 1.15.0 | Enhancement (View pull request) Allow the usage of deprecated log input and support for stack 9.0 |
8.13.0 |
| 1.14.1 | Bug fix (View pull request) Fix haproxy.stat.connection.total field and update visualizations. |
8.13.0 |
| 1.14.0 | Enhancement (View pull request) Add processor support for info and stat data streams. |
8.13.0 |
| 1.13.0 | Enhancement (View pull request) ECS version updated to 8.11.0. Update the kibana constraint to ^8.13.0. Modified the field definitions to remove ECS fields made redundant by the ecs@mappings component template. |
8.13.0 |
| 1.12.0 | Enhancement (View pull request) Enable secret for the password field and add dashboard-level filters. |
8.12.0 |
| 1.11.1 | Bug fix (View pull request) Update the link to the correct reindexing procedure. |
8.8.0 |
| 1.11.0 | Enhancement (View pull request) Migrate metrics dashboards visualizations to lens. |
8.8.0 |
| 1.10.1 | Bug fix (View pull request) Fix Grok pattern for parsing TCP Logs. |
8.8.0 |
| 1.10.0 | Enhancement (View pull request) Migrate log data-stream visualizations to lens. |
8.8.0 |
| 1.9.0 | Enhancement (View pull request) Enable time series data streams for the metrics datasets. This improves storage usage and query performance. For more details, see https://www.elastic.co/guide/en/elasticsearch/reference/current/tsds.html |
8.8.0 |
| 1.8.6 | Bug fix (View pull request) Correct the improper aggregation function used in dashboards. |
8.7.0 |
| 1.8.5 | Enhancement (View pull request) Add dimension mapping for the 'stat' datastream. |
8.0.0 |
| 1.8.4 | Bug fix (View pull request) Fix incorrect mapping of source.address field from text to keyword type. |
8.0.0 |
| 1.8.3 | Bug fix (View pull request) Add null check and ignore_missing check to the rename processor |
8.0.0 |
| 1.8.2 | Enhancement (View pull request) Add dimensions mapping for info datastream. |
8.0.0 |
| 1.8.1 | Enhancement (View pull request) Add metric_type mapping for the 'stat' datastream. |
8.0.0 |
| 1.8.0 | Enhancement (View pull request) Add metric_type mapping for info datastream. |
8.0.0 |
| 1.7.2 | Bug fix (View pull request) Add missing event.duration field mapping. |
8.0.0 |
| 1.7.1 | Enhancement (View pull request) Remove unecessary default from Timezone Offset |
8.0.0 |
| 1.7.0 | Enhancement (View pull request) Add possibility for overriding timezones in UI |
8.0.0 |
| 1.6.0 | Enhancement (View pull request) Rename ownership from obs-service-integrations to obs-infraobs-integrations |
8.0.0 |
| 1.5.1 | Enhancement (View pull request) Added categories and/or subcategories. |
8.0.0 |
| 1.5.0 | Enhancement (View pull request) Update ECS version to 8.5.1 |
8.0.0 |
| 1.4.0 | Enhancement (View pull request) Added infrastructure category. |
8.0.0 |
| 1.3.0 | Enhancement (View pull request) Add TLS fields, additional test data, update ECS to 8.4.0 |
8.0.0 |
| 1.2.1 | Enhancement (View pull request) Remove unused visualizations |
8.0.0 |
| 1.2.0 | Enhancement (View pull request) Migrate tile map to map object in dashboards |
8.0.0 |
| 1.1.1 | Enhancement (View pull request) Add documentation for multi-fields |
8.0.0 7.14.0 |
| 1.1.0 | Enhancement (View pull request) Update to ECS 8.0 |
8.0.0 7.14.0 |
| 1.0.2 | Bug fix (View pull request) Regenerate test files using the new GeoIP database |
8.0.0 7.14.0 |
| 1.0.1 | Bug fix (View pull request) Change test public IPs to the supported subset |
8.0.0 7.14.0 |
| 1.0.0 | Enhancement (View pull request) Release HAProxy as GA |
8.0.0 7.14.0 |
| 0.7.0 | Enhancement (View pull request) Release haproxy package for v8.0.0 |
— |
| 0.6.2 | Enhancement (View pull request) Uniform with guidelines |
— |
| 0.6.1 | Bug fix (View pull request) Fix logic that checks for the 'forwarded' tag |
— |
| 0.6.0 | Enhancement (View pull request) Update to ECS 1.12.0 |
— |
| 0.5.3 | Enhancement (View pull request) Convert to generated ECS fields |
— |
| 0.5.2 | Enhancement (View pull request) update to ECS 1.11.0 |
— |
| 0.5.1 | Enhancement (View pull request) Escape special characters in docs |
— |
| 0.5.0 | Enhancement (View pull request) Update integration description |
— |
| 0.4.0 | Enhancement (View pull request) Set "event.module" and "event.dataset" |
— |
| 0.3.0 | Enhancement (View pull request) update to ECS 1.10.0 and adding event.original option |
— |
| 0.2.8 | Enhancement (View pull request) update to ECS 1.9.0 |
— |
| 0.2.7 | Bug fix (View pull request) Correct sample event file. |
— |
| 0.1.0 | Enhancement (View pull request) initial release |
— |
