PHP-FPM Integration
| Version | 1.6.0 (View all) |
| Subscription level What's this? |
Basic |
| Developed by What's this? |
Elastic |
| Ingestion method(s) | API |
| Minimum Kibana version(s) | 9.0.0 8.13.0 |
PHP-FPM (FastCGI Process Manager) is a web tool used to speed up the performance of a website. It is much faster than traditional CGI based methods and has the ability to handle tremendous loads simultaneously.
Use the PHP-FPM integration to:
- Collect metrics related to the pool and process.
- Create visualizations to monitor, measure, and analyze usage trends and key data, deriving business insights.
- Create alerts to reduce the MTTD and MTTR by referencing relevant logs when troubleshooting an issue.
The PHP-FPM integration collects metrics data.
Metrics provide insight into the statistics of the PHP-FPM. The Metrics data streams collected by the PHP-FPM integration include pool and process so that the user can monitor and troubleshoot the performance of the PHP-FPM instances.
Data streams:
pool: Collects information related to the connection handling, queue metrics, process manager configuration, process activity and performance indicators.process: Collects information related to the request metrics, the latest CPU and memory usage and the current running state.
Note:
- Users can monitor and view the metrics inside the ingested documents for PHP-FPM in the
logs-*index pattern inDiscover.
This integration has been tested against v8.2 and v8.1 standalone versions of PHP-FPM.
You need Elasticsearch for storing and searching your data and Kibana for visualizing and managing it. You can use our hosted Elasticsearch Service on Elastic Cloud, which is recommended, or self-manage the Elastic Stack on your own hardware.
In order to ingest data from PHP-FPM, you must know the host(s) and status path of the PHP-FPM instance.
Host configuration format: http[s]://host[:port]
Example host configuration: http://localhost:8080
Status path configuration format: /path
Example Status path configuration: /status
For step-by-step instructions on how to set up an integration, see the Getting Started guide.
After successfully configuring the integration, click on the Assets tab of the PHP-FPM integration to display the available dashboards. Select the dashboard for your configured data stream, which should be populated with the required data.
If host.ip appears conflicted under the logs-* data view, this issue can be resolved by reindexing the indices of the Pool and Process data streams.
The pool data stream collects metrics related to the setup and contents of the FPM status page.
Example
{
    "@timestamp": "2023-07-28T10:10:15.918Z",
    "agent": {
        "ephemeral_id": "9581f949-002c-4a1f-8939-abae313a3e55",
        "id": "79efec86-f67c-4ca6-8a2e-a8900f9ae3ac",
        "name": "docker-fleet-agent",
        "type": "filebeat",
        "version": "8.7.1"
    },
    "data_stream": {
        "dataset": "php_fpm.pool",
        "namespace": "ep",
        "type": "logs"
    },
    "ecs": {
        "version": "8.11.0"
    },
    "elastic_agent": {
        "id": "79efec86-f67c-4ca6-8a2e-a8900f9ae3ac",
        "snapshot": false,
        "version": "8.7.1"
    },
    "event": {
        "agent_id_status": "verified",
        "category": [
            "web",
            "configuration",
            "process"
        ],
        "created": "2023-07-28T10:10:15.918Z",
        "dataset": "php_fpm.pool",
        "ingested": "2023-07-28T10:10:19Z",
        "kind": "event",
        "module": "php_fpm",
        "type": [
            "info"
        ]
    },
    "input": {
        "type": "httpjson"
    },
    "php_fpm": {
        "pool": {
            "connections": {
                "accepted": 1,
                "listen_queue": {
                    "max_size": 128,
                    "requests": {
                        "max": 0
                    }
                },
                "queued": 0
            },
            "name": "www",
            "process_manager": {
                "type": "ondemand"
            },
            "processes": {
                "active": {
                    "count": 1,
                    "max": 1
                },
                "children_reached": {
                    "max": 0
                },
                "count": 1,
                "idle": 0
            },
            "slow_requests": 0,
            "start_since": 17,
            "start_time": 1690538998
        }
    },
    "service": {
        "address": "http://elastic-package-service_php_fpm_1"
    },
    "tags": [
        "php_fpm-pool",
        "forwarded"
    ]
}
ECS Field Reference
Please refer to the following document for detailed information on ECS fields.
Exported fields
| Field | Description | Type | Unit | Metric Type |
|---|---|---|---|---|
| @timestamp | Event timestamp. | date | ||
| data_stream.dataset | Data stream dataset. | constant_keyword | ||
| data_stream.namespace | Data stream namespace. | constant_keyword | ||
| data_stream.type | Data stream type. | constant_keyword | ||
| input.type | Type of Filebeat input. | keyword | ||
| php_fpm.pool.connections.accepted | The total number of accepted connections. | long | counter | |
| php_fpm.pool.connections.listen_queue.max_size | The maximum allowed size of the listen queue. | long | gauge | |
| php_fpm.pool.connections.listen_queue.requests.max | The maximum number of requests seen in the listen queue at any one time. | long | gauge | |
| php_fpm.pool.connections.queued | The number of requests (backlog) currently waiting for a free process. | long | gauge | |
| php_fpm.pool.name | The name of the FPM process pool. | keyword | ||
| php_fpm.pool.process_manager.type | The process manager type - static, dynamic or ondemand. | keyword | ||
| php_fpm.pool.processes.active.count | The number of processes that are currently processing requests. | long | gauge | |
| php_fpm.pool.processes.active.max | The maximum number of concurrently active processes. | long | gauge | |
| php_fpm.pool.processes.children_reached.max | Has the maximum number of processes ever been reached? If so the displayed value is 1 otherwise the value is 0. | long | gauge | |
| php_fpm.pool.processes.count | The current total number of processes. | long | gauge | |
| php_fpm.pool.processes.idle | The number of processes that are currently idle (waiting for requests). | long | gauge | |
| php_fpm.pool.slow_requests | The total number of requests that have hit the configured request_slowlog_timeout. | long | counter | |
| php_fpm.pool.start_since | The time in seconds since the process pool was last started. | long | s | counter |
| php_fpm.pool.start_time | The date/time that the process pool was last started. | long |
The process data stream collects metrics related to the request duration, content length, process state, etc.
Example
{
    "@timestamp": "2023-07-28T10:11:12.080Z",
    "agent": {
        "ephemeral_id": "0f5589f7-327f-468e-b368-00ada3a96721",
        "id": "79efec86-f67c-4ca6-8a2e-a8900f9ae3ac",
        "name": "docker-fleet-agent",
        "type": "filebeat",
        "version": "8.7.1"
    },
    "data_stream": {
        "dataset": "php_fpm.process",
        "namespace": "ep",
        "type": "logs"
    },
    "ecs": {
        "version": "8.11.0"
    },
    "elastic_agent": {
        "id": "79efec86-f67c-4ca6-8a2e-a8900f9ae3ac",
        "snapshot": false,
        "version": "8.7.1"
    },
    "event": {
        "agent_id_status": "verified",
        "category": [
            "web",
            "configuration",
            "process"
        ],
        "created": "2023-07-28T10:11:12.080Z",
        "dataset": "php_fpm.process",
        "ingested": "2023-07-28T10:11:15Z",
        "kind": "event",
        "module": "php_fpm",
        "type": [
            "info"
        ]
    },
    "http": {
        "request": {
            "body": {
                "bytes": 0
            },
            "method": "GET"
        }
    },
    "input": {
        "type": "httpjson"
    },
    "php_fpm": {
        "process": {
            "pool": {
                "name": "www"
            },
            "request": {
                "count": 1,
                "duration": 581,
                "last": {
                    "cpu": {
                        "pct": 0
                    },
                    "memory": 0
                }
            },
            "script": "-",
            "start_since": 0,
            "start_time": 1690539072,
            "state": "Running"
        }
    },
    "process": {
        "pid": 33
    },
    "service": {
        "address": "http://elastic-package-service_php_fpm_1"
    },
    "tags": [
        "php_fpm-process",
        "forwarded"
    ],
    "url": {
        "original": "/status?json&full"
    },
    "user": {
        "name": "-"
    }
}
ECS Field Reference
Please refer to the following document for detailed information on ECS fields.
Exported fields
| Field | Description | Type | Unit | Metric Type |
|---|---|---|---|---|
| @timestamp | Event timestamp. | date | ||
| data_stream.dataset | Data stream dataset. | constant_keyword | ||
| data_stream.namespace | Data stream namespace. | constant_keyword | ||
| data_stream.type | Data stream type. | constant_keyword | ||
| input.type | Type of Filebeat input. | keyword | ||
| php_fpm.process.pool.name | The name of the FPM process pool. | keyword | ||
| php_fpm.process.request.count | The total number of requests served. | long | counter | |
| php_fpm.process.request.duration | The duration in microseconds of the requests. | long | micros | gauge |
| php_fpm.process.request.last.cpu.pct | The %cpu of the last request. This will be 0 if the process is not Idle because the calculation is done when the request processing is complete. | long | percent | gauge |
| php_fpm.process.request.last.memory | The maximum amount of memory consumed by the last request. This will be 0 if the process is not Idle because the calculation is done when the request processing is complete. | long | byte | gauge |
| php_fpm.process.script | The full path of the script executed by the last request. This will be '-' if not applicable (eg. status page requests). | keyword | ||
| php_fpm.process.start_since | The number of seconds since the process started. | long | s | counter |
| php_fpm.process.start_time | The date/time at which the process started. | long | ||
| php_fpm.process.state | The state of the process. | keyword |
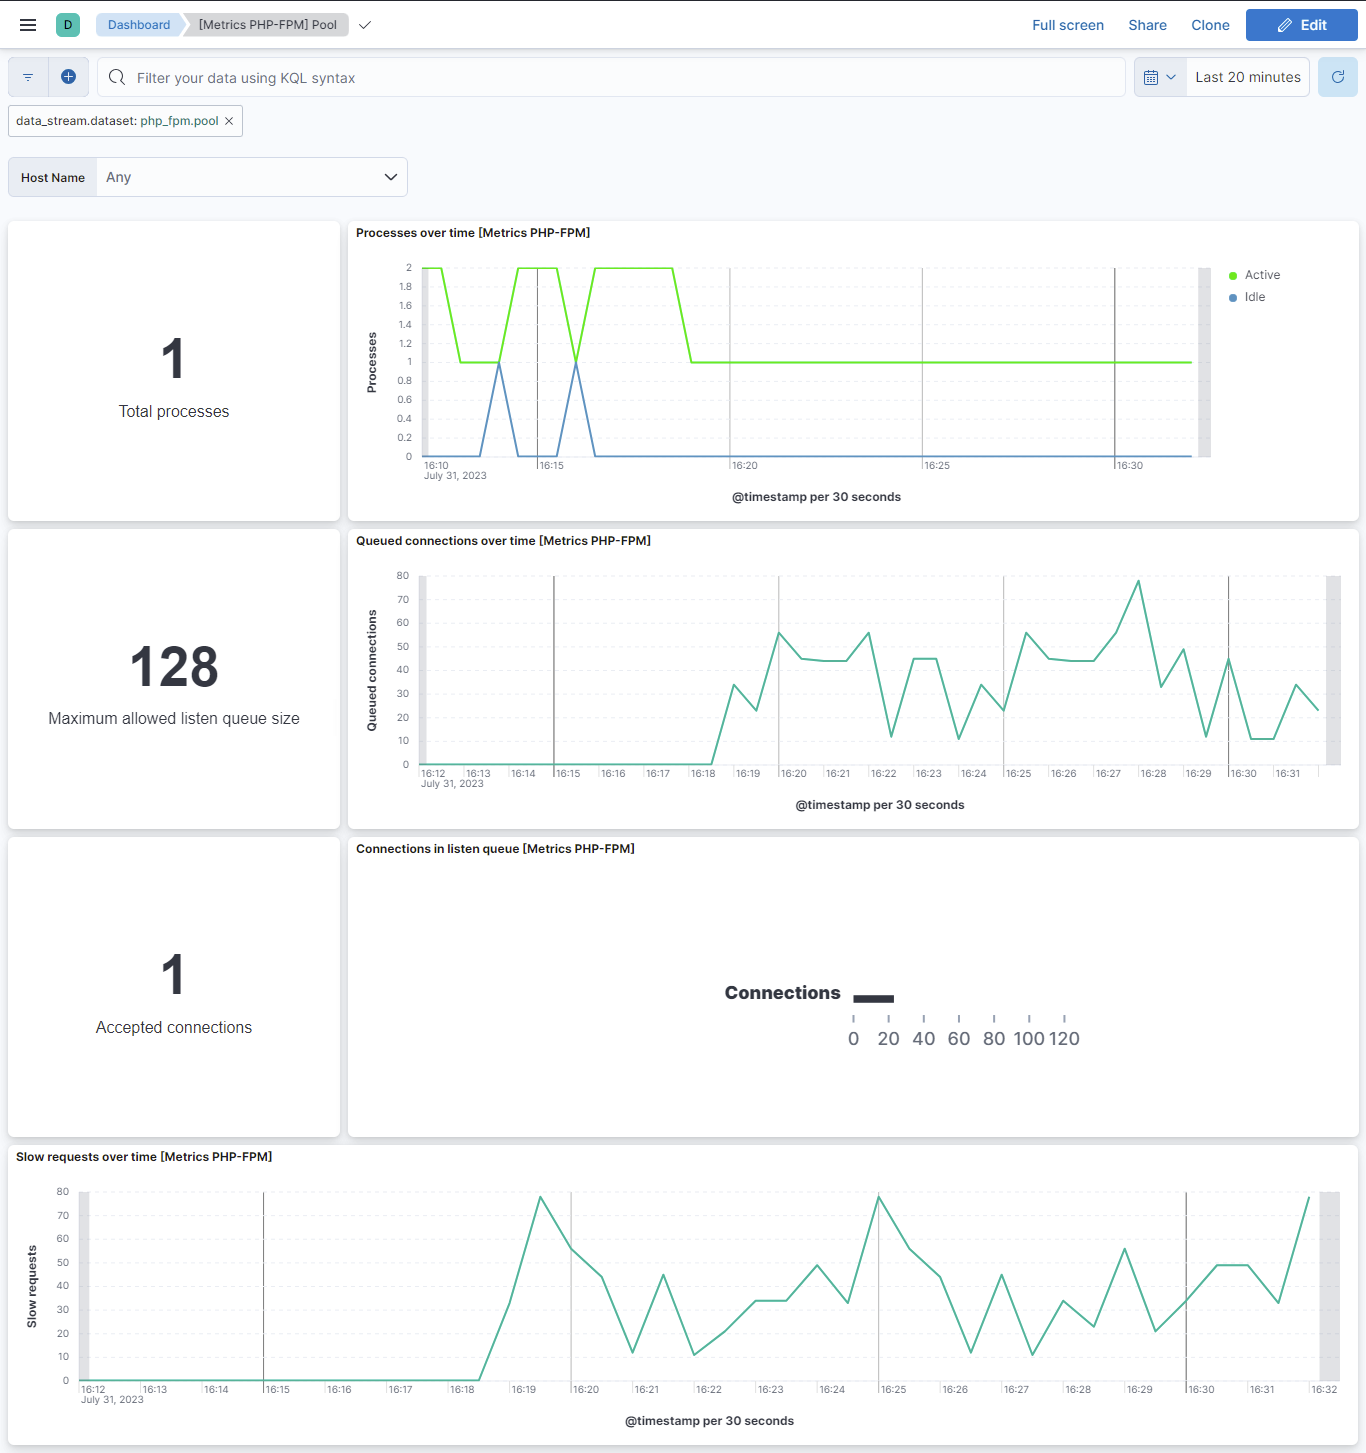
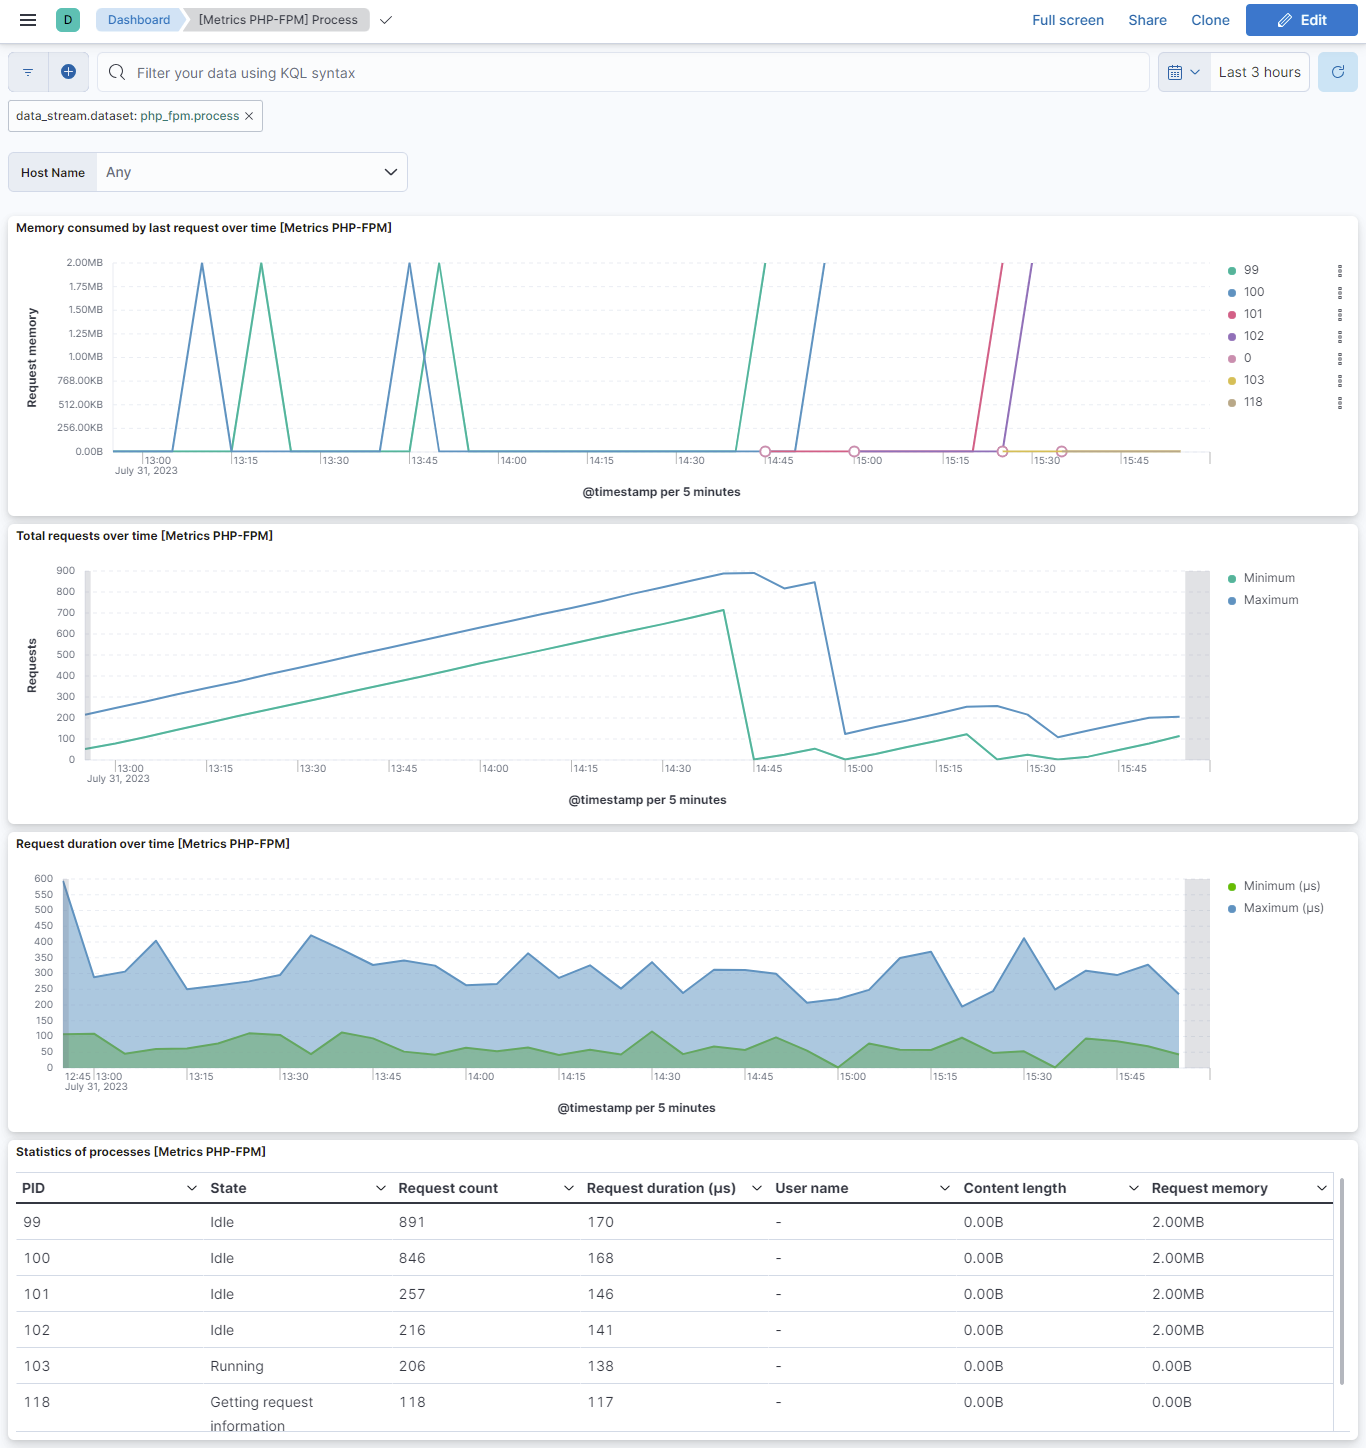
This integration includes one or more Kibana dashboards that visualizes the data collected by the integration. The screenshots below illustrate how the ingested data is displayed.
Changelog
| Version | Details | Minimum Kibana version |
|---|---|---|
| 1.6.0 | Enhancement (View pull request) Allow @custom pipeline access to event.original without setting preserve_original_event. |
9.0.0 8.13.0 |
| 1.5.1 | Bug fix (View pull request) Added description to ssl nodes including links to documentation. |
9.0.0 8.13.0 |
| 1.5.0 | Enhancement (View pull request) Add support for Kibana 9.0.0. |
9.0.0 8.13.0 |
| 1.4.1 | Bug fix (View pull request) Update links to getting started docs |
8.13.0 |
| 1.4.0 | Enhancement (View pull request) ECS version updated to 8.11.0. Update the kibana constraint to ^8.13.0. Modified the field definitions to remove ECS fields made redundant by the ecs@mappings component template. |
8.13.0 |
| 1.3.0 | Enhancement (View pull request) Add global filter on data_stream.dataset to improve performance. |
8.7.1 |
| 1.2.1 | Enhancement (View pull request) Update README to follow documentation guidelines. |
8.7.1 |
| 1.2.0 | Enhancement (View pull request) Limit request tracer log count to five. |
8.7.1 |
| 1.1.0 | Enhancement (View pull request) Update the package format_version to 3.0.0. |
8.7.1 |
| 1.0.0 | Enhancement (View pull request) Make PHP-FPM GA. |
8.7.1 |
| 0.6.2 | Bug fix (View pull request) Add null check and ignore_missing check to the rename processor |
— |
| 0.6.1 | Enhancement (View pull request) Add metric_type for pool and process data streams. |
— |
| 0.6.0 | Enhancement (View pull request) Add service.address field and update dashboard. |
— |
| 0.5.1 | Bug fix (View pull request) Resolve the conflict in host.ip field |
— |
| 0.5.0 | Enhancement (View pull request) Rename ownership from obs-service-integrations to obs-infraobs-integrations |
— |
| 0.4.0 | Enhancement (View pull request) Add a new flag to enable request tracing |
— |
| 0.3.0 | Enhancement (View pull request) Migrate visualizations to lens. |
— |
| 0.2.2 | Enhancement (View pull request) Added categories and/or subcategories. |
— |
| 0.2.1 | Bug fix (View pull request) PHP-FPM Process data stream update field description |
— |
| 0.2.0 | Enhancement (View pull request) PHP-FPM integration package with "Process" data stream. |
— |
| 0.1.0 | Enhancement (View pull request) PHP-FPM integration package with "Pool" data stream. |
— |

