Alerts
In general, a rule consists of three parts:
- Conditions: what needs to be detected?
- Schedule: when/how often should detection checks run?
- Actions: what happens when a condition is detected?
For example, when monitoring a set of servers, a rule might:
- Check for average CPU usage > 0.9 on each server for the last two minutes (condition).
- Check every minute (schedule).
- Send a warning email message via SMTP with subject
CPU on {{server}} is high(action).
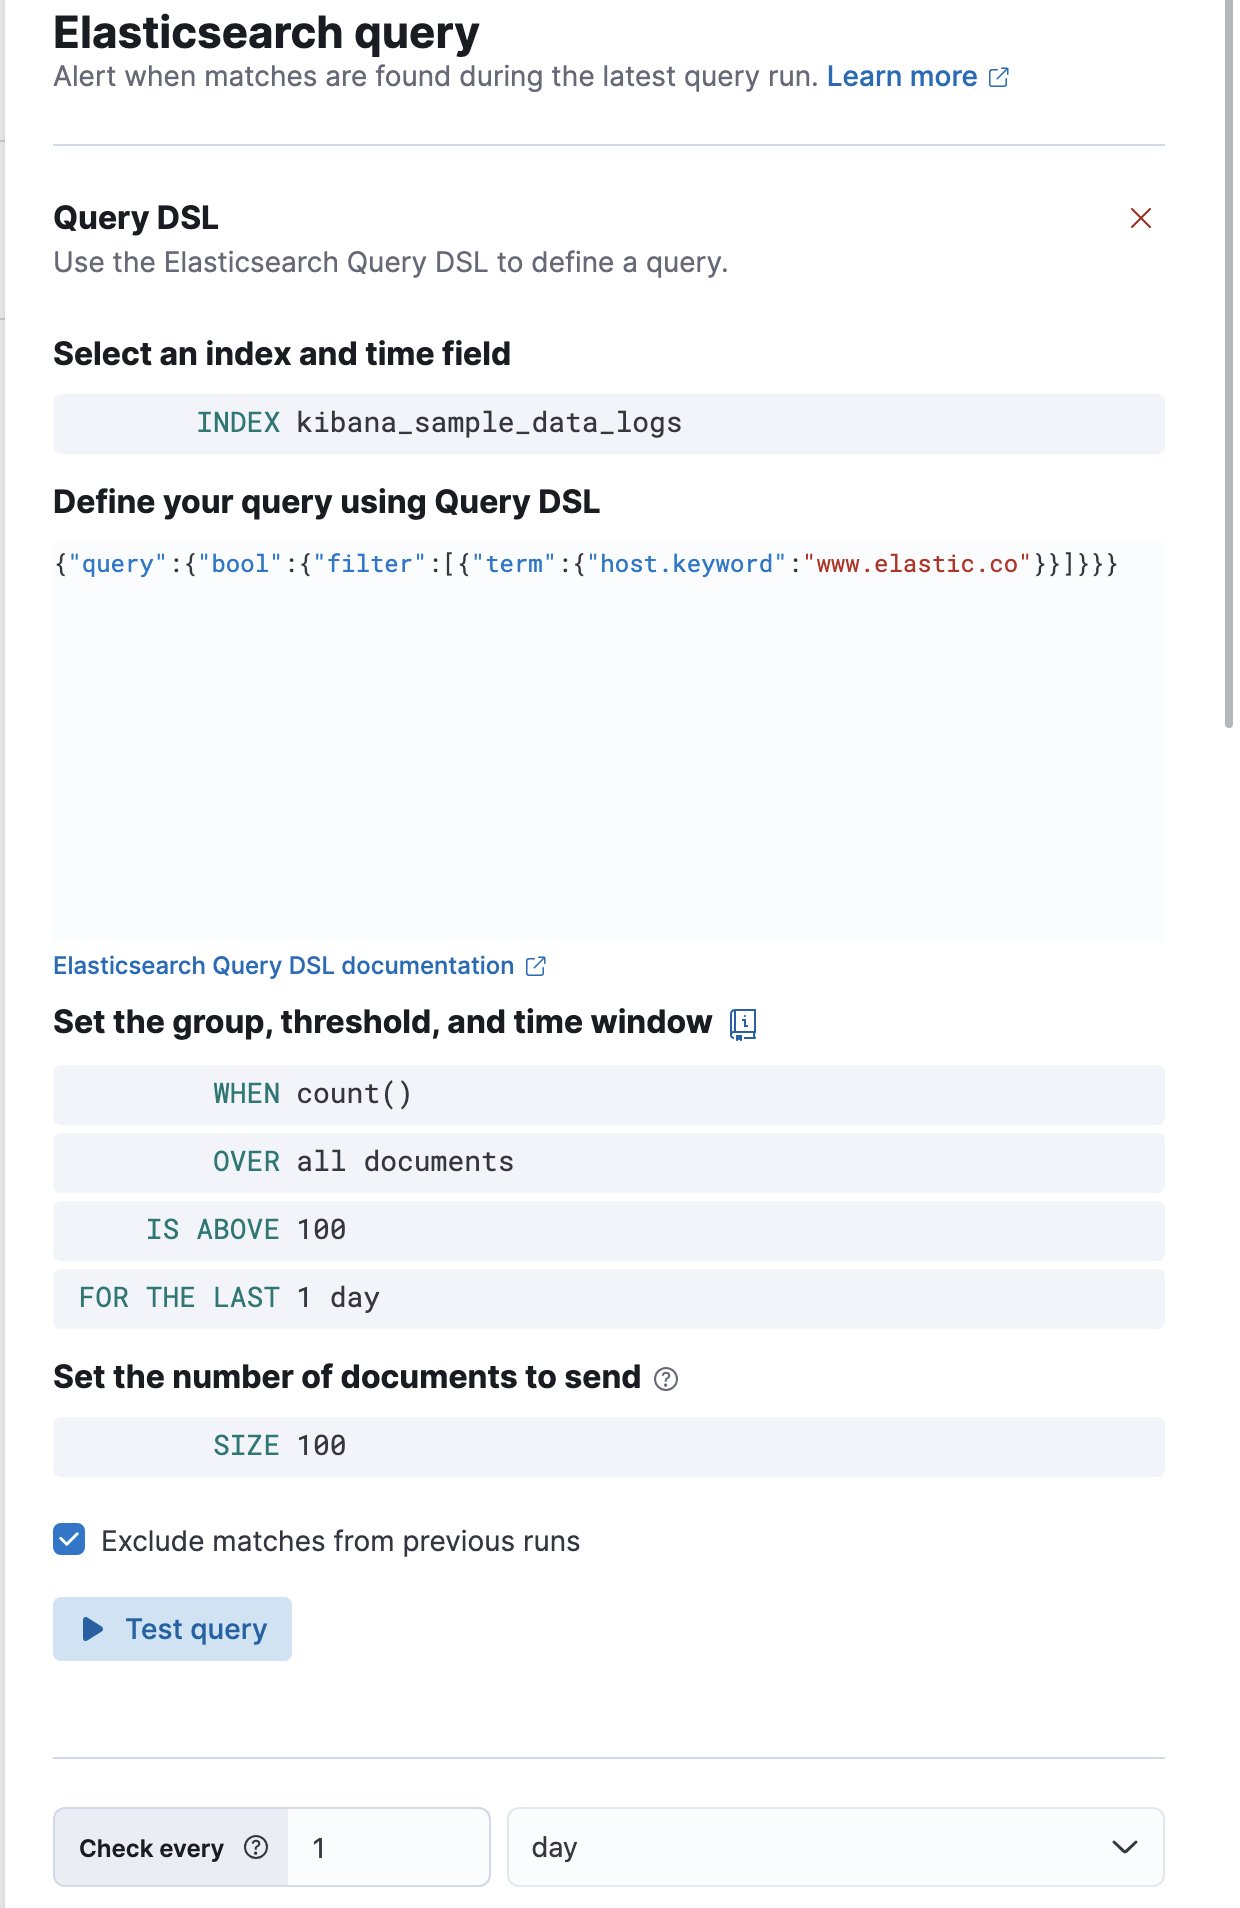
Each project type supports a specific set of rule types. Each rule type provides its own way of defining the conditions to detect, but an expression formed by a series of clauses is a common pattern. For example, in an Elasticsearch query rule, you specify an index, a query, and a threshold, which uses a metric aggregation operation (count, average, max, min, or sum):

All rules must have a check interval, which defines how often to evaluate the rule conditions. Checks are queued; they run as close to the defined value as capacity allows.
The intervals of rule checks in Kibana are approximate. Their timing is affected by factors such as the frequency at which tasks are claimed and the task load on the system. Refer to Alerting production considerations
You can add one or more actions to your rule to generate notifications when its conditions are met. Recovery actions likewise run when rule conditions are no longer met.
When defining actions in a rule, you specify:
- A connector
- An action frequency
- A mapping of rule values to properties exposed for that type of action
Each action uses a connector, which provides connection information for a Kibana service or third party integration, depending on where you want to send the notifications. The specific list of connectors that you can use in your rule vary by project type. Refer to Connectors.
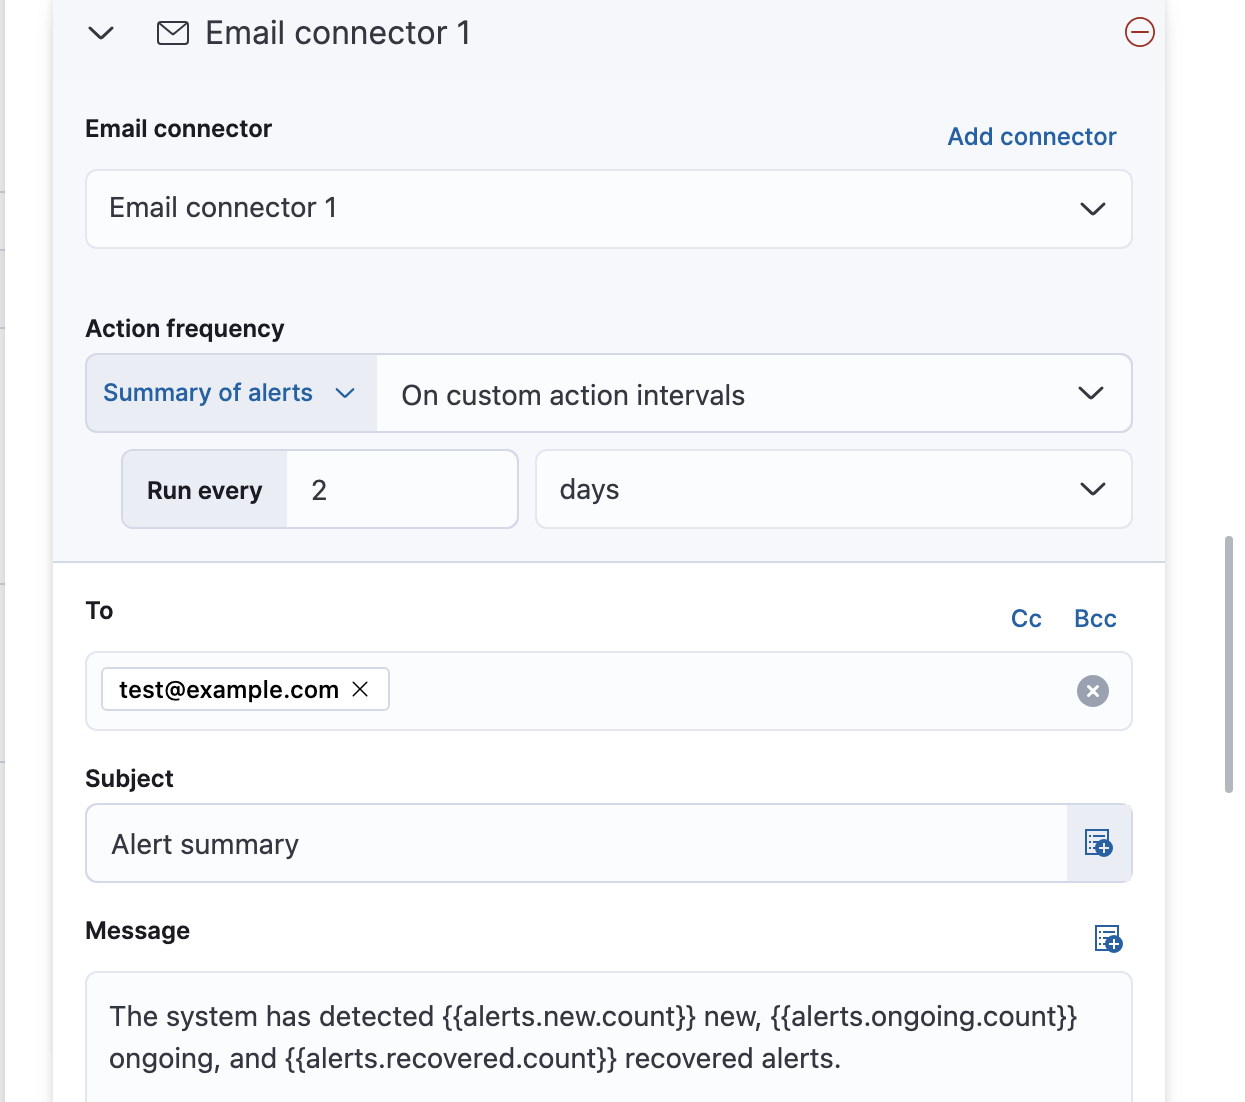
After you select a connector, set the action frequency. If you want to reduce the number of notifications you receive without affecting their timeliness, some rule types support alert summaries. For example, if you create an Elasticsearch query rule, you can set the action frequency such that you receive summaries of the new, ongoing, and recovered alerts on a custom interval:

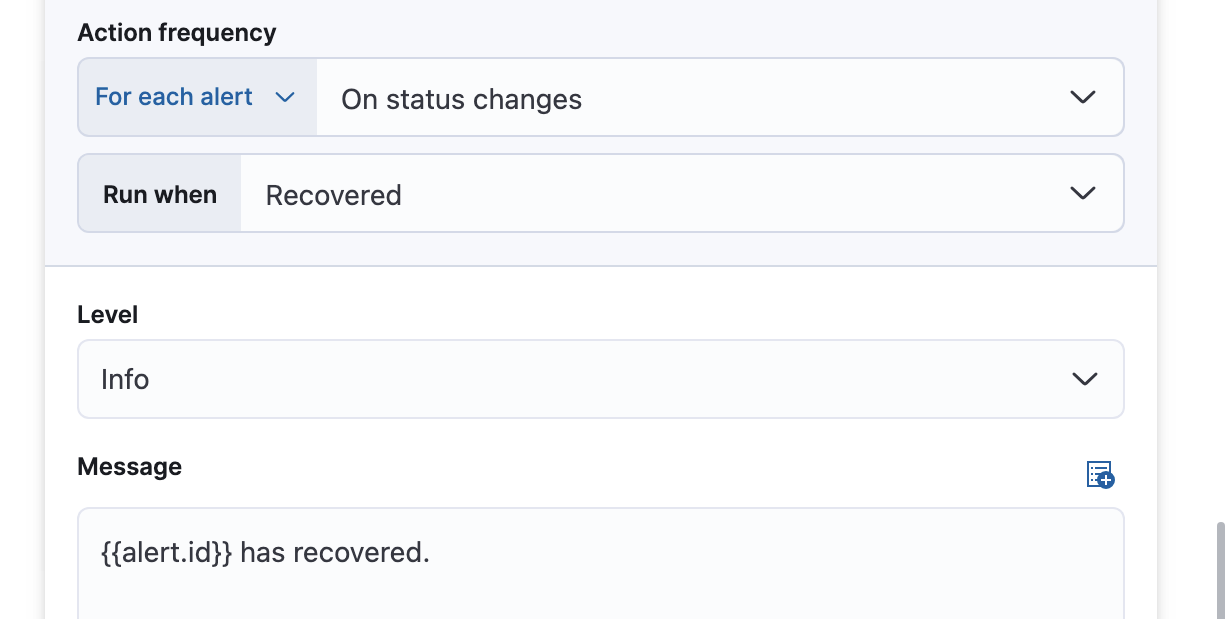
Alternatively, you can set the action frequency such that the action runs for each alert. If the rule type does not support alert summaries, this is your only available option. You must choose when the action runs (for example, at each check interval, only when the alert status changes, or at a custom action interval). You must also choose an action group, which affects whether the action runs. Each rule type has a specific set of valid action groups. For example, you can set Run when to Query matched or Recovered for the Elasticsearch query rule:

Each connector supports a specific set of actions for each action group and enables different action properties. For example, you can have actions that create an Opsgenie alert when rule conditions are met and recovery actions that close the Opsgenie alert.
Some types of rules enable you to further refine the conditions under which actions run. For example, you can specify that actions run only when an alert occurs within a specific time frame or when it matches a KQL query.
If you are not using alert summaries, actions are triggered per alert and a rule can end up generating a large number of actions. Take the following example where a rule is monitoring three servers every minute for CPU usage > 0.9, and the action frequency is On check intervals:
- Minute 1: server X123 > 0.9. One email is sent for server X123.
- Minute 2: X123 and Y456 > 0.9. Two emails are sent, one for X123 and one for Y456.
- Minute 3: X123, Y456, Z789 > 0.9. Three emails are sent, one for each of X123, Y456, Z789.
In this example, three emails are sent for server X123 in the span of 3 minutes for the same rule. Often, it’s desirable to suppress these re-notifications. If you set the action frequency to On custom action intervals with an interval of 5 minutes, you reduce noise by getting emails only every 5 minutes for servers that continue to exceed the threshold:
- Minute 1: server X123 > 0.9. One email will be sent for server X123.
- Minute 2: X123 and Y456 > 0.9. One email will be sent for Y456.
- Minute 3: X123, Y456, Z789 > 0.9. One email will be sent for Z789.
To get notified only once when a server exceeds the threshold, you can set the action frequency to On status changes. Alternatively, if the rule type supports alert summaries, consider using them to reduce the volume of notifications.
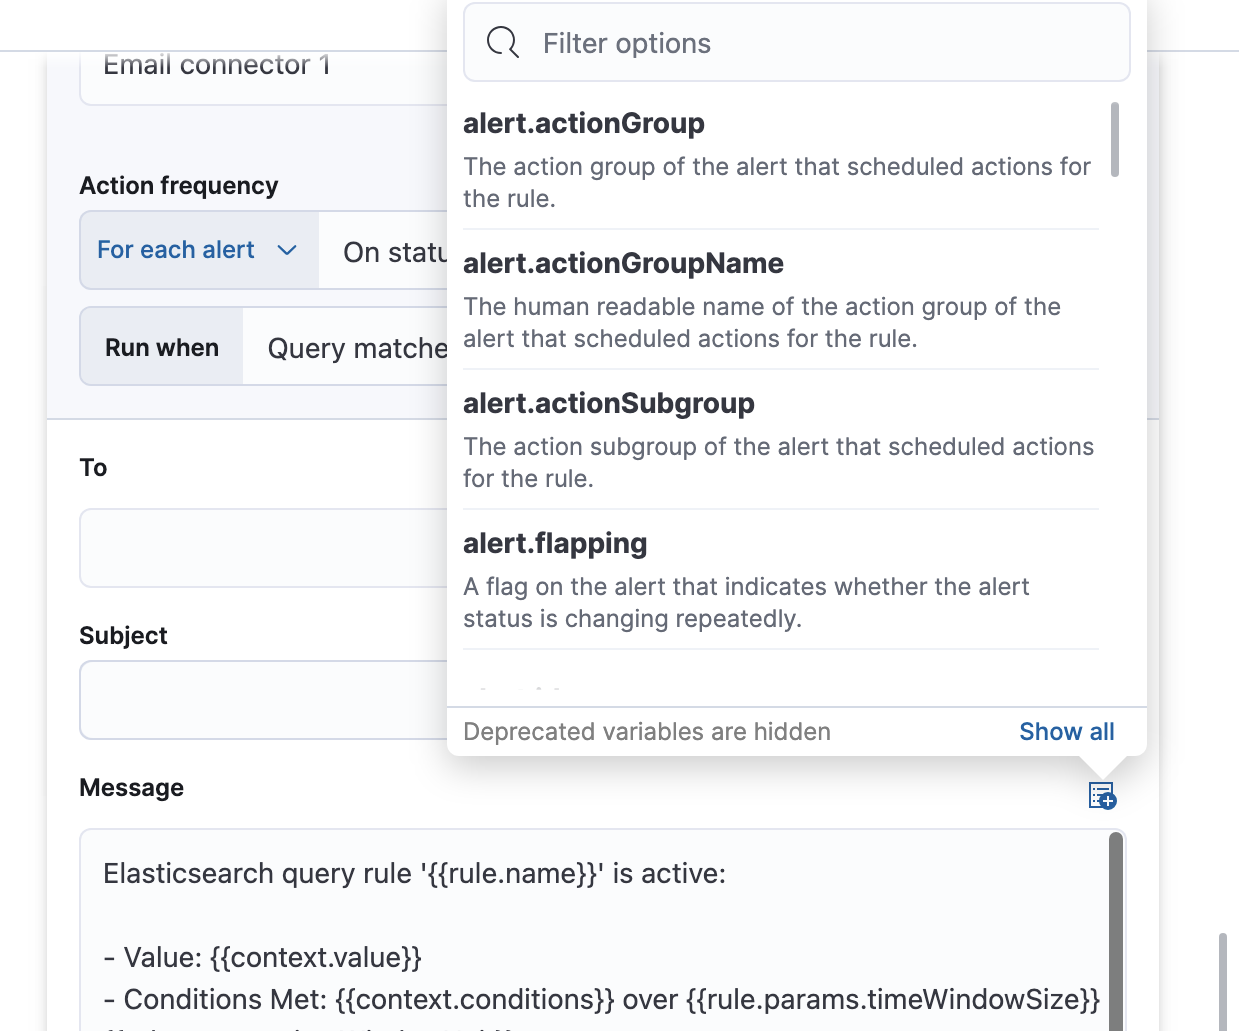
You can pass rule values to an action at the time a condition is detected. To view the list of variables available for your rule, click the "add rule variable" button:

For more information about common action variables, refer to Rule actions variables
When checking for a condition, a rule might identify multiple occurrences of the condition. Kibana tracks each of these alerts separately. Depending on the action frequency, an action occurs per alert or at the specified alert summary interval.
Using the server monitoring example, each server with average CPU > 0.9 is tracked as an alert. This means a separate email is sent for each server that exceeds the threshold whenever the alert status changes.
A rule consists of conditions, actions, and a schedule. When conditions are met, alerts are created that render actions and invoke them. To make action setup and update easier, actions use connectors that centralize the information used to connect with Kibana services and third-party integrations. The following example ties these concepts together:

- Any time a rule’s conditions are met, an alert is created. This example checks for servers with average CPU > 0.9. Three servers meet the condition, so three alerts are created.
- Alerts create actions according to the action frequency, as long as they are not muted or throttled. When actions are created, its properties are filled with actual values. In this example, three actions are created when the threshold is met, and the template string
{{server}}is replaced with the appropriate server name for each alert. - Kibana runs the actions, sending notifications by using a third party integration like an email service.
- If the third party integration has connection parameters or credentials, Kibana fetches these from the appropriate connector.