Visual event analyzer
Elastic Security allows any event detected by Elastic Endpoint or supported third-party integrations to be analyzed using a process-based visual analyzer, which shows a graphical timeline of processes that led up to the alert and the events that occurred immediately after. Examining events in the visual event analyzer is useful to determine the origin of potentially malicious activity and other areas in your environment that may be compromised. It also enables security analysts to drill down into all related hosts, processes, and other events to aid in their investigations.
If you’re experiencing performance degradation, you can exclude cold and frozen tier data from analyzer queries. This setting is only available for the Elastic Stack.
You can visualize events from the following sources:
- Elastic Defend integration
- Sysmon data collected through Winlogbeat
- Third-party integrations:
- CrowdStrike (Falcon logs collected through Event Stream or FDR)
- SentinelOne Cloud Funnel
-
Microsoft Defender for Endpoint
In KQL, this translates to any event with the agent.type set to:
endpointwinlogbeatwithevent.moduleset tosysmonfilebeatwithevent.moduleset tocrowdstrikefilebeatwithevent.moduleset tosentinel_one_cloud_funnel-
filebeatwithevent.moduleset tomicrosoft_defender_endpoint
event.kind: "alert" events from third-party integrations. To view these events, your role must have read privileges for the alerts-security.alerts-* indices.
To find events that can be visually analyzed:
First, display a list of events by doing one of the following:
- Find Hosts in the main menu, or search for
Security/Explore/Hostsby using the global search field, then select the Events tab. A list of all your hosts' events appears at the bottom of the page. - Find Alerts in the main menu or by using the global search field, then scroll down to the Alerts table.
- Find Hosts in the main menu, or search for
Filter events that can be visually analyzed by entering one of the following queries in the KQL search bar, then selecting Enter:
agent.type:"endpoint" and process.entity_id :*agent.type:"winlogbeat" and event.module: "sysmon" and process.entity_id : *agent.type:"filebeat" and event.module: "crowdstrike" and process.entity_id : *agent.type:"filebeat" and event.module: "sentinel_one_cloud_funnel" and process.entity_id : *-
agent.type:"filebeat" and event.module: "microsoft_defender_endpoint" and process.entity_id : *
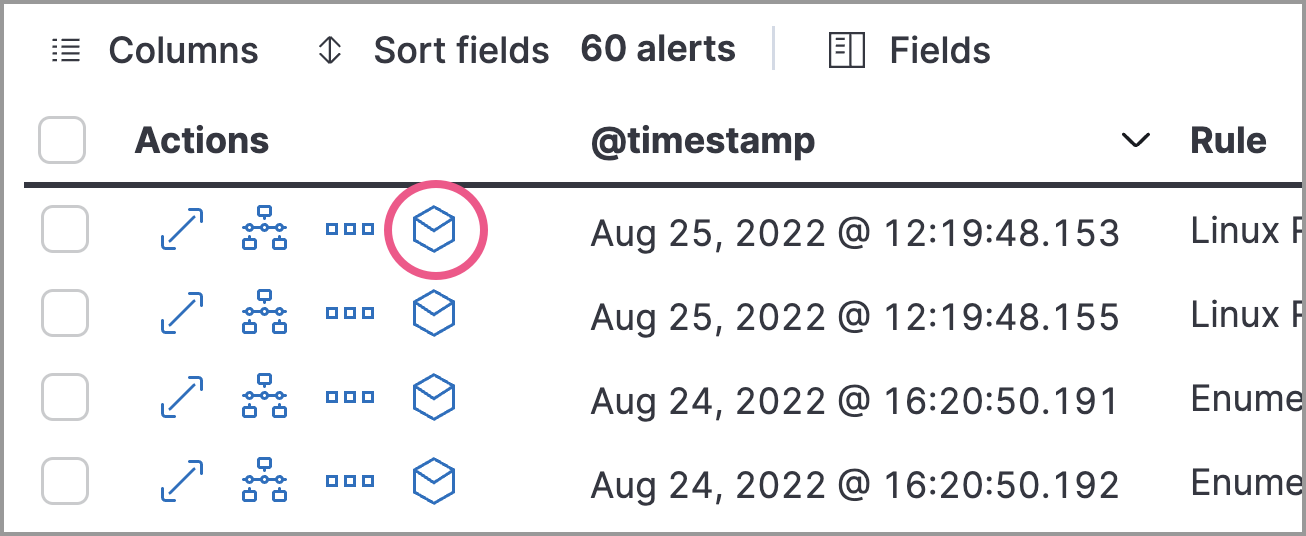
NoteTo specifically filter for alert-kind events from third-party integrations, add event.kind:"alert". For example:agent.type:"filebeat" and event.module:"microsoft_defender_endpoint" and event.kind:"alert" and process.entity_id:*Events that can be visually analyzed are denoted by a cubical Analyze event icon. Select this option to open the event in the visual analyzer. The event analyzer is accessible from the Hosts, Alerts, and Timelines pages, as well as the alert details flyout.
NoteEvents that cannot be analyzed will not have the Analyze event option available. This might occur if the event has incompatible field mappings.
 Tip
TipYou can also analyze events from Timelines.
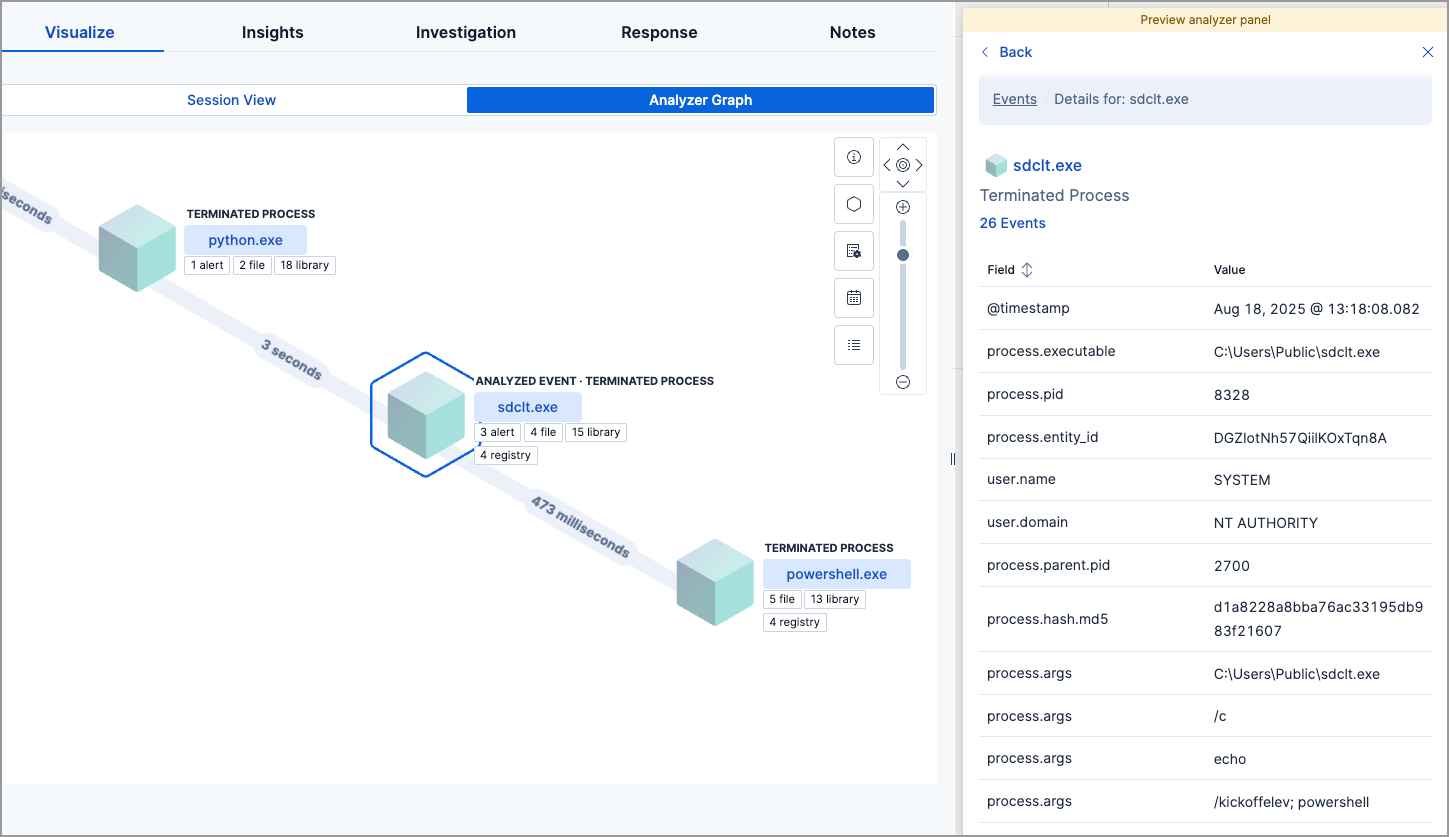
Within the visual analyzer, each cube represents a process, such as an executable file or network event. In the analyzer, you can:
- Zoom in and out of the Analyzer Graph view using the slider
- Click and drag around the Analyzer Graph view to explore the hierarchy of all process relationships
- Observe child process events that spawned from the parent process
- Determine how much time passed between each process
- Identify all events related to each process
Use the following icons to perform more actions:
To understand what fields were used to create the process, select the Process Tree icon ( ) to show the schema that created the Analyzer Graph view. The fields included are:
SOURCE: Indicates the data source—for example,endpointorwinlogbeatID: Event field that uniquely identifies a nodeEDGE: Event field that indicates the relationship between two nodes
Click the Legend icon ( ) to show the state of each process node.
Select a different data view ( ) to further filter the alert’s related events.
Use the time filter ( ) to analyze the event within a specific time range. By default, the selected time range matches that of the table from which you opened the alert.
Click the list icon ( ) to open the preview analyzer panel. This displays a list of all processes related to the event, starting with the event chain’s first process. The Analyzed Event—the event you selected to analyze from the events list or Timeline—is highlighted with a light blue outline around the cube.

To learn more about each related process, select the process in the preview analyzer panel or the Analyzer Graph view. The preview analyzer panel then displays process details such as:
- The number of events associated with the process
- The timestamp of when the process was executed
- The file path of the process within the host
- The
process-pid - The user name and domain that ran the process
- Any other relevant process information
- Any associated alerts

When you first select a process, it appears in a loading state. If loading data for a given process fails, click Reload {{process-name}} beneath the process to reload the data.
Access event details by selecting that event’s URL at the top of the process details view or choosing one of the event pills in the Analyzer Graph view. Events are categorized based on the event.category value.
When you select an event.category pill (for example, x file or x registry), all the events within that category are listed in the preview analyzer panel. To display more details about a specific event, select it from the list.
- You must have the appropriate Elastic Stack subscription or Serverless project feature tier to examine alerts associated with events.
- There is no limit to the number of events that can be associated with a process.
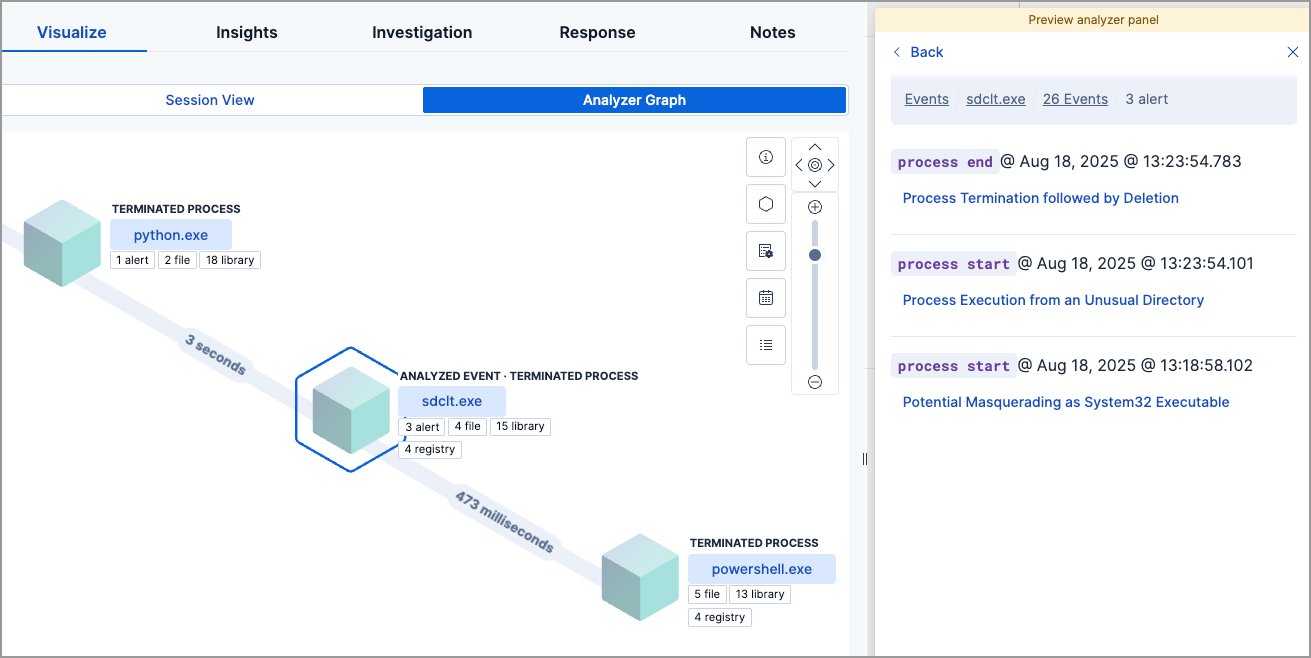
To examine alerts associated with the event, select the alert pill (x alert). The preview analyzer panel lists the total number of associated alerts, ordered from oldest to newest. Each alert shows the type of event that produced it (event.category), the event timestamp (@timestamp), and rule that generated the alert (kibana.alert.rule.name). Click on the rule name to open the alert’s details.
In the example screenshot, the analyzed event (sdclt.exe) generated three alerts. The preview analyzer panel displays basic information about each one.
