- Metricbeat Reference: other versions:
- Overview
- Contributing to Beats
- Getting started with Metricbeat
- Setting up and running Metricbeat
- Upgrading Metricbeat
- How Metricbeat works
- Configuring Metricbeat
- Specify which modules to run
- Specify general settings
- Load external configuration files
- Configure the internal queue
- Configure the output
- Specify SSL settings
- Filter and enhance the exported data
- Parse logs by using ingest node
- Set up project paths
- Set up the Kibana endpoint
- Load the Kibana dashboards
- Load the Elasticsearch index template
- Set up logging
- Use environment variables in the configuration
- YAML tips and gotchas
- Regular expression support
- metricbeat.reference.yml
- Modules
- Aerospike module
- Apache module
- Ceph module
- Couchbase module
- Docker module
- Dropwizard module
- Elasticsearch module
- Golang module
- HAProxy module
- HTTP module
- Jolokia module
- Kafka module
- Kibana module
- Kubernetes module
- Kubernetes container metricset
- Kubernetes event metricset
- Kubernetes node metricset
- Kubernetes pod metricset
- Kubernetes state_container metricset
- Kubernetes state_deployment metricset
- Kubernetes state_node metricset
- Kubernetes state_pod metricset
- Kubernetes state_replicaset metricset
- Kubernetes system metricset
- Kubernetes volume metricset
- Memcached module
- MongoDB module
- MySQL module
- Nginx module
- PHP-FPM module
- PostgreSQL Module
- Prometheus module
- RabbitMQ module
- Redis module
- System module
- vSphere module
- Windows module
- ZooKeeper module
- Exported Fields
- Aerospike Fields
- Apache Fields
- Beat Fields
- Ceph Fields
- Cloud Provider Metadata Fields
- Common Fields
- Couchbase Fields
- docker Fields
- Docker Fields
- Dropwizard Fields
- Elasticsearch Fields
- Golang Fields
- HAProxy Fields
- HTTP Fields
- Jolokia Fields
- Kafka Fields
- Kibana Fields
- kubernetes Fields
- Kubernetes Fields
- Memcached Fields
- MongoDB Fields
- MySQL Fields
- Nginx Fields
- PHP-FPM Fields
- PostgreSQL Fields
- Prometheus Fields
- RabbitMQ Fields
- Redis Fields
- System Fields
- vSphere Fields
- Windows Fields
- ZooKeeper Fields
- Securing Metricbeat
- Troubleshooting
WARNING: Version 6.0 of Metricbeat has passed its EOL date.
This documentation is no longer being maintained and may be removed. If you are running this version, we strongly advise you to upgrade. For the latest information, see the current release documentation.
Step 6: View the sample Kibana dashboards
editStep 6: View the sample Kibana dashboards
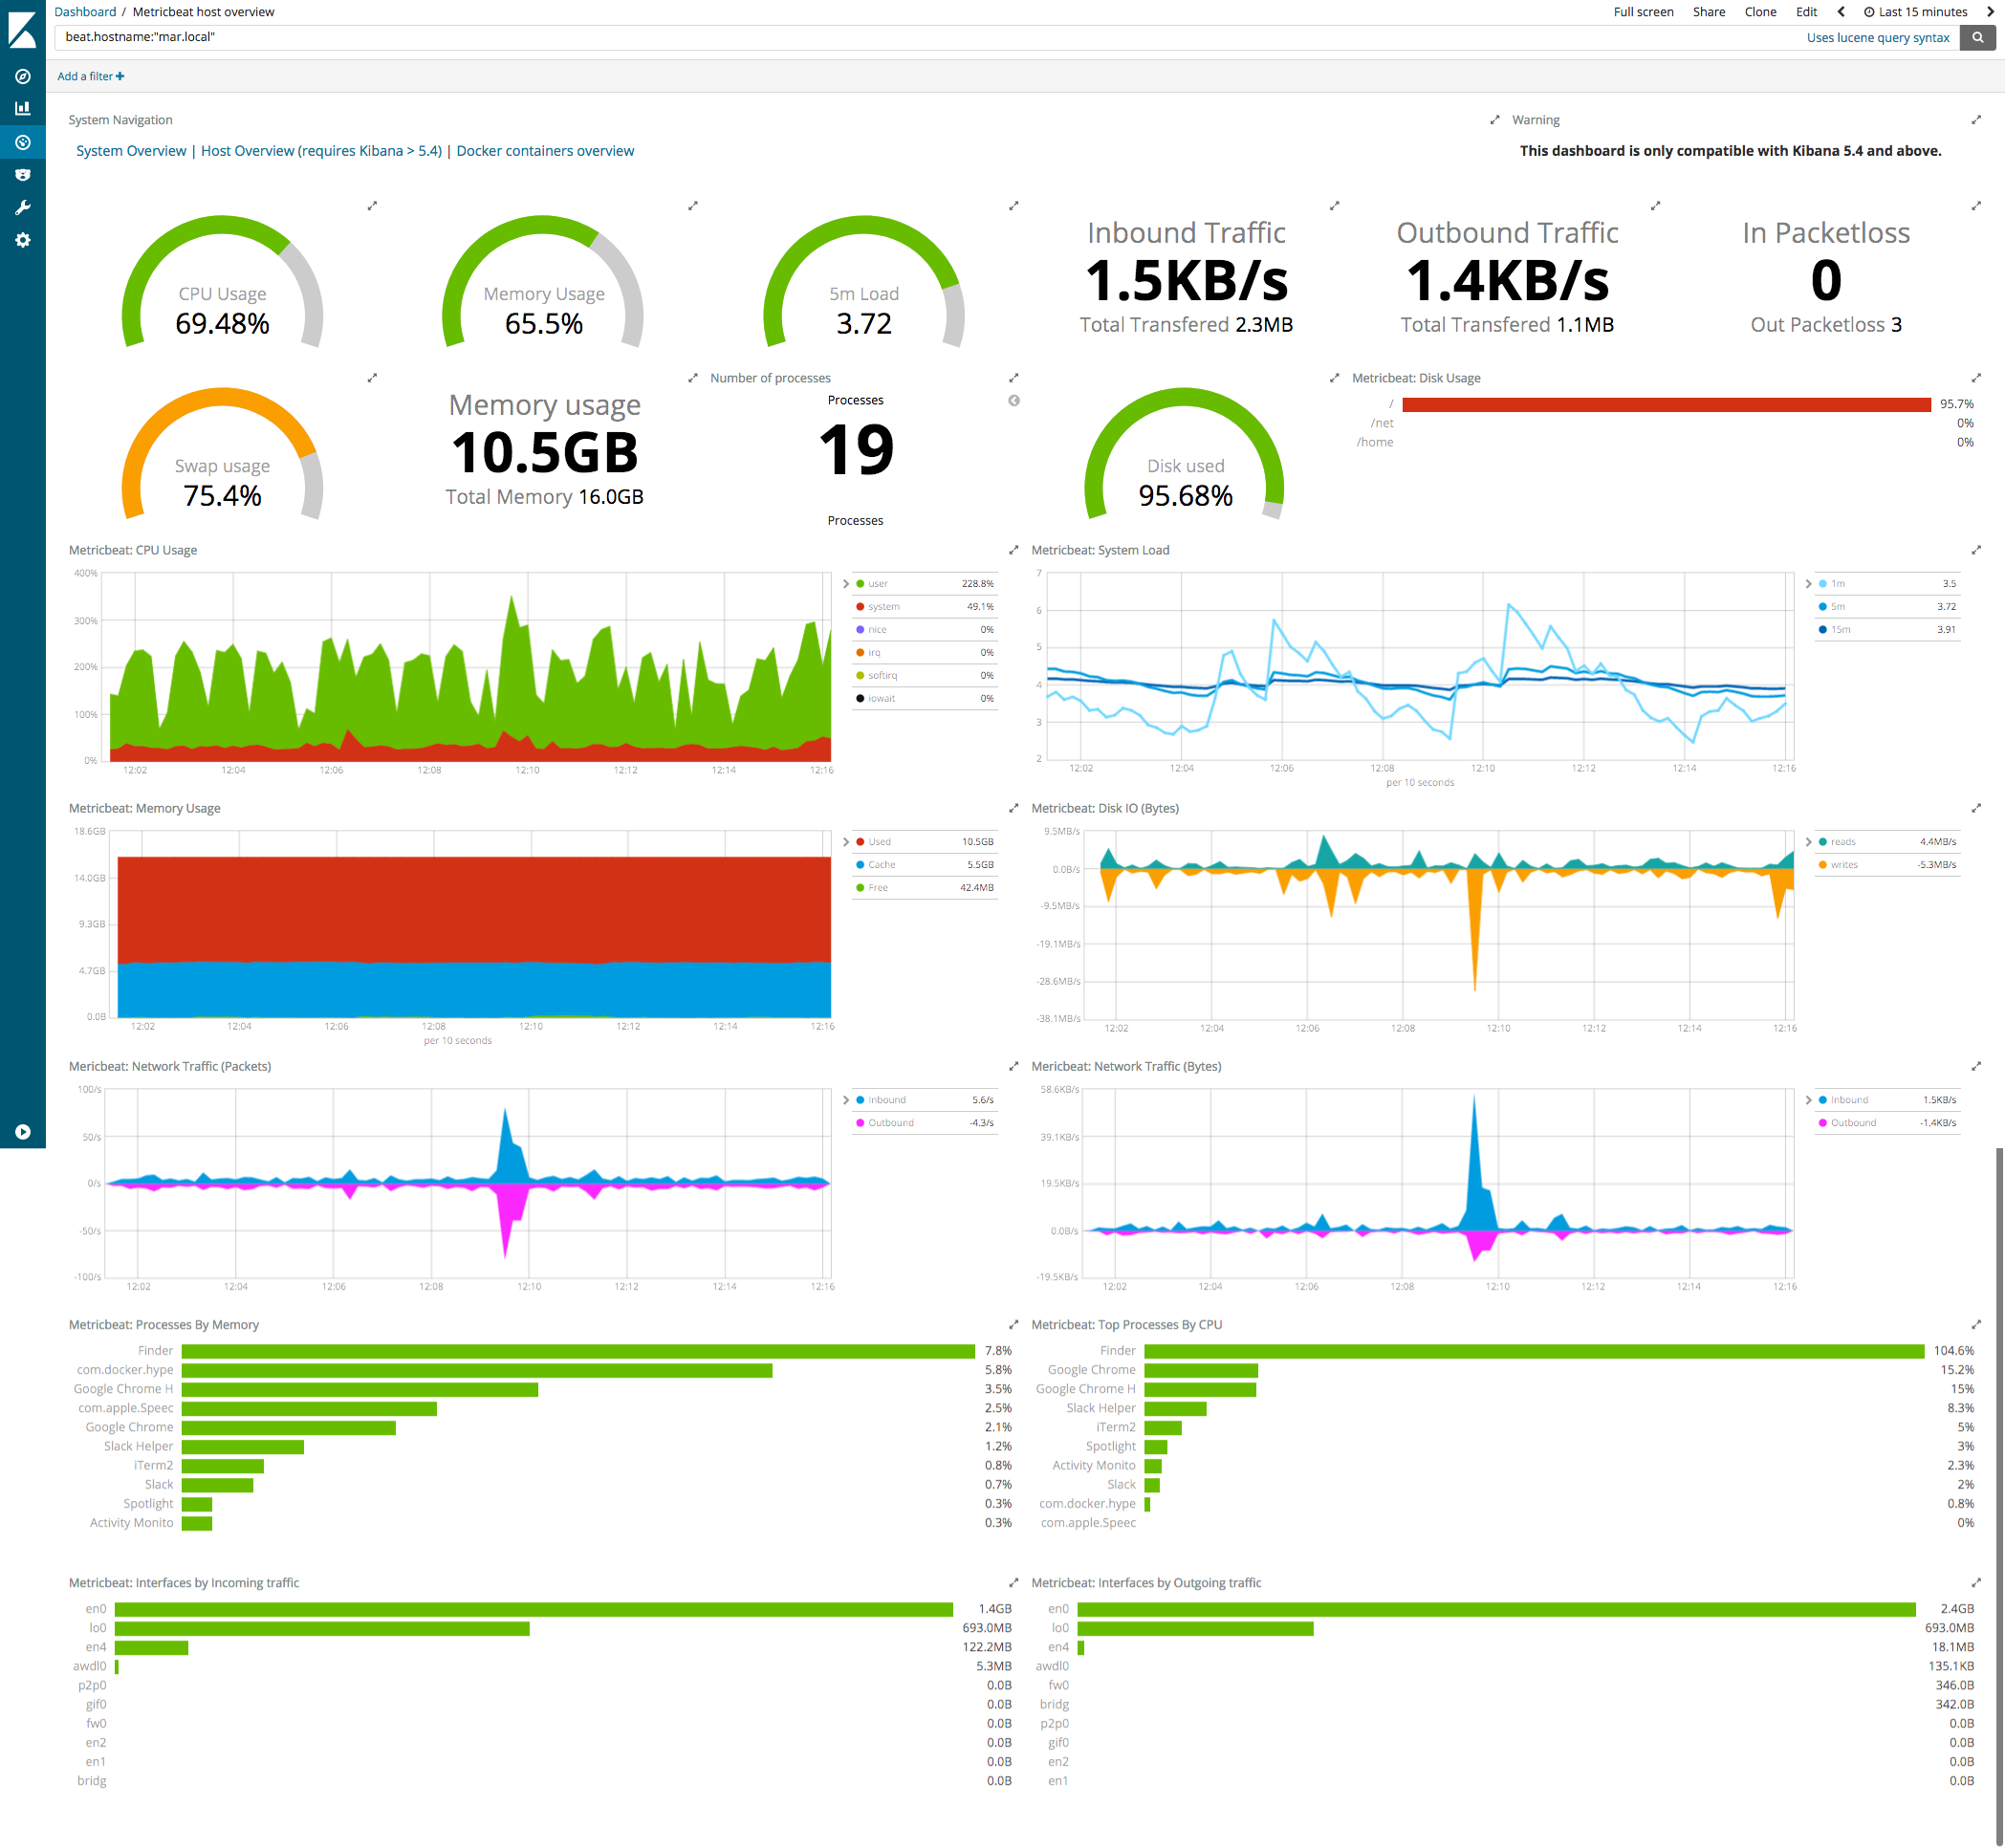
editTo make it easier for you to start monitoring your servers in Kibana,
we have created example Metricbeat dashboards. You loaded the dashboards
earlier when you ran the setup
command.
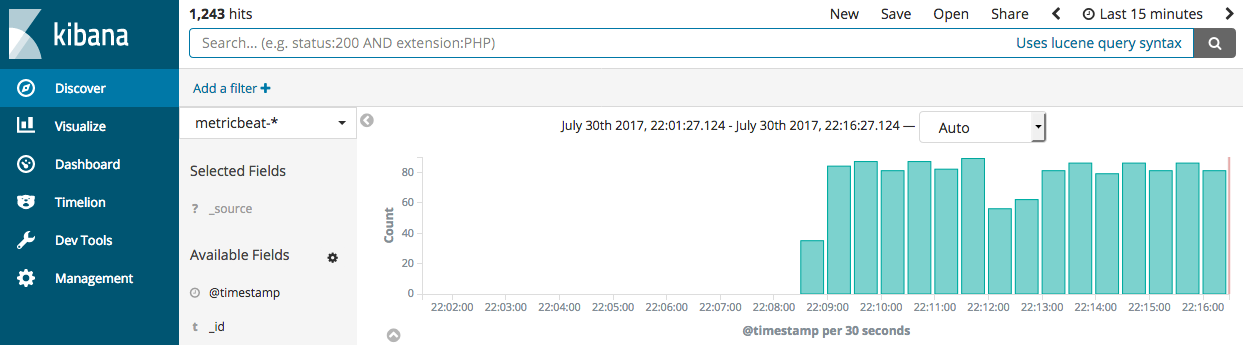
To open the dashboards, launch the Kibana web interface by pointing your browser to port 5601. For example, http://127.0.0.1:5601.
On the Discover page, make sure that the predefined metricbeat-*
index
pattern is selected to see Metricbeat data.
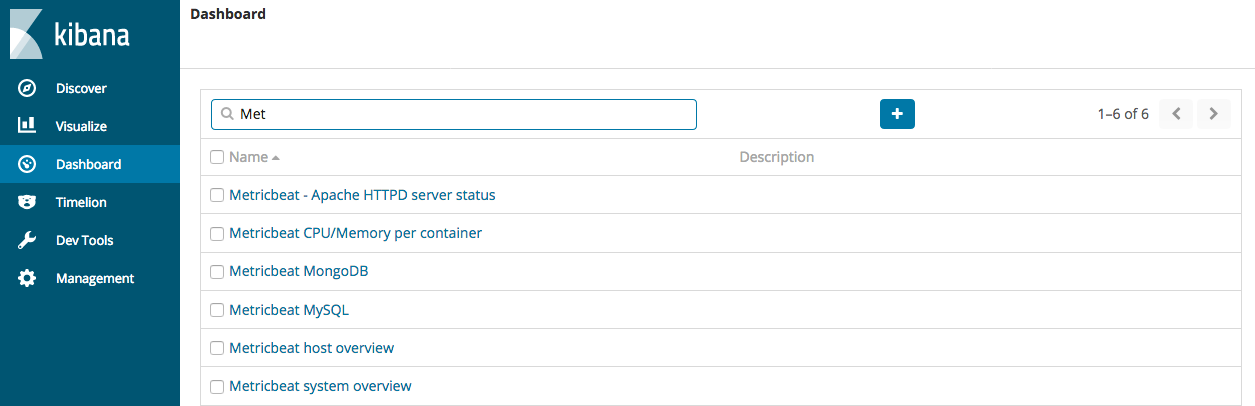
Go to the Dashboard page and select the dashboard that you want to open.
The dashboards are provided as examples. We recommend that you customize them to meet your needs.