- Metricbeat Reference: other versions:
- Overview
- Getting started with Metricbeat
- Setting up and running Metricbeat
- Upgrading Metricbeat
- How Metricbeat works
- Configuring Metricbeat
- Specify which modules to run
- Specify general settings
- Load external configuration files
- Configure the internal queue
- Configure the output
- Configure index lifecycle management
- Specify SSL settings
- Filter and enhance the exported data
- Define processors
- Add cloud metadata
- Add fields
- Add labels
- Add the local time zone
- Add tags
- Decode JSON fields
- Drop events
- Drop fields from events
- Keep fields from events
- Rename fields from events
- Add Kubernetes metadata
- Add Docker metadata
- Add Host metadata
- Dissect strings
- DNS Reverse Lookup
- Add process metadata
- Parse data by using ingest node
- Enrich events with geoIP information
- Configure project paths
- Configure the Kibana endpoint
- Load the Kibana dashboards
- Load the Elasticsearch index template
- Configure logging
- Use environment variables in the configuration
- Autodiscover
- YAML tips and gotchas
- Regular expression support
- HTTP Endpoint
- metricbeat.reference.yml
- Beats central management
- Modules
- Aerospike module
- Apache module
- aws module
- Ceph module
- Couchbase module
- couchdb module
- Docker module
- Dropwizard module
- Elasticsearch module
- Elasticsearch ccr metricset
- Elasticsearch cluster_stats metricset
- Elasticsearch index metricset
- Elasticsearch index_recovery metricset
- Elasticsearch index_summary metricset
- Elasticsearch ml_job metricset
- Elasticsearch node metricset
- Elasticsearch node_stats metricset
- Elasticsearch pending_tasks metricset
- Elasticsearch shard metricset
- envoyproxy module
- Etcd module
- Golang module
- Graphite module
- HAProxy module
- HTTP module
- Jolokia module
- Kafka module
- Kibana module
- Kubernetes module
- Kubernetes apiserver metricset
- Kubernetes container metricset
- Kubernetes event metricset
- Kubernetes node metricset
- Kubernetes pod metricset
- Kubernetes state_container metricset
- Kubernetes state_deployment metricset
- Kubernetes state_node metricset
- Kubernetes state_pod metricset
- Kubernetes state_replicaset metricset
- Kubernetes state_statefulset metricset
- Kubernetes system metricset
- Kubernetes volume metricset
- kvm module
- Logstash module
- Memcached module
- MongoDB module
- MSSQL module
- Munin module
- MySQL module
- Nats module
- Nginx module
- PHP_FPM module
- PostgreSQL module
- Prometheus module
- RabbitMQ module
- Redis module
- System module
- System core metricset
- System cpu metricset
- System diskio metricset
- System filesystem metricset
- System fsstat metricset
- System load metricset
- System memory metricset
- System network metricset
- System process metricset
- System process_summary metricset
- System raid metricset
- System socket metricset
- System socket_summary metricset
- System uptime metricset
- traefik module
- uwsgi module
- vSphere module
- Windows module
- ZooKeeper module
- Exported fields
- Aerospike fields
- Apache fields
- aws fields
- Beat fields
- Ceph fields
- Cloud provider metadata fields
- Common fields
- Couchbase fields
- couchdb fields
- Docker fields
- Docker fields
- Dropwizard fields
- ECS fields
- Elasticsearch fields
- envoyproxy fields
- Etcd fields
- Golang fields
- Graphite fields
- HAProxy fields
- Host fields
- HTTP fields
- Jolokia fields
- Kafka fields
- Kibana fields
- Kubernetes fields
- Kubernetes fields
- kvm fields
- Logstash fields
- Memcached fields
- MongoDB fields
- MSSQL fields
- Munin fields
- MySQL fields
- Nats fields
- Nginx fields
- PHP_FPM fields
- PostgreSQL fields
- Process fields
- Prometheus fields
- RabbitMQ fields
- Redis fields
- System fields
- traefik fields
- uwsgi fields
- vSphere fields
- Windows fields
- ZooKeeper fields
- Monitoring Metricbeat
- Securing Metricbeat
- Troubleshooting
- Contributing to Beats
Enrich events with geoIP information
editEnrich events with geoIP information
editYou can use Metricbeat along with the GeoIP Processor in Elasticsearch to export geographic location information based on IP addresses. Then you can use this information to visualize the location of IP addresses on a map in Kibana.
The geoip
processor adds information about the geographical location of
IP addresses, based on data from the Maxmind GeoLite2 City Database. Because the
processor uses a geoIP database that’s installed on Elasticsearch, you don’t need
to install a geoIP database on the machines running Metricbeat.
If your use case involves using Logstash, you can use the
GeoIP filter available in Logstash
instead of using the geoip
processor. However, using the geoip
processor is
the simplest approach when you don’t require the additional processing power of
Logstash.
Configure the geoip
processor
editTo configure Metricbeat and the geoip
processor:
-
Define an ingest node pipeline that uses one or more
geoip
processors to add location information to the event. For example, you can use the Console in Kibana to create the following pipeline:PUT _ingest/pipeline/geoip-info { "description": "Add geoip info", "processors": [ { "geoip": { "field": "client.ip", "target_field": "client.geo", "ignore_missing": true } }, { "geoip": { "field": "source.ip", "target_field": "source.geo", "ignore_missing": true } }, { "geoip": { "field": "destination.ip", "target_field": "destination.geo", "ignore_missing": true } }, { "geoip": { "field": "server.ip", "target_field": "server.geo", "ignore_missing": true } }, { "geoip": { "field": "host.ip", "target_field": "host.geo", "ignore_missing": true } } ] }
In this example, the pipeline ID is
geoip-info
.field
specifies the field that contains the IP address to use for the geographical lookup, andtarget_field
is the field that will hold the geographical information."ignore_missing": true
configures the pipeline to continue processing when it encounters an event that doesn’t have the specified field.See GeoIP Processor for more options.
To learn more about adding host information to an event, see Add Host metadata.
-
In the Metricbeat config file, configure the Elasticsearch output to use the pipeline. Specify the pipeline ID in the
pipeline
option underoutput.elasticsearch
. For example:output.elasticsearch: hosts: ["localhost:9200"] pipeline: geoip-info
-
Run Metricbeat. Remember to use
sudo
if the config file is owned by root../metricbeat -e
If the lookups succeed, the events are enriched with
geo_point
fields, such asclient.geo.location
andhost.geo.location
, that you can use to populate visualizations in Kibana.
If you add a field that’s not already defined as a geo_point
in the
index template, add a mapping so the field gets indexed correctly.
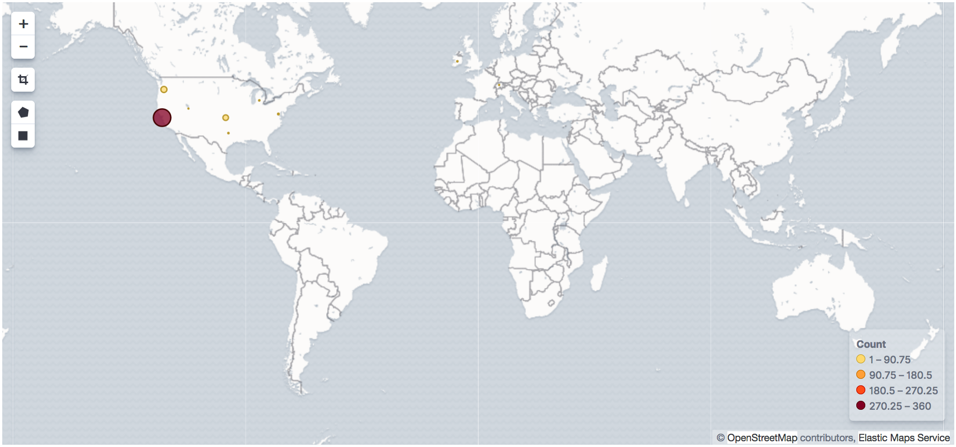
Visualize locations
editTo visualize the location of IP addresses, you can
create a new coordinate map in Kibana and select the
location field, for example client.geo.location
or host.geo.location
, as
the Geohash.
On this page