System service metricset
editSystem service metricset
editThis functionality is in beta and is subject to change. The design and code is less mature than official GA features and is being provided as-is with no warranties. Beta features are not subject to the support SLA of official GA features.
The service metricset reports on the status of systemd services.
This metricset is available on:
- Linux
systemd resource accounting and process metrics
editIf systemd resource accounting is enabled, this metricset will report any resources tracked by systemd. On most distributions, tasks and memory are the only resources with accounting enabled by default.
For more information, see the systemd manual pages.
Configuration
editservice.state_filter - A list of service states to filter by. This can be any of the states or sub-states known to systemd.
service.pattern_filter - A list of glob patterns to filter service names by. This is an "or" filter, and will report any systemd unit that matches at least one filter pattern.
Dashboard
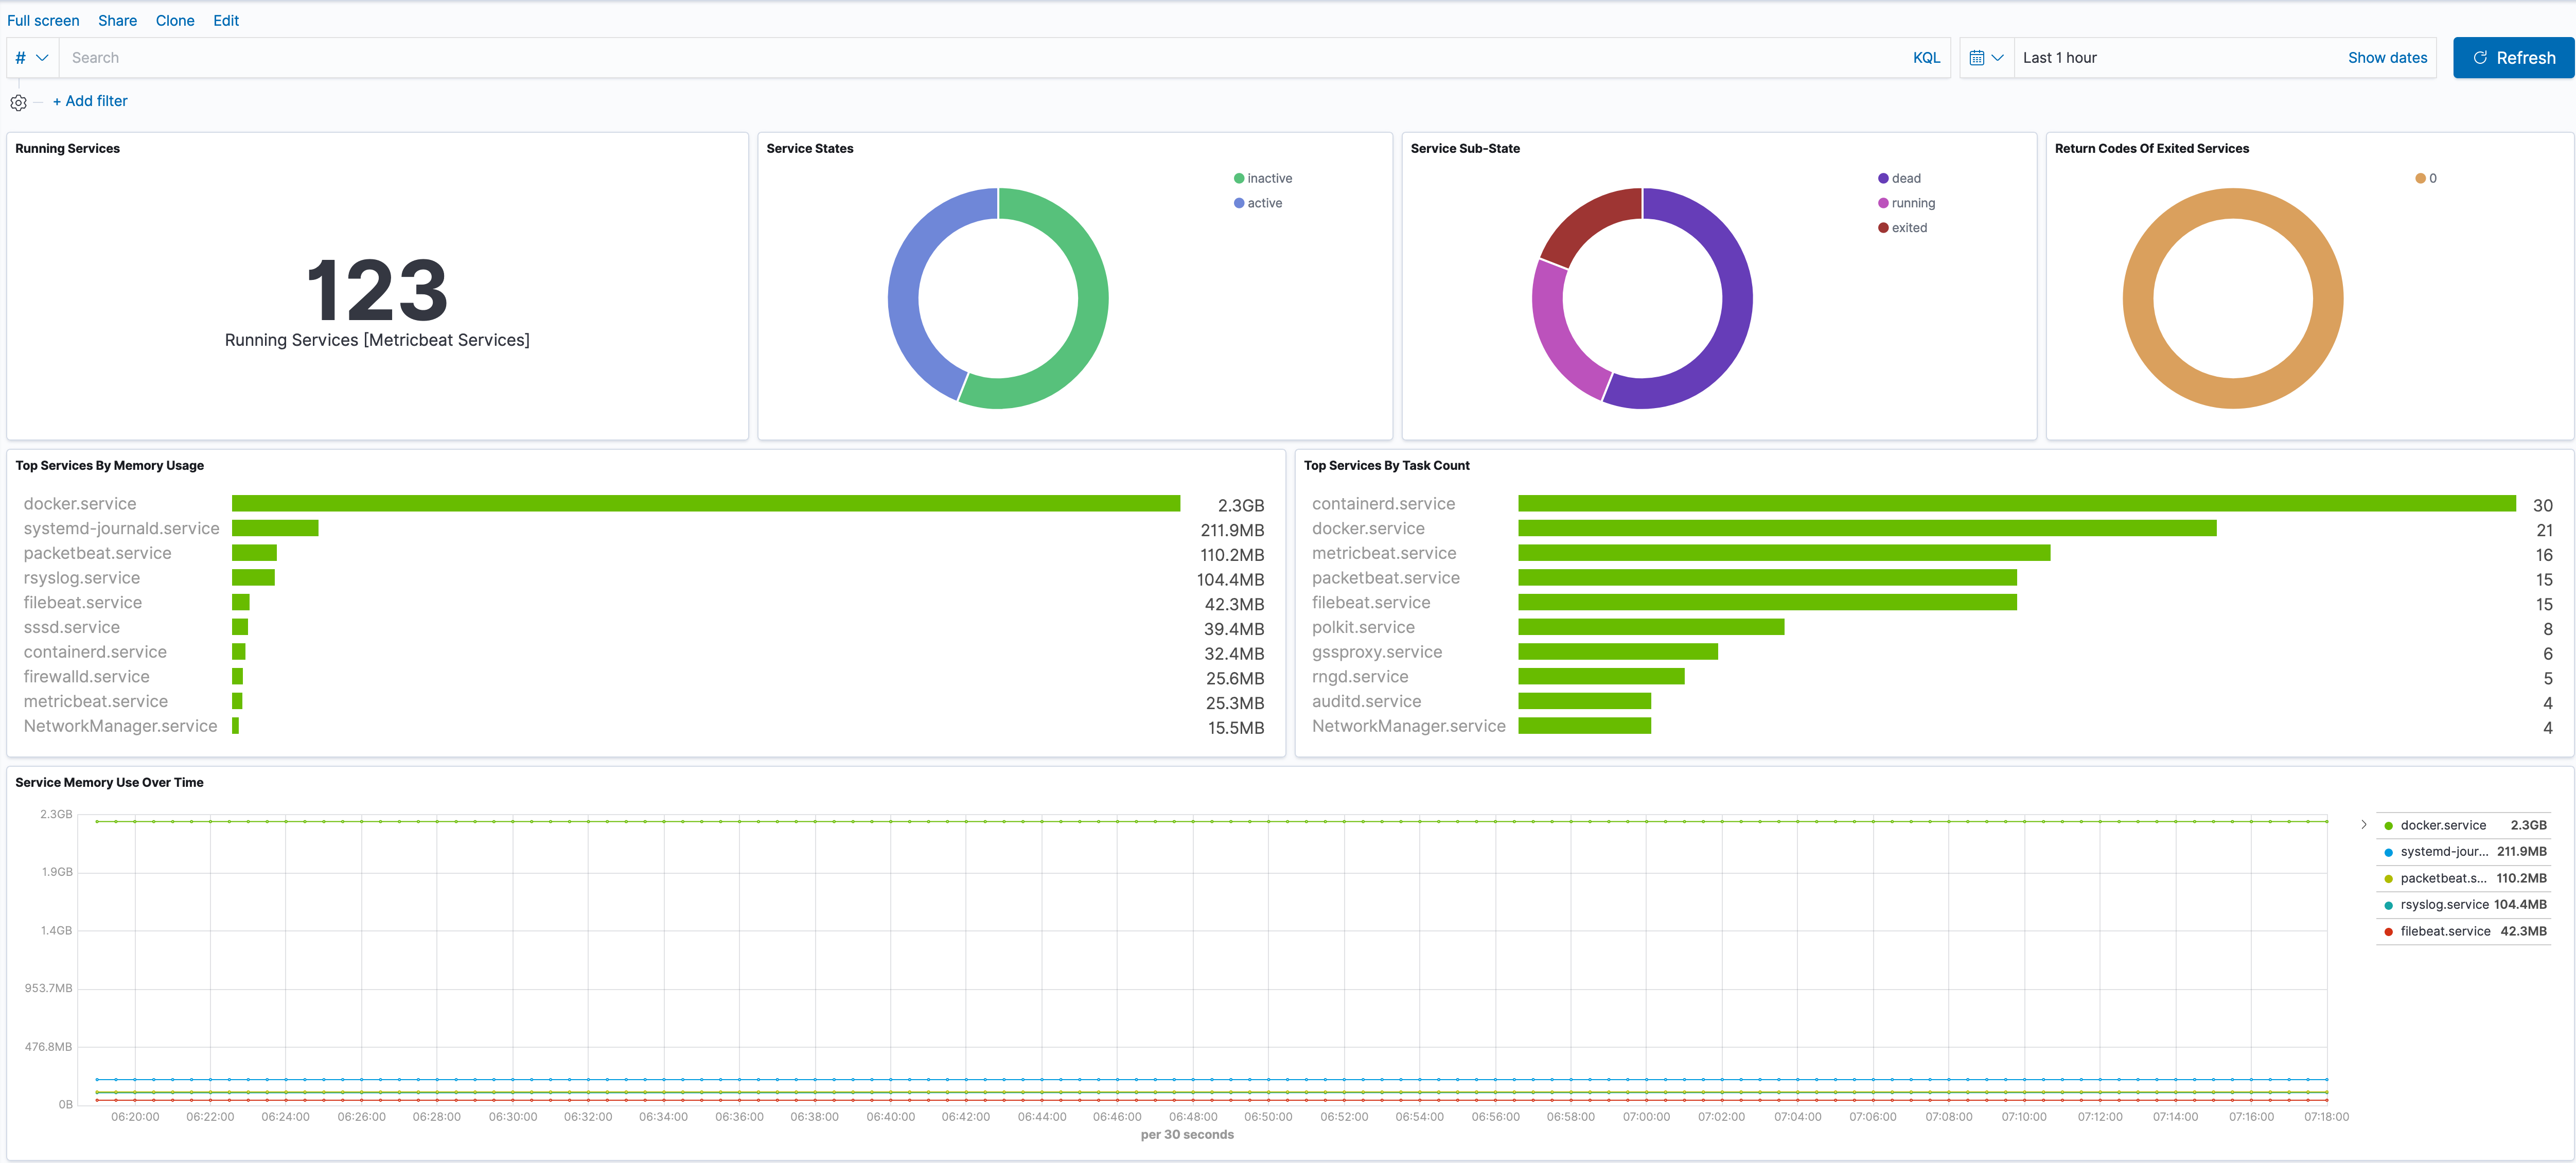
editThe system service metricset comes with a predefined dashboard. For example:

Fields
editFor a description of each field in the metricset, see the exported fields section.
Here is an example document generated by this metricset:
{
    "@timestamp": "2017-10-12T08:05:34.853Z",
    "event": {
        "dataset": "system.service",
        "duration": 115000,
        "module": "system"
    },
    "metricset": {
        "name": "service",
        "period": 10000
    },
    "process": {
        "pid": 811
    },
    "service": {
        "type": "system"
    },
    "system": {
        "service": {
            "load_state": "loaded",
            "name": "NetworkManager.service",
            "resources": {
                "memory": {
                    "usage": {
                        "bytes": 15646720
                    }
                },
                "tasks": {
                    "count": 4
                }
            },
            "state": "active",
            "state_since": "2019-10-18T21:24:57.581561-07:00",
            "sub_state": "running"
        }
    },
    "systemd": {
        "fragment_path": "/usr/lib/systemd/system/NetworkManager.service",
        "unit": "NetworkManager.service"
    }
}