AWS ec2 metricset
editAWS ec2 metricset
editThe ec2 metricset of aws module allows you to monitor your AWS EC2 instances,
including cpu, network, disk and status. ec2 metricset fetches a set of values from
Cloudwatch AWS EC2 Metrics.
We fetch the following data:
- cpu.total.pct: The percentage of allocated EC2 compute units that are currently in use on the instance.
- cpu.credit_usage: The number of CPU credits spent by the instance for CPU utilization.
- cpu.credit_balance: The number of earned CPU credits that an instance has accrued since it was launched or started.
- cpu.surplus_credit_balance: The number of surplus credits that have been spent by an unlimited instance when its CPUCreditBalance value is zero.
- cpu.surplus_credits_charged: The number of spent surplus credits that are not paid down by earned CPU credits, and which thus incur an additional charge.
- network.in.packets: The number of packets received on all network interfaces by the instance.
- network.out.packets: The number of packets sent out on all network interfaces by the instance.
- network.in.bytes: The number of bytes received on all network interfaces by the instance.
- network.out.bytes: The number of bytes sent out on all network interfaces by the instance.
- diskio.read.bytes: Bytes read from all instance store volumes available to the instance.
- diskio.write.bytes: Bytes written to all instance store volumes available to the instance.
- diskio.read.ops: Completed read operations from all instance store volumes available to the instance in a specified period of time.
- diskio.write.ops: Completed write operations to all instance store volumes available to the instance in a specified period of time.
- status.check_failed: Reports whether the instance has passed both the instance status check and the system status check in the last minute.
- status.check_failed_system: Reports whether the instance has passed the system status check in the last minute.
- status.check_failed_instance: Reports whether the instance has passed the instance status check in the last minute.
- instance.core.count: The number of CPU cores for the instance.
- instance.image.id: The ID of the image used to launch the instance.
- instance.monitoring.state: Indicates whether detailed monitoring is enabled.
- instance.private.dns_name: The private DNS name of the network interface.
- instance.private.ip: The private IPv4 address associated with the network interface.
- instance.public.dns_name: The public DNS name of the instance.
- instance.public.ip: The address of the Elastic IP address (IPv4) bound to the network interface.
- instance.state.code: The state of the instance, as a 16-bit unsigned integer.
- instance.threads_per_core: The state of the instance (pending | running | shutting-down | terminated | stopping | stopped).
AWS Permissions
editSome specific AWS permissions are required for IAM user to collect AWS EC2 metrics.
ec2:DescribeInstances
ec2:DescribeRegions
cloudwatch:GetMetricData
cloudwatch:ListMetrics
sts:GetCallerIdentity
iam:ListAccountAliases
Dashboard
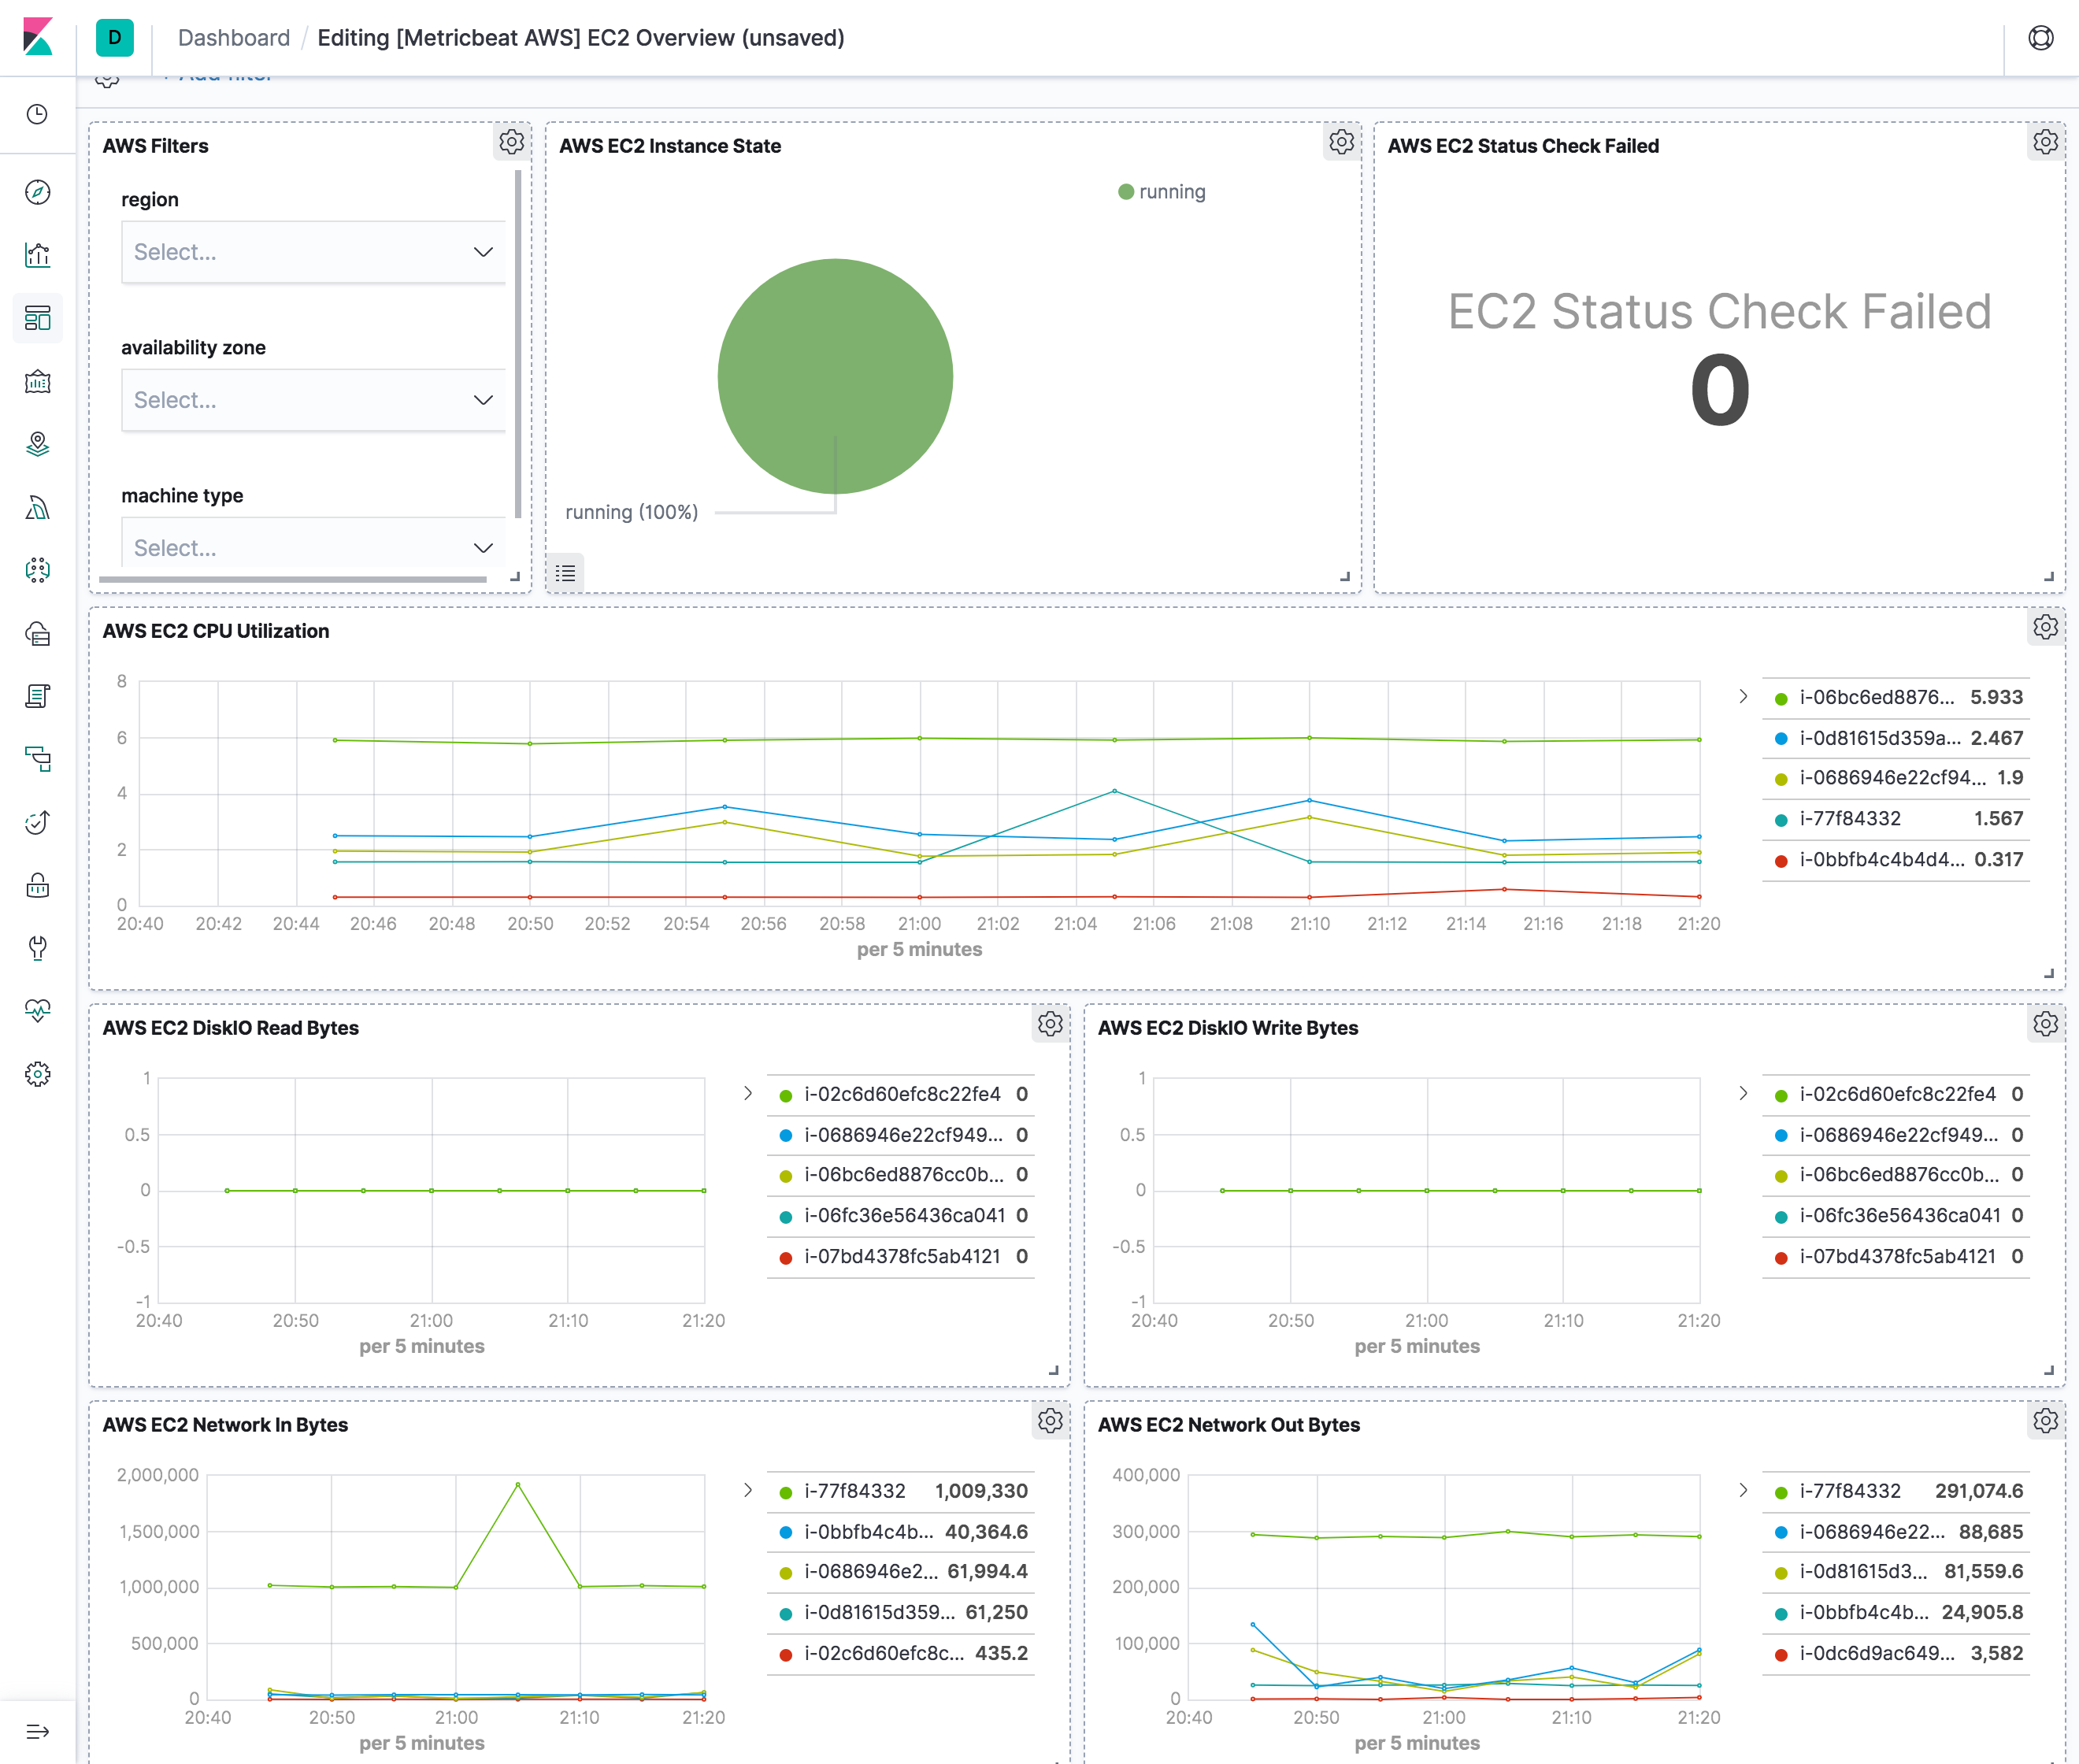
editThe aws ec2 metricset comes with a predefined dashboard. For example:

Configuration example
edit- module: aws
period: 300s
metricsets:
- ec2
access_key_id: '<access_key_id>'
secret_access_key: '<secret_access_key>'
session_token: '<session_token>'
tags_filter:
- key: "Organization"
value: "Engineering"
tags_filter can be specified to only collect metrics with certain tag keys/values.
For example, with the configuration example above, ec2 metricset will only collect
metrics from EC2 instances that have tag key equals "Organization" and tag value
equals to "Engineering".
This is a default metricset. If the host module is unconfigured, this metricset is enabled by default.
Fields
editFor a description of each field in the metricset, see the exported fields section.
Here is an example document generated by this metricset:
{
    "@timestamp": "2017-10-12T08:05:34.853Z",
    "aws": {
        "ec2": {
            "cpu": {
                "credit_balance": 576,
                "credit_usage": 0.217777,
                "surplus_credit_balance": 0,
                "surplus_credits_charged": 0,
                "total": {
                    "pct": 2.1374965268131265
                }
            },
            "diskio": {
                "read": {
                    "bytes": 0,
                    "bytes_per_sec": 0,
                    "count": 0,
                    "count_per_sec": 0
                },
                "write": {
                    "bytes": 0,
                    "bytes_per_sec": 0,
                    "count": 0,
                    "count_per_sec": 0
                }
            },
            "instance": {
                "core": {
                    "count": 2
                },
                "image": {
                    "id": "ami-f920cd94"
                },
                "monitoring": {
                    "state": "disabled"
                },
                "private": {
                    "dns_name": "ip-10-0-0-148.ec2.internal",
                    "ip": "10.0.0.148"
                },
                "public": {
                    "dns_name": "ec2-54-226-109-162.compute-1.amazonaws.com",
                    "ip": "54.226.109.162"
                },
                "state": {
                    "code": 16,
                    "name": "running"
                },
                "threads_per_core": 1
            },
            "network": {
                "in": {
                    "bytes": 1510123.4,
                    "bytes_per_sec": 5033.7446666666665,
                    "packets": 3126.4,
                    "packets_per_sec": 10.421333333333333
                },
                "out": {
                    "bytes": 464863,
                    "bytes_per_sec": 1549.5433333333333,
                    "packets": 3031.2,
                    "packets_per_sec": 10.104
                }
            },
            "status": {
                "check_failed": 0,
                "check_failed_instance": 0,
                "check_failed_system": 0
            }
        },
        "tags": {
            "Cost": "$614.01",
            "Name": "container-registry-test-ui.elastic.co"
        }
    },
    "cloud": {
        "account": {
            "id": "627959692251",
            "name": "elastic-test"
        },
        "availability_zone": "us-east-1b",
        "instance": {
            "id": "i-77f84332"
        },
        "machine": {
            "type": "t2.medium"
        },
        "provider": "aws",
        "region": "us-east-1"
    },
    "event": {
        "dataset": "aws.ec2",
        "duration": 115000,
        "module": "aws"
    },
    "metricset": {
        "name": "ec2",
        "period": 10000
    },
    "service": {
        "type": "aws"
    }
}