WARNING: Version 1.2 of Packetbeat has passed its EOL date.
This documentation is no longer being maintained and may be removed. If you are running this version, we strongly advise you to upgrade. For the latest information, see the current release documentation.
Viewing the Topology Diagram
editViewing the Topology Diagram
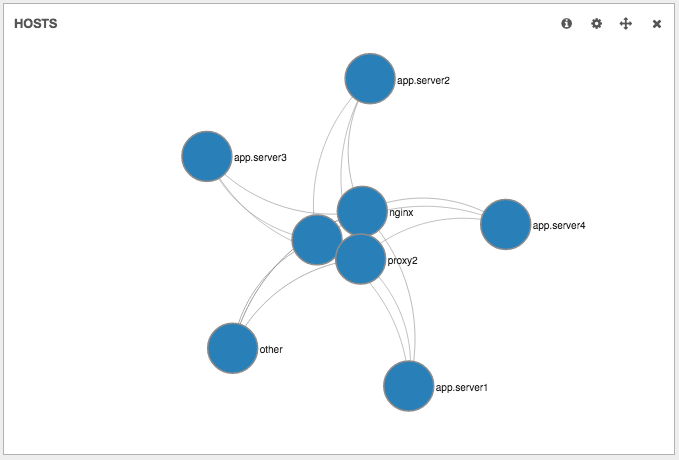
editWe currently recommend using Kibana 4 together with Packetbeat. However, the topology panel type is not yet available for Kibana 4. This panel type is implemented in a fork of Kibana 3 that was never merged (and never will be). When Kibana 4 adds support for plugins, the topology panel will be re-implemented as a plugin.

This page walks you through the steps required to install the forked Kibana 3 and load the Packetbeat dashboards. You can install Kibana 3 on the same system as Kibana 4.
Downloading the Kibana 3 Fork
editDownload and install the Kibana 3 fork by issuing the following commands:
curl -L -O https://github.com/packetbeat/kibana/releases/download/v3.1.2-pb/kibana-3.1.2-packetbeat.tar.gz
tar -xzvf kibana-3.1.2-packetbeat.tar.gz
Kibana 3 is a pure JavaScript application running fully in the browser. It doesn’t have or need a sever-side part like most web applications. Instead, you only needed a web server to serve the JavaScript files and the static resources. For example, you can use Python to create a simple web server:
cd kibana-3.1.2-packetbeat
python -m SimpleHTTPServer
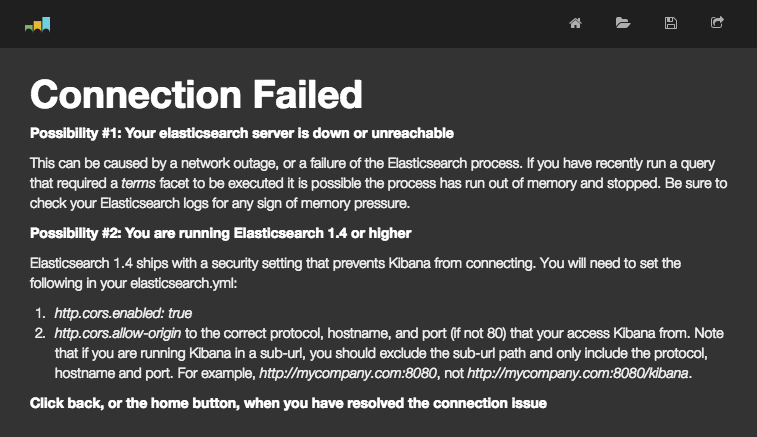
Now point your browser to port 8000, and you should see the Kibana web interface. It will probably complain that it cannot reach Elasticsearch, like in the following screenshot:

This is because
cross-origin resource sharing (CORS) is
disabled by default in recent versions of Elasticsearch to respect the "secure
by default" philosophy. You can enable CORS by adding the following lines to the
end of the /etc/elasticsearch/elasticsearch.yml file:
http.cors.enabled: true
http.cors.allow-origin: http://localhost:8000
Make sure that you replace http://localhost:8000 with the URL under which you
access Kibana up to the first slash. Restart Elasticsearch:
sudo /etc/init.d/elasticsearch restart
And try again to access Kibana in your browser. You should now see Kibana’s welcome page.
Loading Packetbeat Dashboards
editTo load our sample Kibana 3 dashboards, use the following commands:
curl -L -O https://download.elastic.co/beats/packetbeat/packetbeat-dashboards-k3-1.0.0~Beta1.tar.gz
tar xzvf packetbeat-dashboards-k3-1.0.0~Beta1.tar.gz
cd packetbeat-dashboards-k3-1.0.0~Beta1/
./load.sh localhost
Make sure you replace localhost with the host of your Elasticsearch
server.