Connect to Elasticsearch
This section explains how to connect client applications to an Elasticsearch deployment running on ECE. You can use the endpoint URL available in the deployment UI, or the Cloud ID for a simplified setup with compatible clients such as Beats and Logstash.
To successfully connect to a deployment, you need both the connection details and valid authentication credentials for an authorized user in the target deployment. For more details on authentication and authorization mechanisms in ECE, refer to Users and roles.
To connect to your Elasticsearch cluster, copy the Elasticsearch endpoint from the deployment page in the Cloud UI.
Application endpoints in ECE are generated based on the domain name configured in Platform > Settings. To learn how to modify these endpoints, refer to Change endpoint URLs.
Once you have the endpoint, use it in your client application. To test connectivity, you can:
Open the endpoint in your browser and enter authentication details when prompted.
Modify the following
curlexample to fit your environment by replacing the URL and proxy CA certificate with your own values.curl --cacert /path/to/elastic-ece-ca-cert.pem -u elastic https://<CLUSTER_ID.LOCAL_HOST_IP>.ip.es.io:9243 { "name" : "instance-0000000000", "cluster_name" : "f76e96da2a7f4d3f8f3ee25d686b879c", "cluster_uuid" : "w2SXqdACQCy5AAixXRxeXg", "version" : { "number" : "8.17.3", "build_flavor" : "default", "build_type" : "docker", "build_hash" : "a091390de485bd4b127884f7e565c0cad59b10d2", "build_date" : "2025-02-28T10:07:26.089129809Z", "build_snapshot" : false, "lucene_version" : "9.12.0", "minimum_wire_compatibility_version" : "7.17.0", "minimum_index_compatibility_version" : "7.0.0" }, "tagline" : "You Know, for Search" }The previous example authenticates to the cluster using the default
elasticuser. For more information on authentication and authorization in Elasticsearch, refer to Users and roles.NoteWhen connecting to Elasticsearch, you can use one of the following ports:
- Port 9243 – Secure HTTPS (recommended).
- Port 9200 – Plaintext HTTP (not recommended).
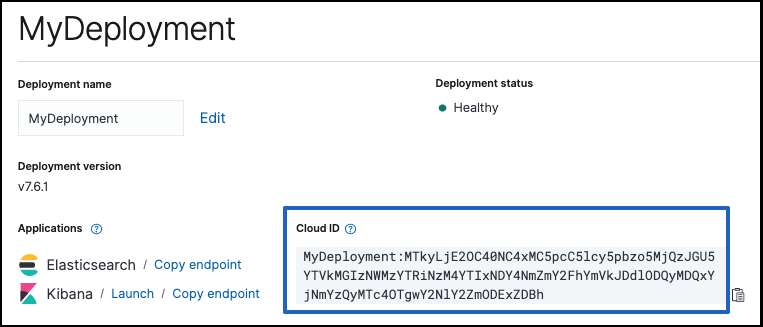
The Cloud ID reduces the number of steps required to start sending data from Beats or Logstash to your hosted Elasticsearch cluster on ECE, by assigning a unique ID to your cluster.
Connections through Cloud IDs are only supported in Beats and Logstash.
Cloud IDs are available in every deployment page, as showed below:

Include this ID along with your user credentials (defined in cloud.auth) in your Beat or Logstash configuration. ECE will handle the remaining connection details, ensuring secure data transfer to your hosted cluster.
To use the Cloud ID, you need:
- A deployment with an Elasticsearch cluster to send data to.
- Beats or Logstash, installed locally wherever you want to send data from.
- To configure Beats or Logstash, you need:
- The unique Cloud ID for your deployment, available from the deployment overview page.
- A user ID and password that has permission to send data to your Elasticsearch cluster.
In our examples, we use the elastic superuser that every Elasticsearch cluster comes with. The password for the elastic user is provided when you create a deployment (and can also be reset if you forget it). On a production system, you should adapt these examples by creating a user that can write to and access only the minimally required indices. For each Beat, review the specific feature and role table, similar to the one in Metricbeat documentation.
The following example shows how you can send operational data from Metricbeat to a new ECE deployment by using the Cloud ID. While this example uses Metricbeat, the same approach applies to other Beats.
For others, you can learn more about getting started with each Beat.
To get started with Metricbeat and Elastic Cloud Enterprise:
Create a new deployment and copy down the password for the
elasticuser.On the deployment overview page, copy down the Cloud ID.
Set up the Beat of your choice, such as Metricbeat.
Configure the Beat output to send to Elastic Cloud.
NoteMake sure you replace the values for
cloud.idandcloud.authwith your own information.Open Kibana and explore!
Metricbeat creates a data view (formerly index pattern) with defined fields, searches, visualizations, and dashboards that you can start exploring in Kibana. Look for information related to system metrics, such as CPU usage, utilization rates for memory and disk, and details for processes.