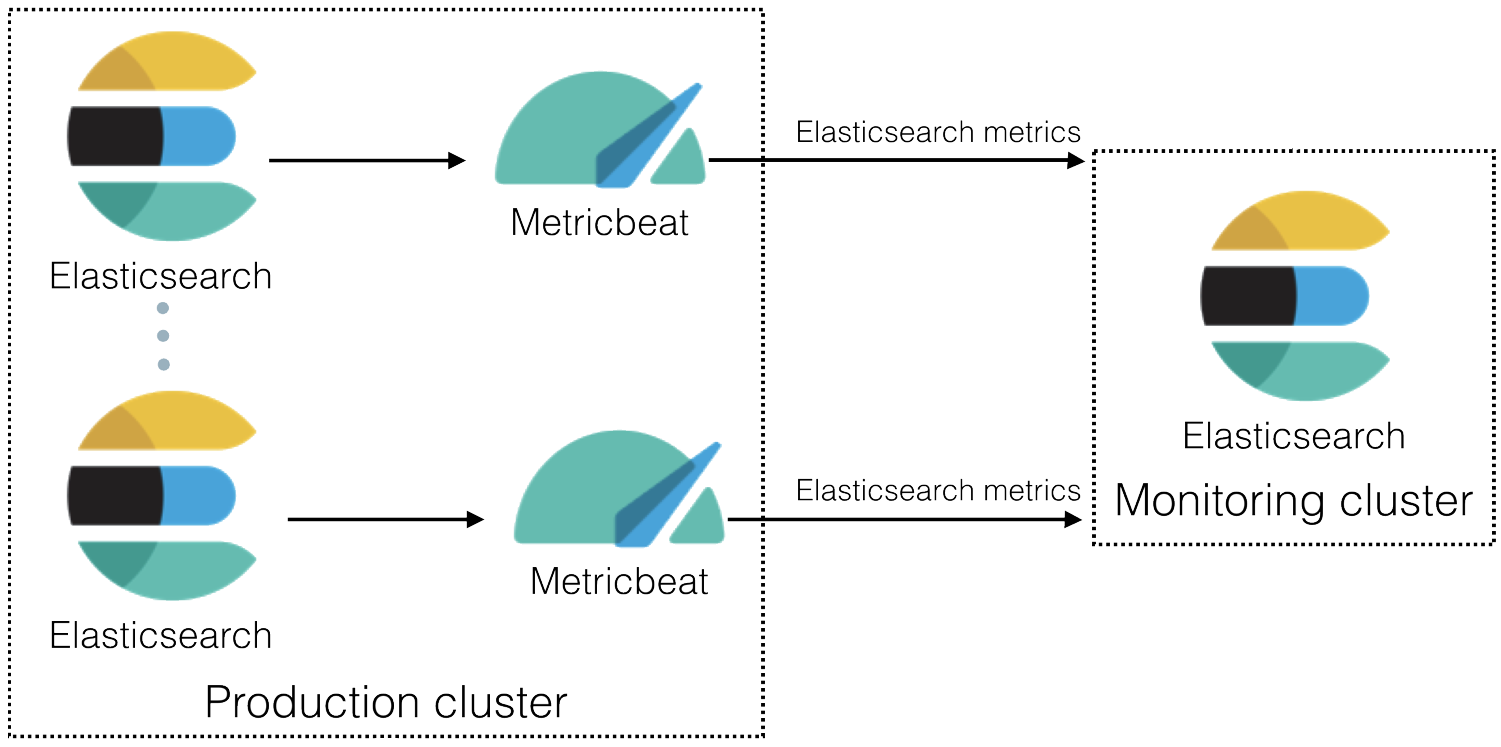
Collecting monitoring data with Metricbeat
You can use Metricbeat to collect data about Elasticsearch and ship it to the monitoring cluster.
Want to use Elastic Agent instead? Refer to Collecting monitoring data with Elastic Agent.

-
Ideally, install a single Metricbeat instance configured with
scope: clusterand configurehoststo point to an endpoint, such as a load-balancing proxy, which directs requests to the master-ineligible nodes in the cluster.If this is not possible, then install one Metricbeat instance for each Elasticsearch node in the production cluster and use the default
scope: node. When Metricbeat is monitoring Elasticsearch withscope: nodethen you must install a Metricbeat instance for each Elasticsearch node. If you don’t, some metrics will not be collected.Metricbeat with
scope: nodecollects most of the metrics from the elected master of the cluster, so you must scale up all your master-eligible nodes to account for this extra load. You should not use this mode if you have dedicated master nodes. Enable the Elasticsearch module in Metricbeat on each Elasticsearch node.
For example, to enable the default configuration for the Elastic Stack monitoring features in the
modules.ddirectory, run the following command:metricbeat modules enable elasticsearch-xpackFor more information, refer to Elasticsearch module.
Configure the Elasticsearch module in Metricbeat on each Elasticsearch node.
The
modules.d/elasticsearch-xpack.ymlfile contains the following settings:- module: elasticsearch xpack.enabled: true period: 10s hosts: ["http://localhost:9200"] #scope: node #username: "user" #password: "secret" #ssl.enabled: true #ssl.certificate_authorities: ["/etc/pki/root/ca.pem"] #ssl.certificate: "/etc/pki/client/cert.pem" #ssl.key: "/etc/pki/client/cert.key" #ssl.verification_mode: "full"- By default, the module collects Elasticsearch monitoring metrics from
http://localhost:9200. If that host and port number are not correct, you must update thehostssetting. If you configured Elasticsearch to use encrypted communications, you must access it via HTTPS. For example, use ahostssetting likehttps://localhost:9200. - By default,
scopeis set tonodeand each entry in thehostslist indicates a distinct node in an Elasticsearch cluster. If you setscopetoclusterthen each entry in thehostslist indicates a single endpoint for a distinct Elasticsearch cluster (for example, a load-balancing proxy fronting the cluster). You should usescope: clusterif the cluster has dedicated master nodes, and configure the endpoint in thehostslist not to direct requests to the dedicated master nodes.
If Elastic security features are enabled, you must also provide a user ID and password so that Metricbeat can collect metrics successfully:
- Create a user on the production cluster that has the
remote_monitoring_collectorbuilt-in role. Alternatively, use theremote_monitoring_userbuilt-in user. - Add the
usernameandpasswordsettings to the Elasticsearch module configuration file. - If TLS is enabled on the HTTP layer of your Elasticsearch cluster, you must either use https as the URL scheme in the
hostssetting or add thessl.enabled: truesetting. Depending on the TLS configuration of your Elasticsearch cluster, you might also need to specify additional ssl.* settings.
- By default, the module collects Elasticsearch monitoring metrics from
Optional: Disable the system module in Metricbeat.
By default, the system module is enabled. The information it collects, however, is not shown on the Monitoring page in Kibana. Unless you want to use that information for other purposes, run the following command:
metricbeat modules disable systemIdentify where to send the monitoring data.
TipIn production environments, we strongly recommend using a separate cluster (referred to as the monitoring cluster) to store the data. Using a separate monitoring cluster prevents production cluster outages from impacting your ability to access your monitoring data. It also prevents monitoring activities from impacting the performance of your production cluster.
For more information, refer to Monitoring in a production environment.
For example, specify the Elasticsearch output information in the Metricbeat configuration file (
metricbeat.yml):output.elasticsearch: # Array of hosts to connect to. hosts: ["<ES_MONITORING_HOST1_URL>:9200", "<ES_MONITORING_HOST2_URL>:9200"] # Optional protocol and basic auth credentials. #protocol: "https" #username: "elastic" #password: "changeme"- In this example, the data is stored on a monitoring cluster with nodes
es-mon-1andes-mon-2.
If you configured the monitoring cluster to use encrypted communications, you must access it via HTTPS. For example, use a
hostssetting likehttps://es-mon-1:9200.ImportantThe Elasticsearch monitoring features use ingest pipelines, therefore the cluster that stores the monitoring data must have at least one ingest node.
If Elasticsearch security features are enabled on the monitoring cluster, you must provide a valid user ID and password so that Metricbeat can send metrics successfully:
- Create a user on the monitoring cluster that has the
remote_monitoring_agentbuilt-in role. Alternatively, use theremote_monitoring_userbuilt-in user. - Add the
usernameandpasswordsettings to the Elasticsearch output information in the Metricbeat configuration file.
For more information about these configuration options, see Configure the Elasticsearch output.
- In this example, the data is stored on a monitoring cluster with nodes
Start Metricbeat on each node.