Edit dashboards
editEdit dashboards
editNow that you have added panels to your dashboard, you can add filter panels to interact with the data, and Markdown panels to add context to the dashboard. To make your dashboard look the way you want, use the editing options.
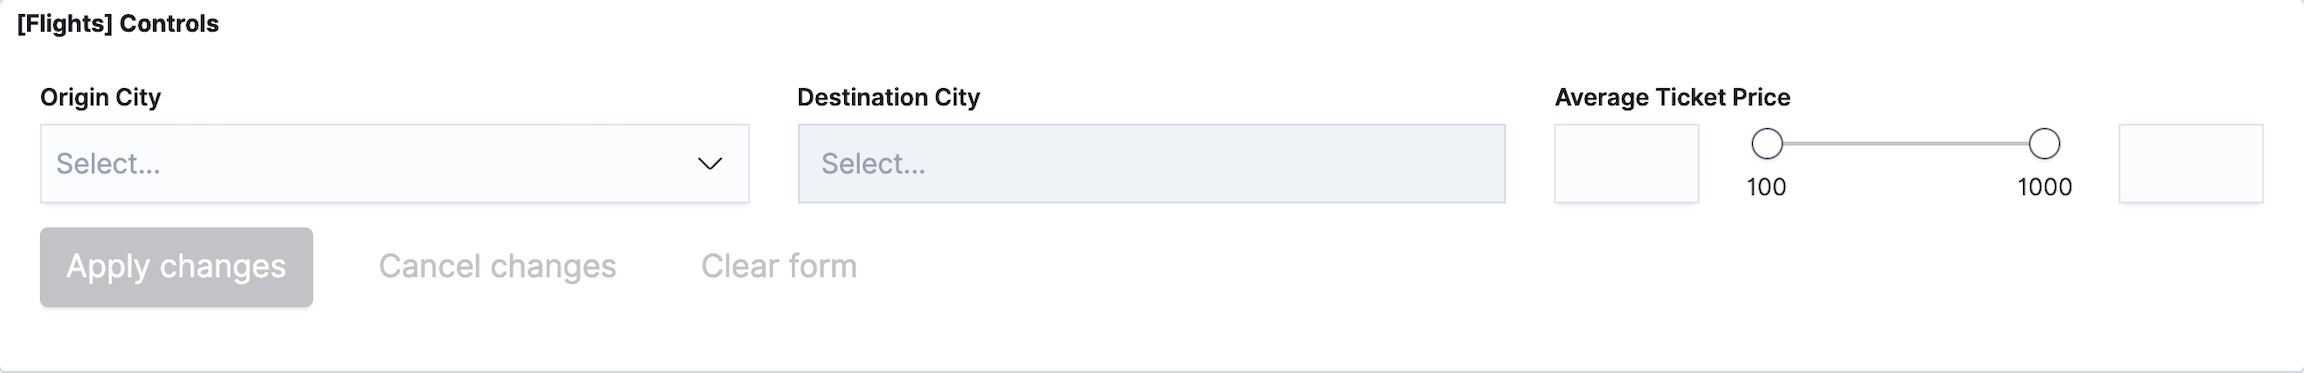
Add controls
editTo filter the data on your dashboard in real-time, add a Controls panel.
You can add two types of Controls:
- Options list — Filters content based on one or more specified options. The dropdown menu is dynamically populated with the results of a terms aggregation. For example, use the options list on the sample flight dashboard when you want to filter the data by origin city and destination city.
- Range slider — Filters data within a specified range of numbers. The minimum and maximum values are dynamically populated with the results of a min and max aggregation. For example, use the range slider when you want to filter the sample flight dashboard by a specific average ticket price.
To configure Controls for your dashboard:
-
Click Options, then configure the following:
- Update Kibana filters on each change — When selected, all interactive inputs create filters that refresh the dashboard. When unselected, Kibana filters are created only when you click Apply changes.
- Use time filter — When selected, the aggregations that generate the options list and time range are connected to the time filter.
- Pin filters to global state — When selected, all filters created by interacting with the inputs are automatically pinned.
- Click Update.
Add Markdown
editMarkdown is a text entry field that accepts GitHub-flavored Markdown text. When you enter the text, the tool populates the results on the dashboard.
Use Markdown when you want to add context to the other panels on your dashboard, such as important information, instructions and images.
For information about GitHub-flavored Markdown text, click Help.
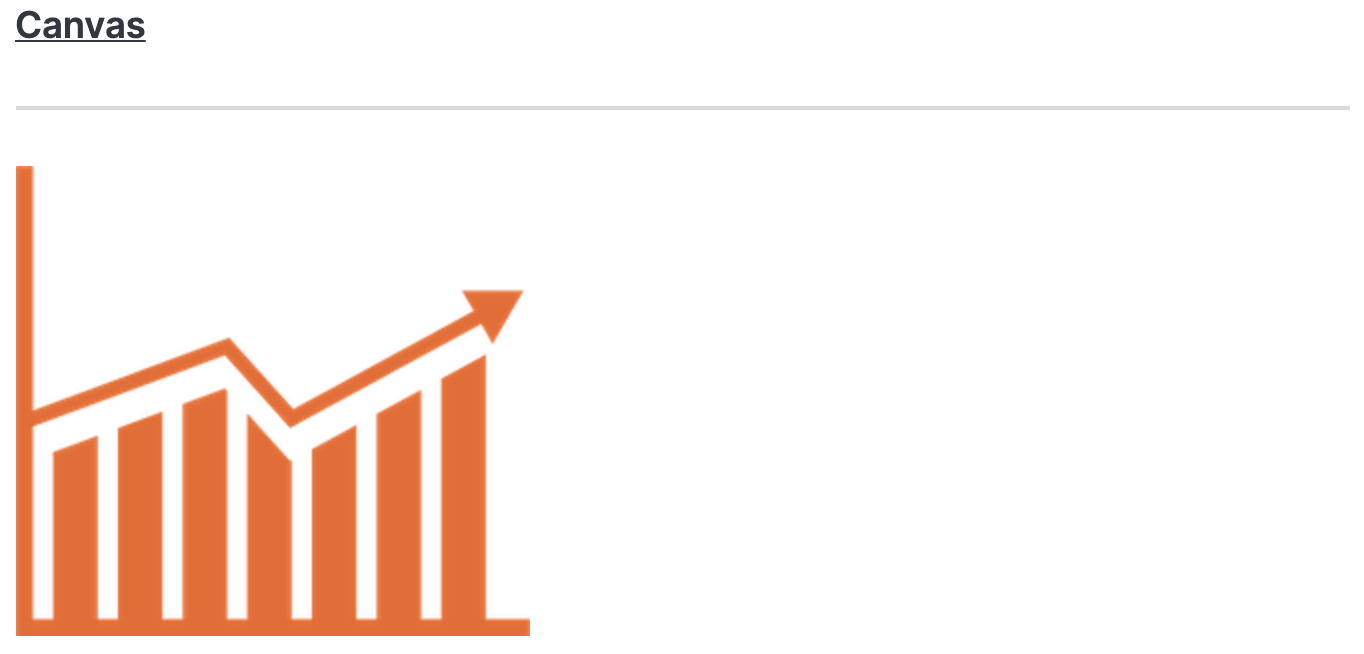
For example, when you enter:
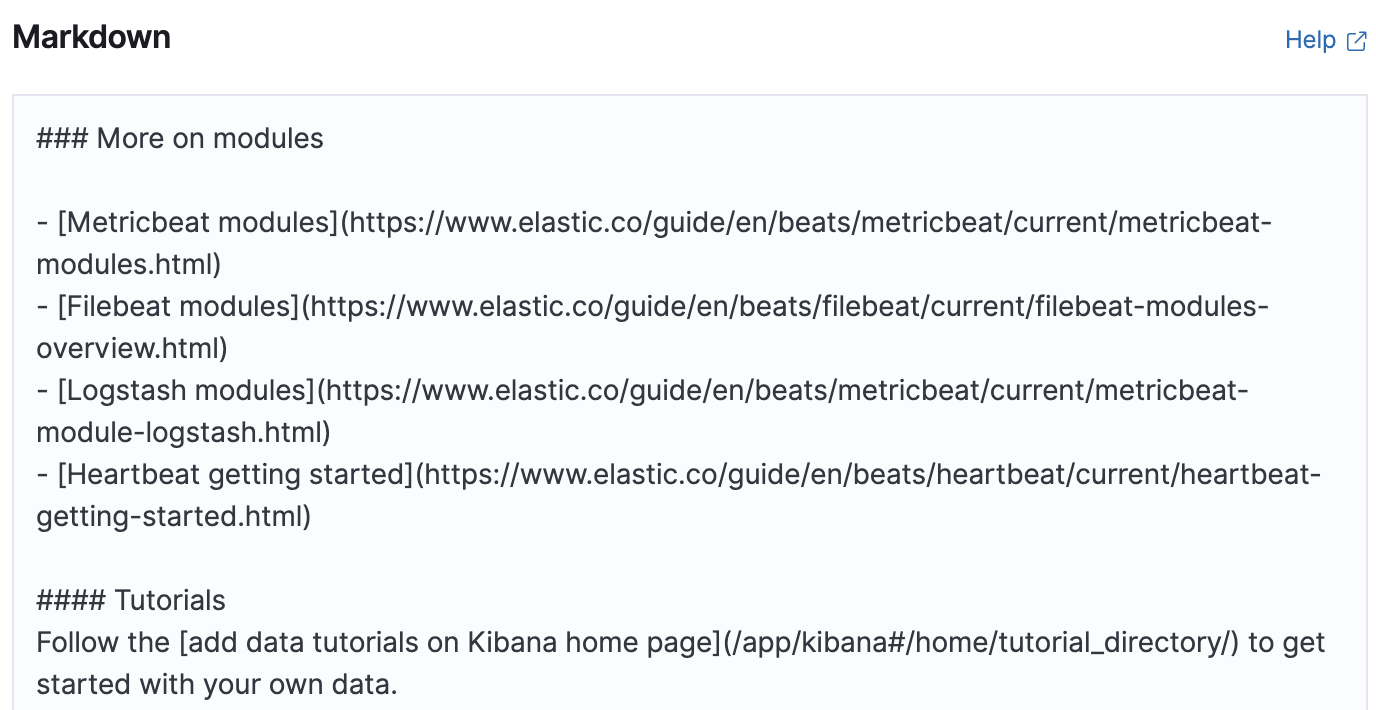
The following instructions are displayed:
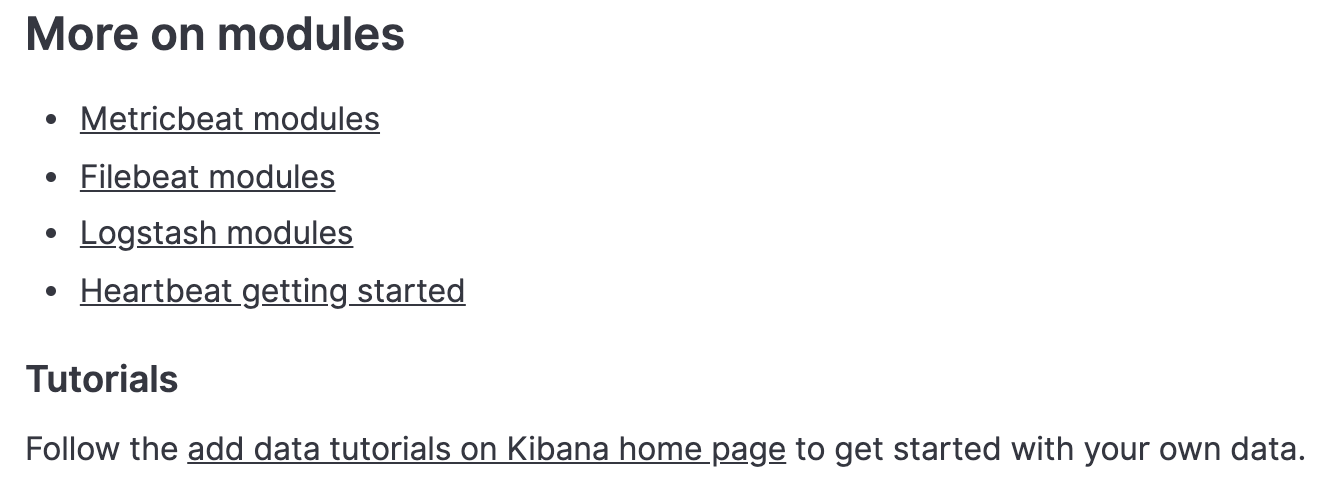
Or when you enter:
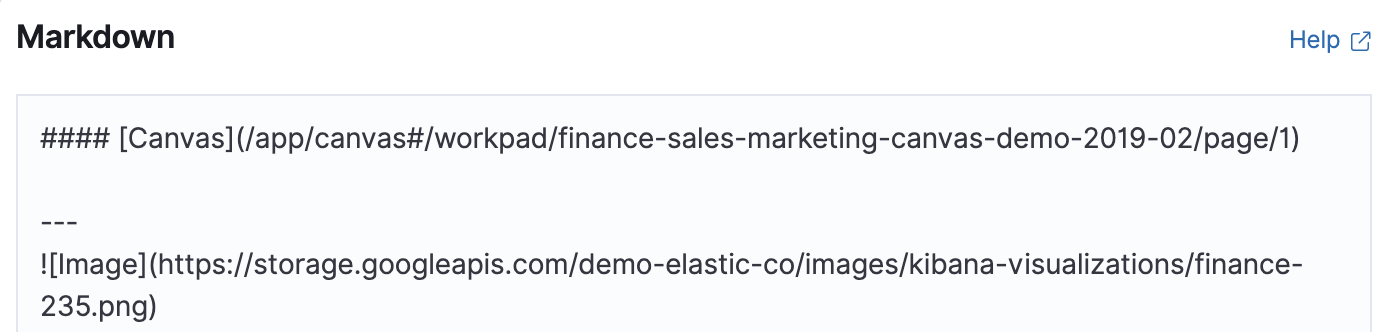
The following image is displayed:
Arrange panels
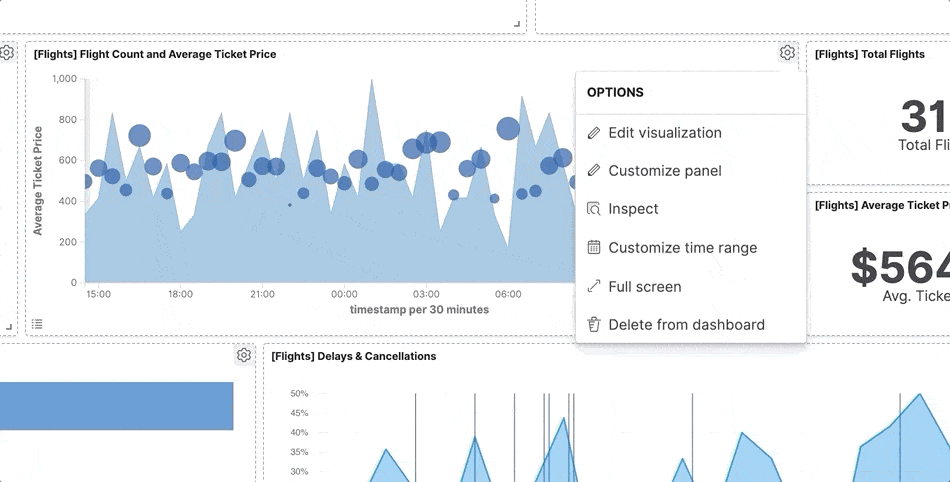
editTo make your dashboard panels look exactly how you want, you can move, resize, customize, and delete them.
Put the dashboard in Edit mode, then use the following options:
- To move, click and hold the panel header, then drag to the new location.
- To resize, click the resize control, then drag to the new dimensions.
- To delete, open the panel menu, then select Delete from dashboard. When you delete a panel from the dashboard, the visualization or saved search from the panel is still available in Kibana.
Clone panels
editTo duplicate a panel and its configured functionality, clone the panel. Cloned panels support all of the original functionality, including renaming, editing, and cloning.
- Put the dashboard in Edit mode.
- For the panel you want to clone, open the panel menu, then select Clone panel.
Cloned panels appear beside the original, and move other panels down to make room when necessary. All cloned visualization panels appear in the visualization list.
Customize time ranges
editYou can configure each visualization, saved search, and map on your dashboard for a specific time range. For example, you might want one visualization to show the monthly trend for CPU usage and another to show the current CPU usage.
From the panel menu, select Customize time range to expose a time filter dedicated to that panel. Panels that are not restricted by a specific time range are controlled by the time filter.