Create visualizations with conditional logic and tracking trends using Timelion
editCreate visualizations with conditional logic and tracking trends using Timelion
editTo easily detect outliers and discover patterns over time, modify time series data with conditional logic and create a trend with a moving average.
With Timelion conditional logic, you can use the following operator values to compare your data:
|
|
equal |
|
|
not equal |
|
|
less than |
|
|
less than or equal to |
|
|
greater than |
|
|
greater than or equal to |
Define the functions
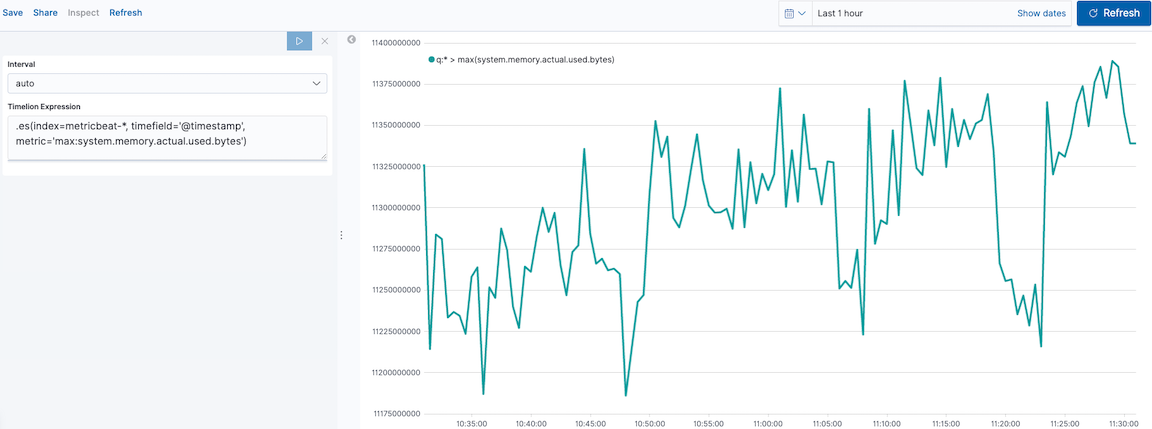
editTo chart the maximum value of system.memory.actual.used.bytes, enter the following in the Timelion Expression field:
.es(index=metricbeat-*,
    timefield='@timestamp',
    metric='max:system.memory.actual.used.bytes')
Track used memory
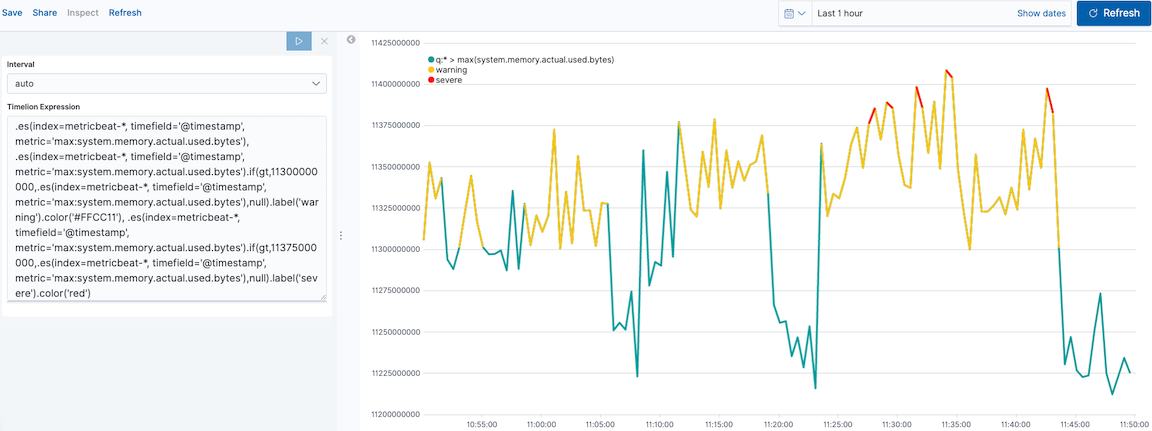
editTo track the amount of memory used, create two thresholds:
.es(index=metricbeat-*,
    timefield='@timestamp',
    metric='max:system.memory.actual.used.bytes'),
.es(index=metricbeat-*,
    timefield='@timestamp',
    metric='max:system.memory.actual.used.bytes')
  .if(gt,
      11300000000,
      .es(index=metricbeat-*,
          timefield='@timestamp',
          metric='max:system.memory.actual.used.bytes'),
      null)
    .label('warning')
    .color('#FFCC11'),
.es(index=metricbeat-*,
    timefield='@timestamp',
    metric='max:system.memory.actual.used.bytes')
  .if(gt,
      11375000000,
      .es(index=metricbeat-*,
          timefield='@timestamp',
          metric='max:system.memory.actual.used.bytes'),
      null)
  .label('severe')
  .color('red')
|
Timelion conditional logic for the greater than operator. In this example, the warning threshold is 11.3GB ( |
|
|
|
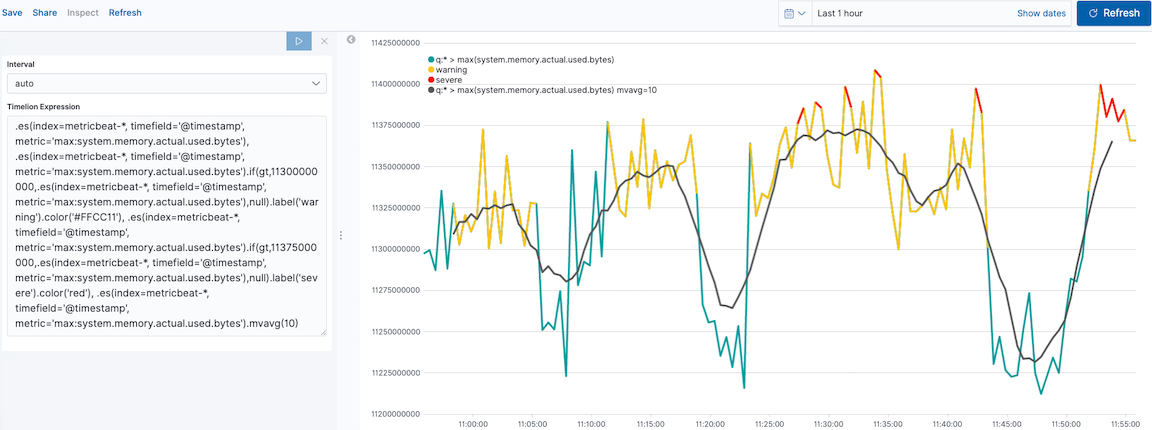
Determine the trend
editTo determine the trend, create a new data series:
.es(index=metricbeat-*,
    timefield='@timestamp',
    metric='max:system.memory.actual.used.bytes'),
.es(index=metricbeat-*,
    timefield='@timestamp',
    metric='max:system.memory.actual.used.bytes')
  .if(gt,11300000000,
      .es(index=metricbeat-*,
          timefield='@timestamp',
          metric='max:system.memory.actual.used.bytes'),
      null)
      .label('warning')
      .color('#FFCC11'),
.es(index=metricbeat-*,
    timefield='@timestamp',
    metric='max:system.memory.actual.used.bytes')
  .if(gt,11375000000,
      .es(index=metricbeat-*,
          timefield='@timestamp',
          metric='max:system.memory.actual.used.bytes'),
      null).
      label('severe')
      .color('red'),
.es(index=metricbeat-*,
    timefield='@timestamp',
    metric='max:system.memory.actual.used.bytes')
  .mvavg(10)
|
|
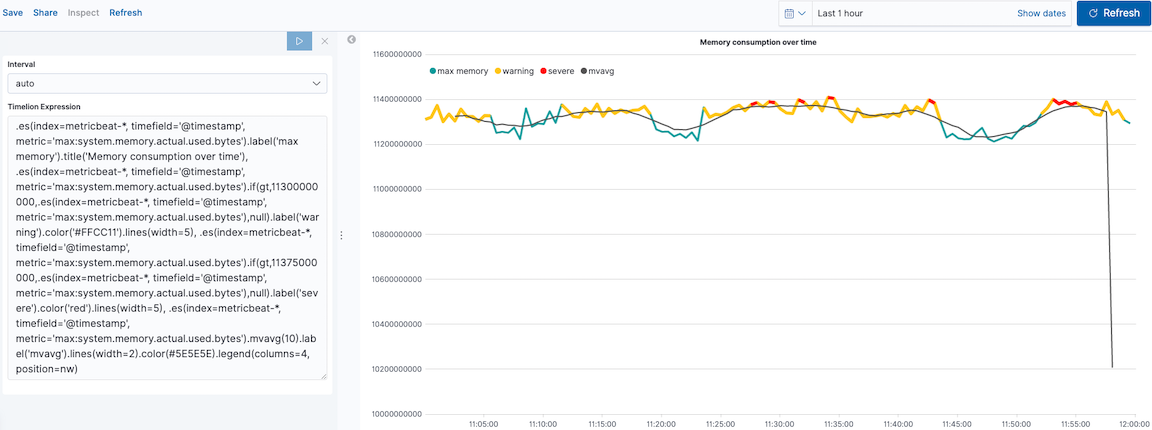
Customize and format the visualization
editCustomize and format the visualization using functions:
.es(index=metricbeat-*,
    timefield='@timestamp',
    metric='max:system.memory.actual.used.bytes')
  .label('max memory')
  .title('Memory consumption over time'),
.es(index=metricbeat-*,
    timefield='@timestamp',
    metric='max:system.memory.actual.used.bytes')
  .if(gt,
      11300000000,
      .es(index=metricbeat-*,
          timefield='@timestamp',
          metric='max:system.memory.actual.used.bytes'),
      null)
    .label('warning')
    .color('#FFCC11')
    .lines(width=5),
.es(index=metricbeat-*,
    timefield='@timestamp',
    metric='max:system.memory.actual.used.bytes')
  .if(gt,
      11375000000,
      .es(index=metricbeat-*,
          timefield='@timestamp',
          metric='max:system.memory.actual.used.bytes'),
      null)
    .label('severe')
    .color('red')
    .lines(width=5),
.es(index=metricbeat-*,
    timefield='@timestamp',
    metric='max:system.memory.actual.used.bytes')
  .mvavg(10)
  .label('mvavg')
  .lines(width=2)
  .color(#5E5E5E)
  .legend(columns=4, position=nw)
|
|
|
|
|
|
|
|
|
|
|
|
|
|
For additional information on Timelion conditional capabilities, go to I have but one .condition().