TSVB
editTSVB
editTSVB is a set of visualization types that you configure and display on dashboards.
With TSVB, you can:
- Combine an infinite number of aggregations to display your data.
- Annotate time series data with timestamped events from an Elasticsearch index.
- View the data in several types of visualizations, including charts, data tables, and markdown panels.
- Display multiple index patterns in each visualization.
- Use custom functions and some math on aggregations.
- Customize the data with labels and colors.
Open and set up TSVB
editOpen TSVB, then configure the required settings.
- On the dashboard, click All types, then select TSVB.
-
In TSVB, click Panel options, then specify the required Data settings.
-
From the Index pattern dropdown, select the index pattern you want to visualize.
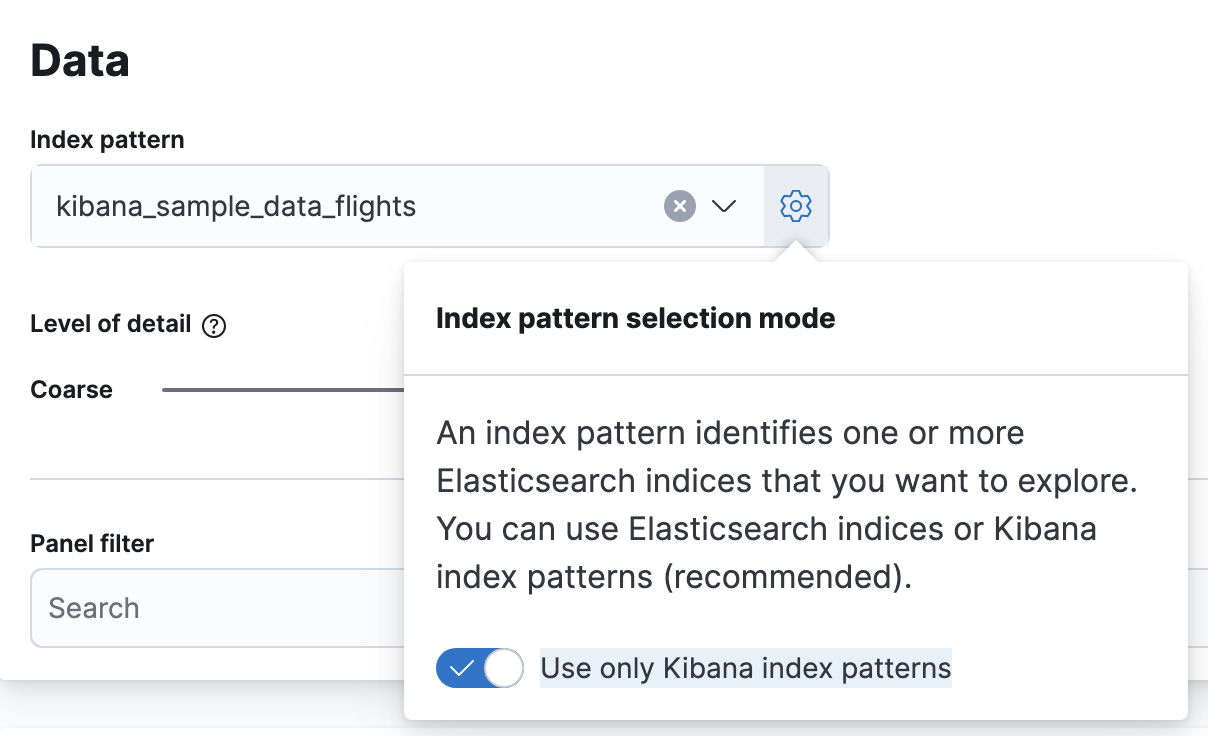
To visualize the data in an Elasticsearch index, open the Index pattern selection mode menu, deselect Use only Kibana index patterns, then enter the Elasticsearch index.
- From the Time field dropdown, select the field you want to visualize, then enter the field Interval.
-
Select a Drop last bucket option.
By default, TSVB drops the last bucket because the time filter intersects the time range of the last bucket. To view the partial data, select No.
- To view a filtered set of documents, enter KQL filters in the Panel filter field.
-
Index pattern mode
editCreate TSVB visualizations with Kibana index patterns.
Creating TSVB visualizations with an Elasticsearch index string is deprecated and will be removed in a future release. It is the default one for new visualizations but it can also be switched for the old implementations:
- Click Panel options, then click the gear icon to open the Index pattern selection mode options.
- Select Use only Kibana index patterns.
- Reselect the index pattern from the dropdown, then select the Time field.

The index pattern mode unlocks many new features, such as:
- Runtime fields
- URL drilldowns
- Interactive filters for time series visualizations
- Better performance
Configure the series
editEach TSVB visualization shares the same options to create a Series. Each series can be thought of as a separate Elasticsearch aggregation. For each series, the Options control the styling and Elasticsearch options, and are inherited from Panel options. When you have separate options for each series, you can compare different Elasticsearch indices, and view two time ranges from the same index.
To configure the value of each series, select the function, then configure the function inputs. Only the last function is displayed.
- From the Aggregation dropdown, select the function for the series.
-
To display each group separately, select one of the following options from the Group by dropdown:
- Filters — Groups the data into the specified filters. To differentiate the groups, assign a color to each filter.
- Terms — Displays the top values of the field. The color is only configurable in the Time Series chart. To configure, click Options, then select an option from the Split color theme dropdown.
- Click Options, then configure the inputs for the function.
TSVB visualization options
editThe configuration options differ for each TSVB visualization.
Time Series
editBy default, the y-axis displays the full range of data, including zero. To automatically scale the y-axis from
the minimum to maximum values of the data, click Data > Options > Fill, then enter 0 in the Fill field.
You can add annotations to the x-axis based on timestamped documents in a separate Elasticsearch index.
All chart types except Time Series
editThe Data timerange mode dropdown in Panel options controls the timespan that TSVB uses to match documents. Last value is unable to match all documents, only the specific interval. Entire timerange matches all documents specified in the time filter.
Metric, Top N, and Gauge
editColor rules in Panel options contains conditional coloring based on the values.
Top N and Table
editWhen you click a series, TSVB applies a filter based on the series name. To change this behavior, click Panel options, then specify a URL in the Item URL field, which opens a URL instead of applying a filter on click.
Markdown
editThe Markdown visualization supports Markdown with Handlebar (mustache) syntax to insert dynamic data, and supports custom CSS using the LESS syntax.
TSVB function reference
editTSVB provides you with shortcuts for some frequently-used functions.
- Filter Ratio
- Returns a percent value by calculating a metric on two sets of documents. For example, calculate the error rate as a percentage of the overall events over time.
- Counter Rate
- Used when dealing with monotonically increasing counters. Shortcut for Max, Derivative, and Positive Only.
- Positive Only
- Removes any negative values from the results, which can be used as a post-processing step after a derivative.
- Series Agg
- Applies a function to all of the Group by series to reduce the values to a single number. This function must always be the last metric in the series. For example, if the Time Series visualization shows 10 series, the sum Series Agg calculates the sum of all 10 bars and output a single Y value per X value. This is often confused with the overall sum function, which outputs a single Y value per unique series.
- Math
- The math context is able to do simple and advanced calculations per series. This function must always be the last metric in the series.
Frequently asked questions
editFor answers to frequently asked TSVB question, review the following.
How do I create dashboard drilldowns for Top N and Table visualizations?
editYou can create dashboard drilldowns that include the specified time range for Top N and Table visualizations.
- Open the dashboard that you want to link to, then copy the URL.
- Open the dashboard with the Top N and Table visualization panel, then click Edit in the toolbar.
- Open the Top N or Table panel menu, then select Edit visualization.
- Click Panel options.
-
In the Item URL field, enter the URL.
For example
dashboards#/view/f193ca90-c9f4-11eb-b038-dd3270053a27. - Click Save and return.
- In the toolbar, cick Save as, then make sure Store time with dashboard is deselected.
Why is my TSVB visualization missing data?
editIt depends, but most often there are two causes:
- For Time series visualizations with a derivative function, the time interval can be too small. Derivatives require sequential values.
- For all other TSVB visualizations, the cause is probably the Data timerange mode, which is controlled by Panel options > Data timerange mode > Entire time range. By default, TSVB displays the last whole bucket. For example, if the time filter is set to Last 24 hours, and the current time is 9:41, TSVB displays only the last 10 minutes — from 9:30 to 9:40.
How do I calculate the difference between two data series?
editPerforming math across data series is unsupported in TSVB. To calculate the difference between two data series, use Timelion or Vega.
How do I compare the current versus previous month?
editTSVB can display two series with time offsets, but it can’t perform math across series. To add a time offset:
-
Click Clone Series, then choose a color for the new series.

- Click Options, then enter the offset value in the Offset series time by field.
How do I calculate a month over month change?
editThe ability to calculate a month over month change is not fully supported in TSVB, but there is a special case that is supported if the
time filter is set to 3 months or more and the Interval is 1m. Use the Derivative to get the absolute monthly change. To convert to a percent,
add the Math function with the params.current / (params.current - params.derivative) formula, then select Percent from the Data Formatter dropdown.
For other types of month over month calculations, use Timelion or Vega.
How do I calculate the duration between the start and end of an event?
editCalculating the duration between the start and end of an event is unsupported in TSVB because TSVB requires correlation between different time periods. TSVB requires that the duration is pre-calculated.
How do I group on multiple fields?
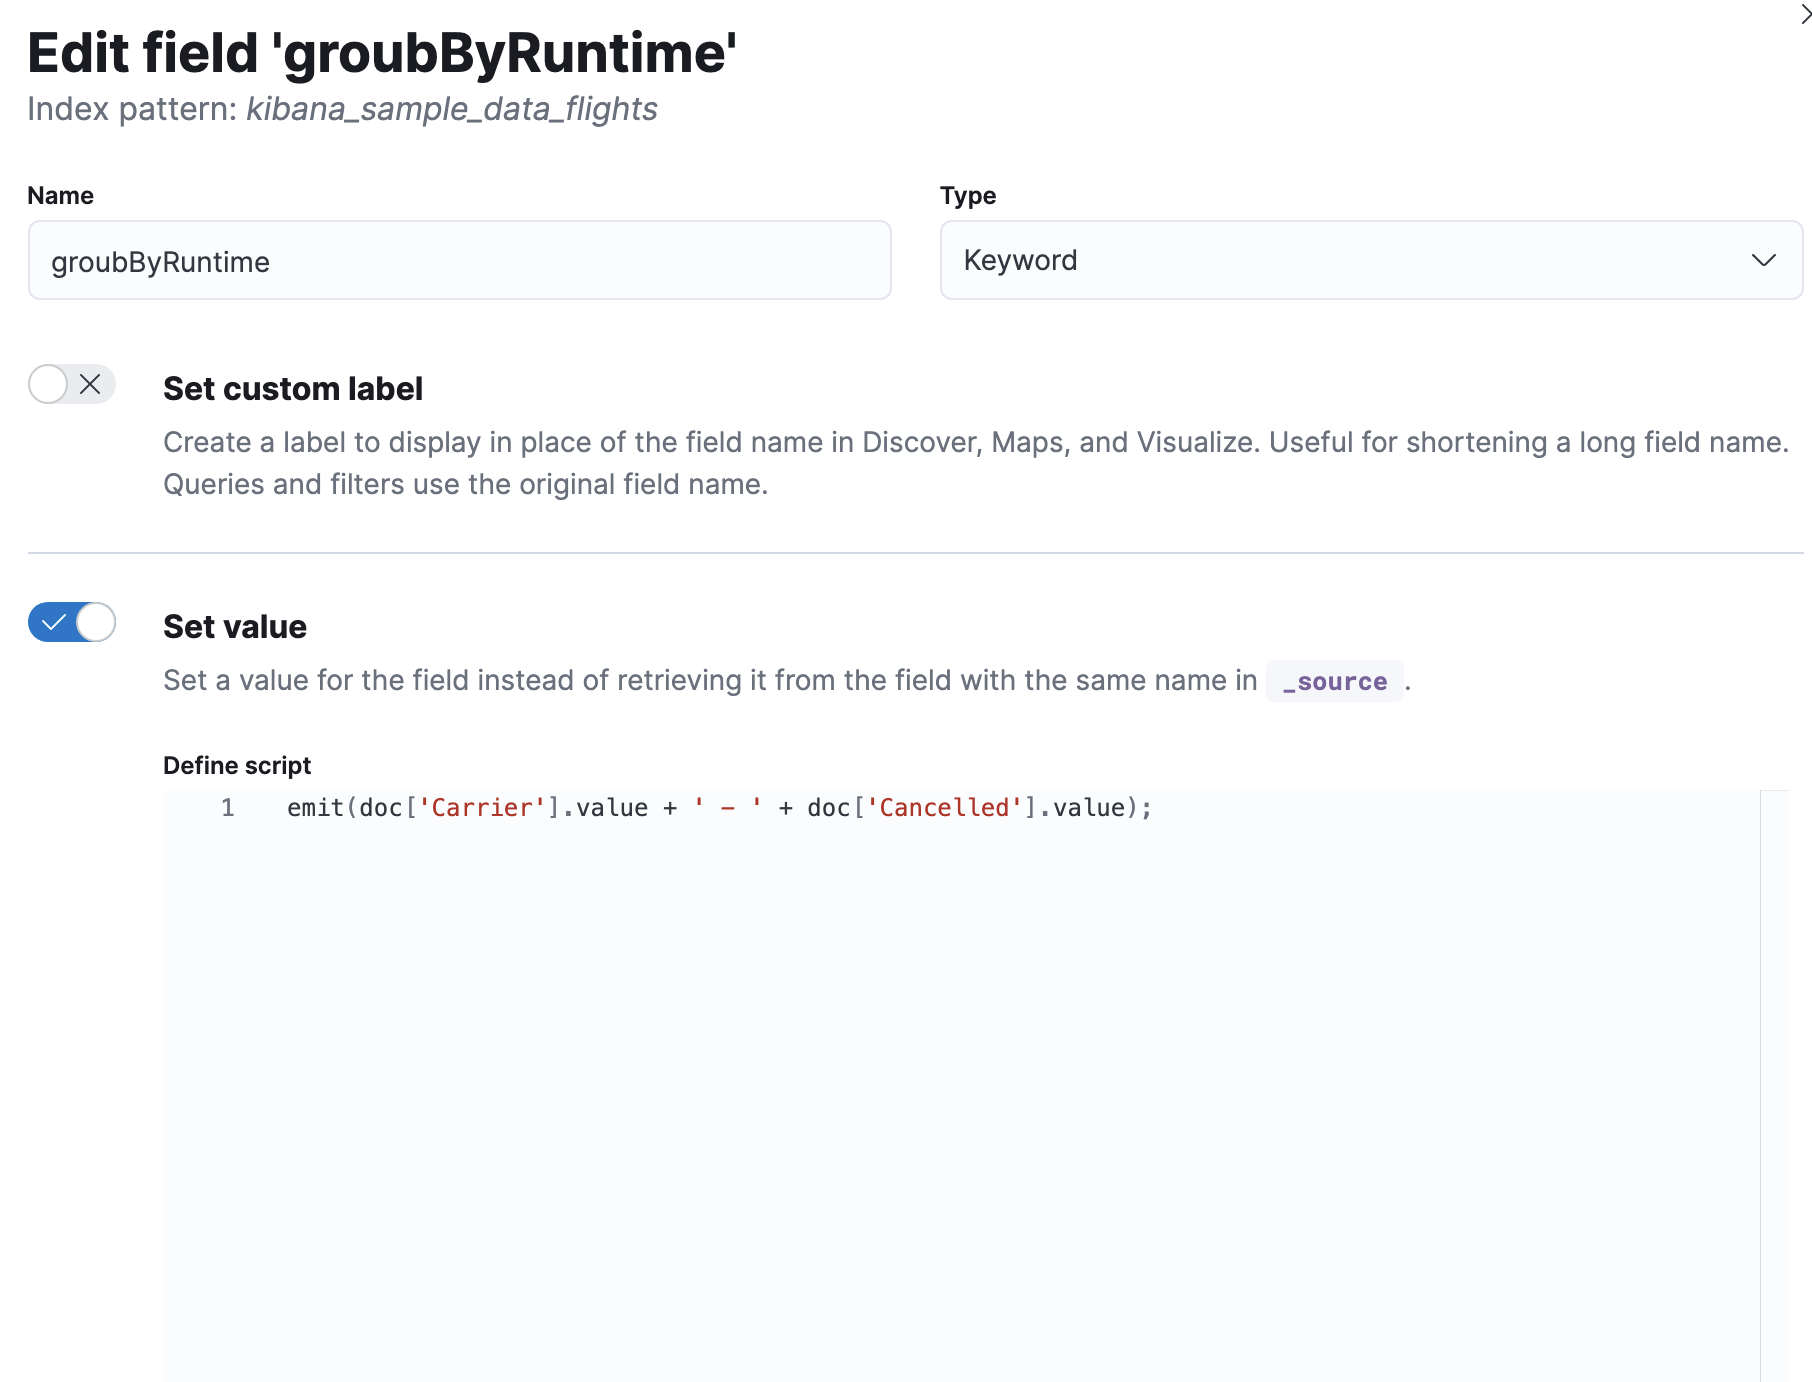
editTo group with multiple fields, create runtime fields in the index pattern you are visualizing.
-
Create a runtime field. Refer to Manage index patterns data fields for more information.

- Create a TSVB visualization and group by this field.