What’s new in 8.0
editWhat’s new in 8.0
editHere are the highlights of what’s new and improved in 8.0. For detailed information about this release, check the release notes.
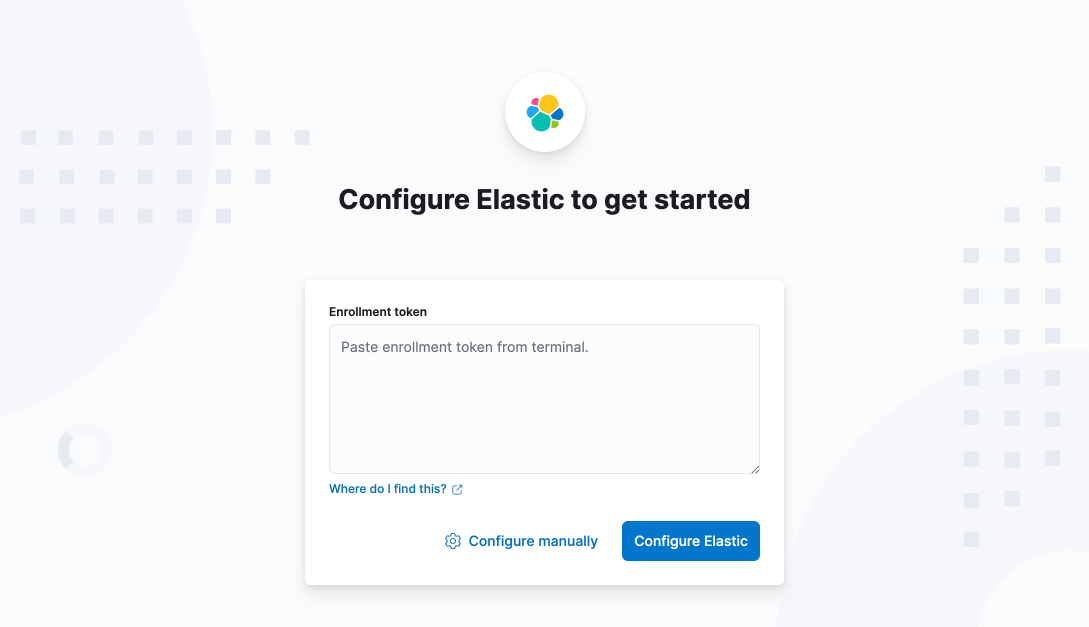
Security features enabled by default
editAuthentication, authorization, and multi-tenancy with Kibana Spaces are on-by-default, with almost no configuration effort. When you use Kibana for the first time, you’re presented with a new interactive UI that helps you securely set up and connect Kibana to Elasticsearch. Simply paste the enrollment token that you receive when you start Elasticsearch, and Kibana sets up all the security features and connects to Elasticsearch over TLS. Read the blog for full details.
Index patterns are now data views
editRenaming index patterns to data views creates the foundation for building new and exciting features in Kibana. Your data views work exactly as index patterns did in previous releases.
Vector tiles and basemap updated
editElastic offers full vector tile support, now generally available, in Kibana Maps. Enjoy faster performance and smooth navigation of your data at scale. Read more about this feature.
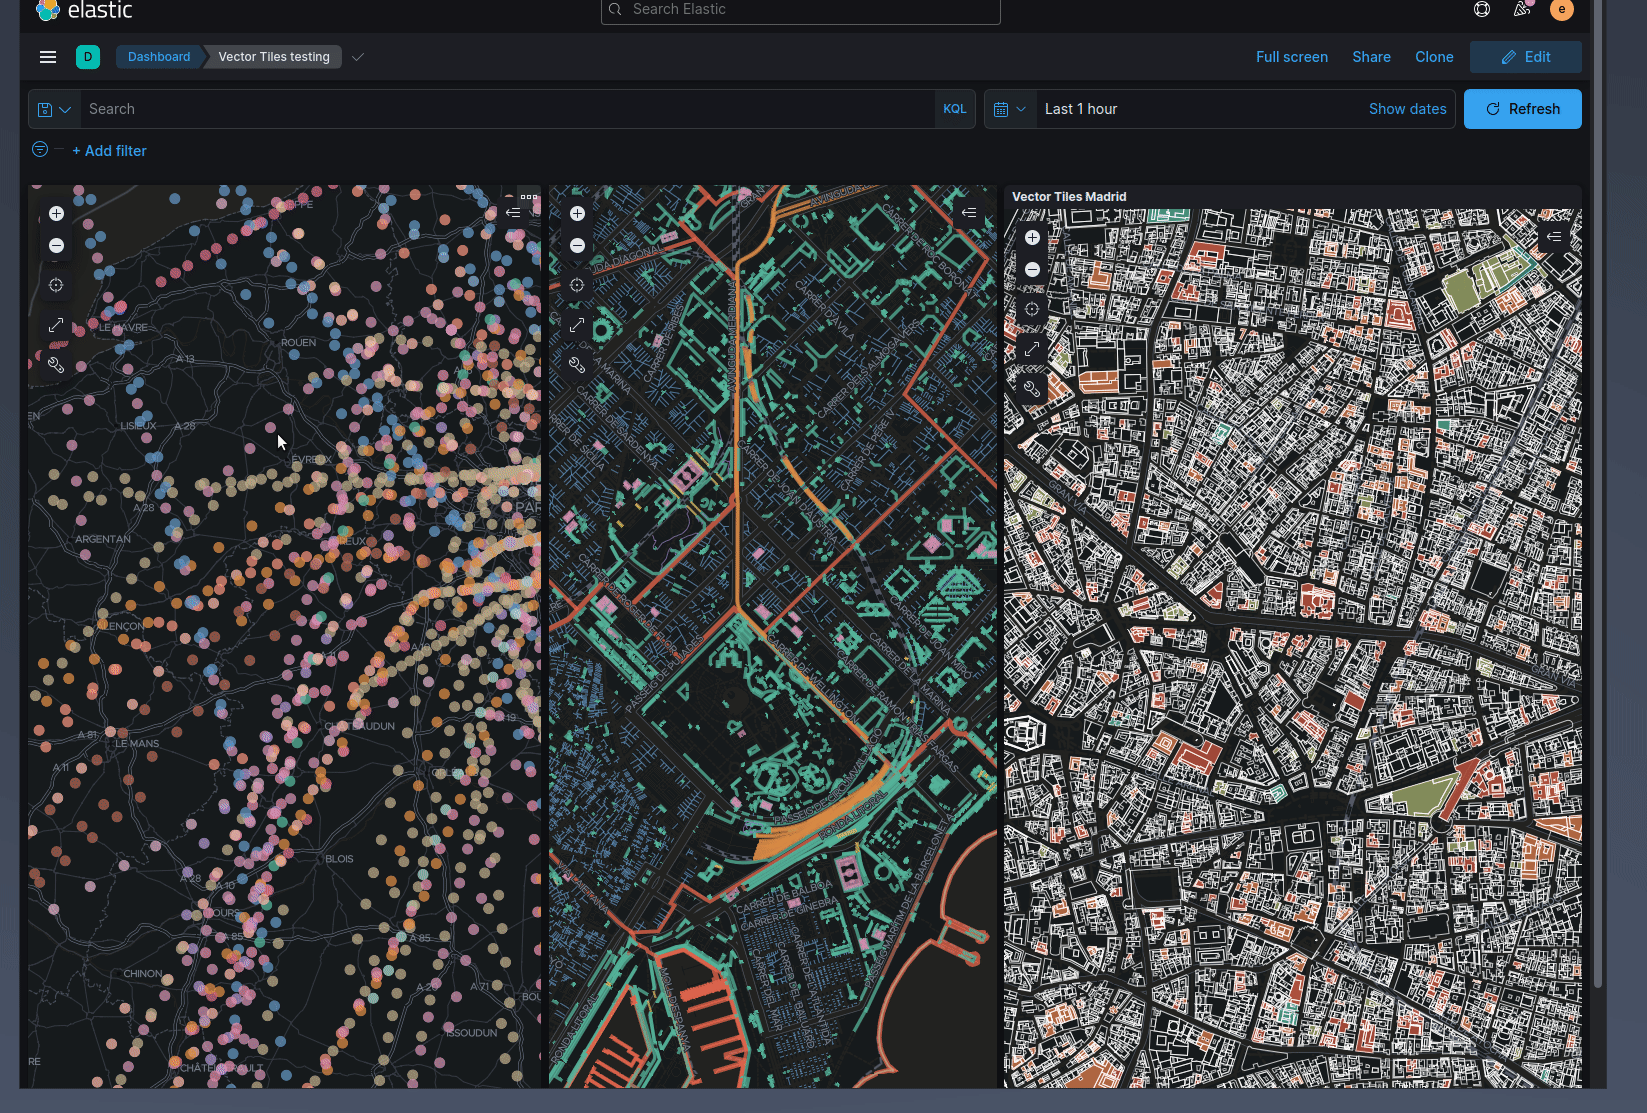
The default basemaps in light and dark themes now use the more understated desaturated basemap. This gives your data the most visual attention.
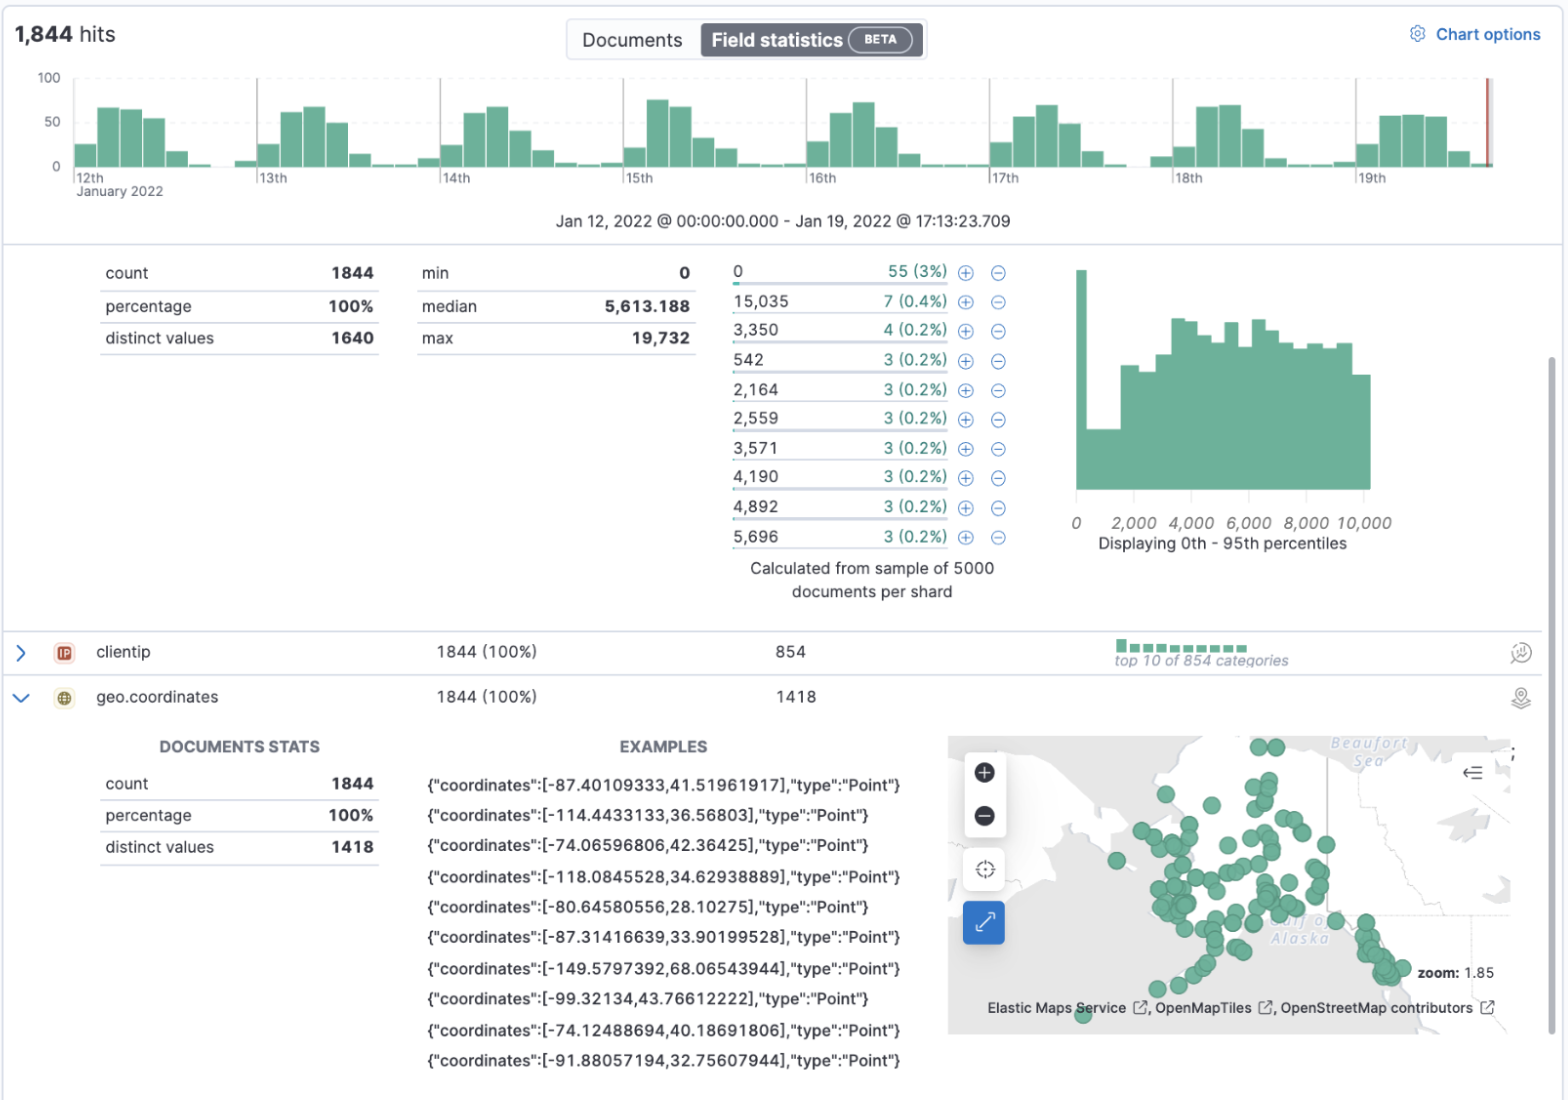
Discover has field statistics (beta)
editEnable the new Field statistics view for a summary of all fields (or just selected fields) in your data. You’ll find interesting fields to visualize and learn more about the shape of your data. The Field statistics view is similar to the Index Data Visualizer in Machine Learning.
Multi-layered time axis redesigned
editTo solve key readability and formatting issues, the time axis was upgraded in Lens, TSVB, aggregation-based visualizations, and Discover. The multi-layered format enables you to create easier to understand visualizations from your data.
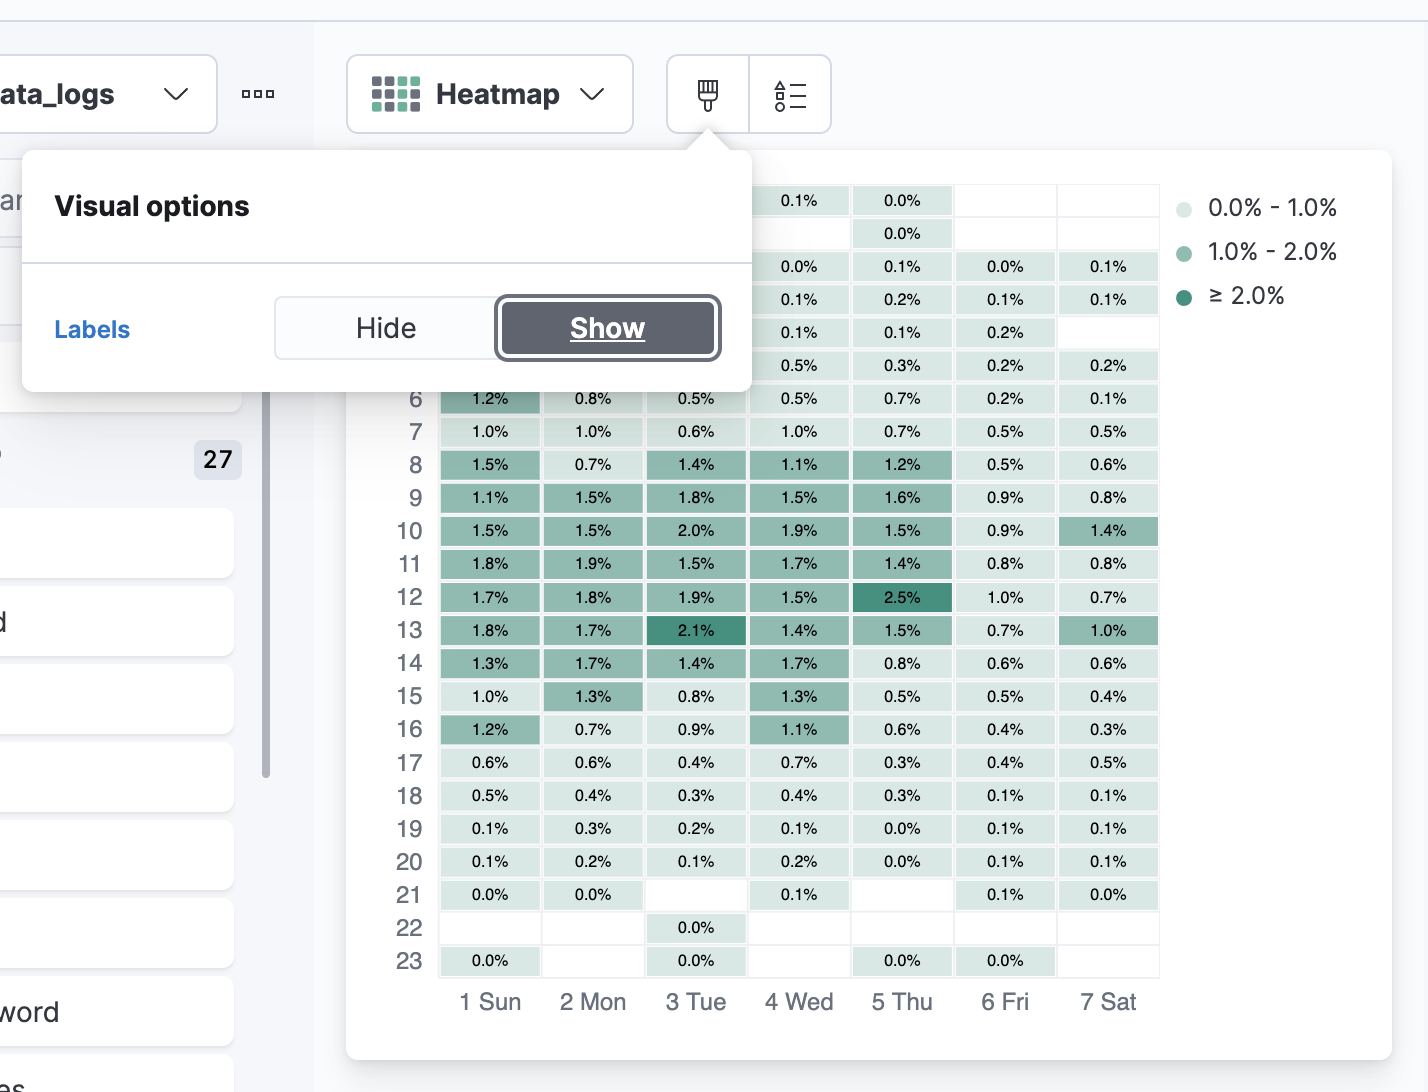
Heatmaps display data labels
editEnable Show on labels, and when there’s room, a data label appears in each heatmap cell.
Canvas editing toolbar renovated
editThis new design brings a set of editing controls in Canvas, similar to what you see in Dashboard. Use the toolbar to quickly access the Visualization Library and create elements and visualizations.
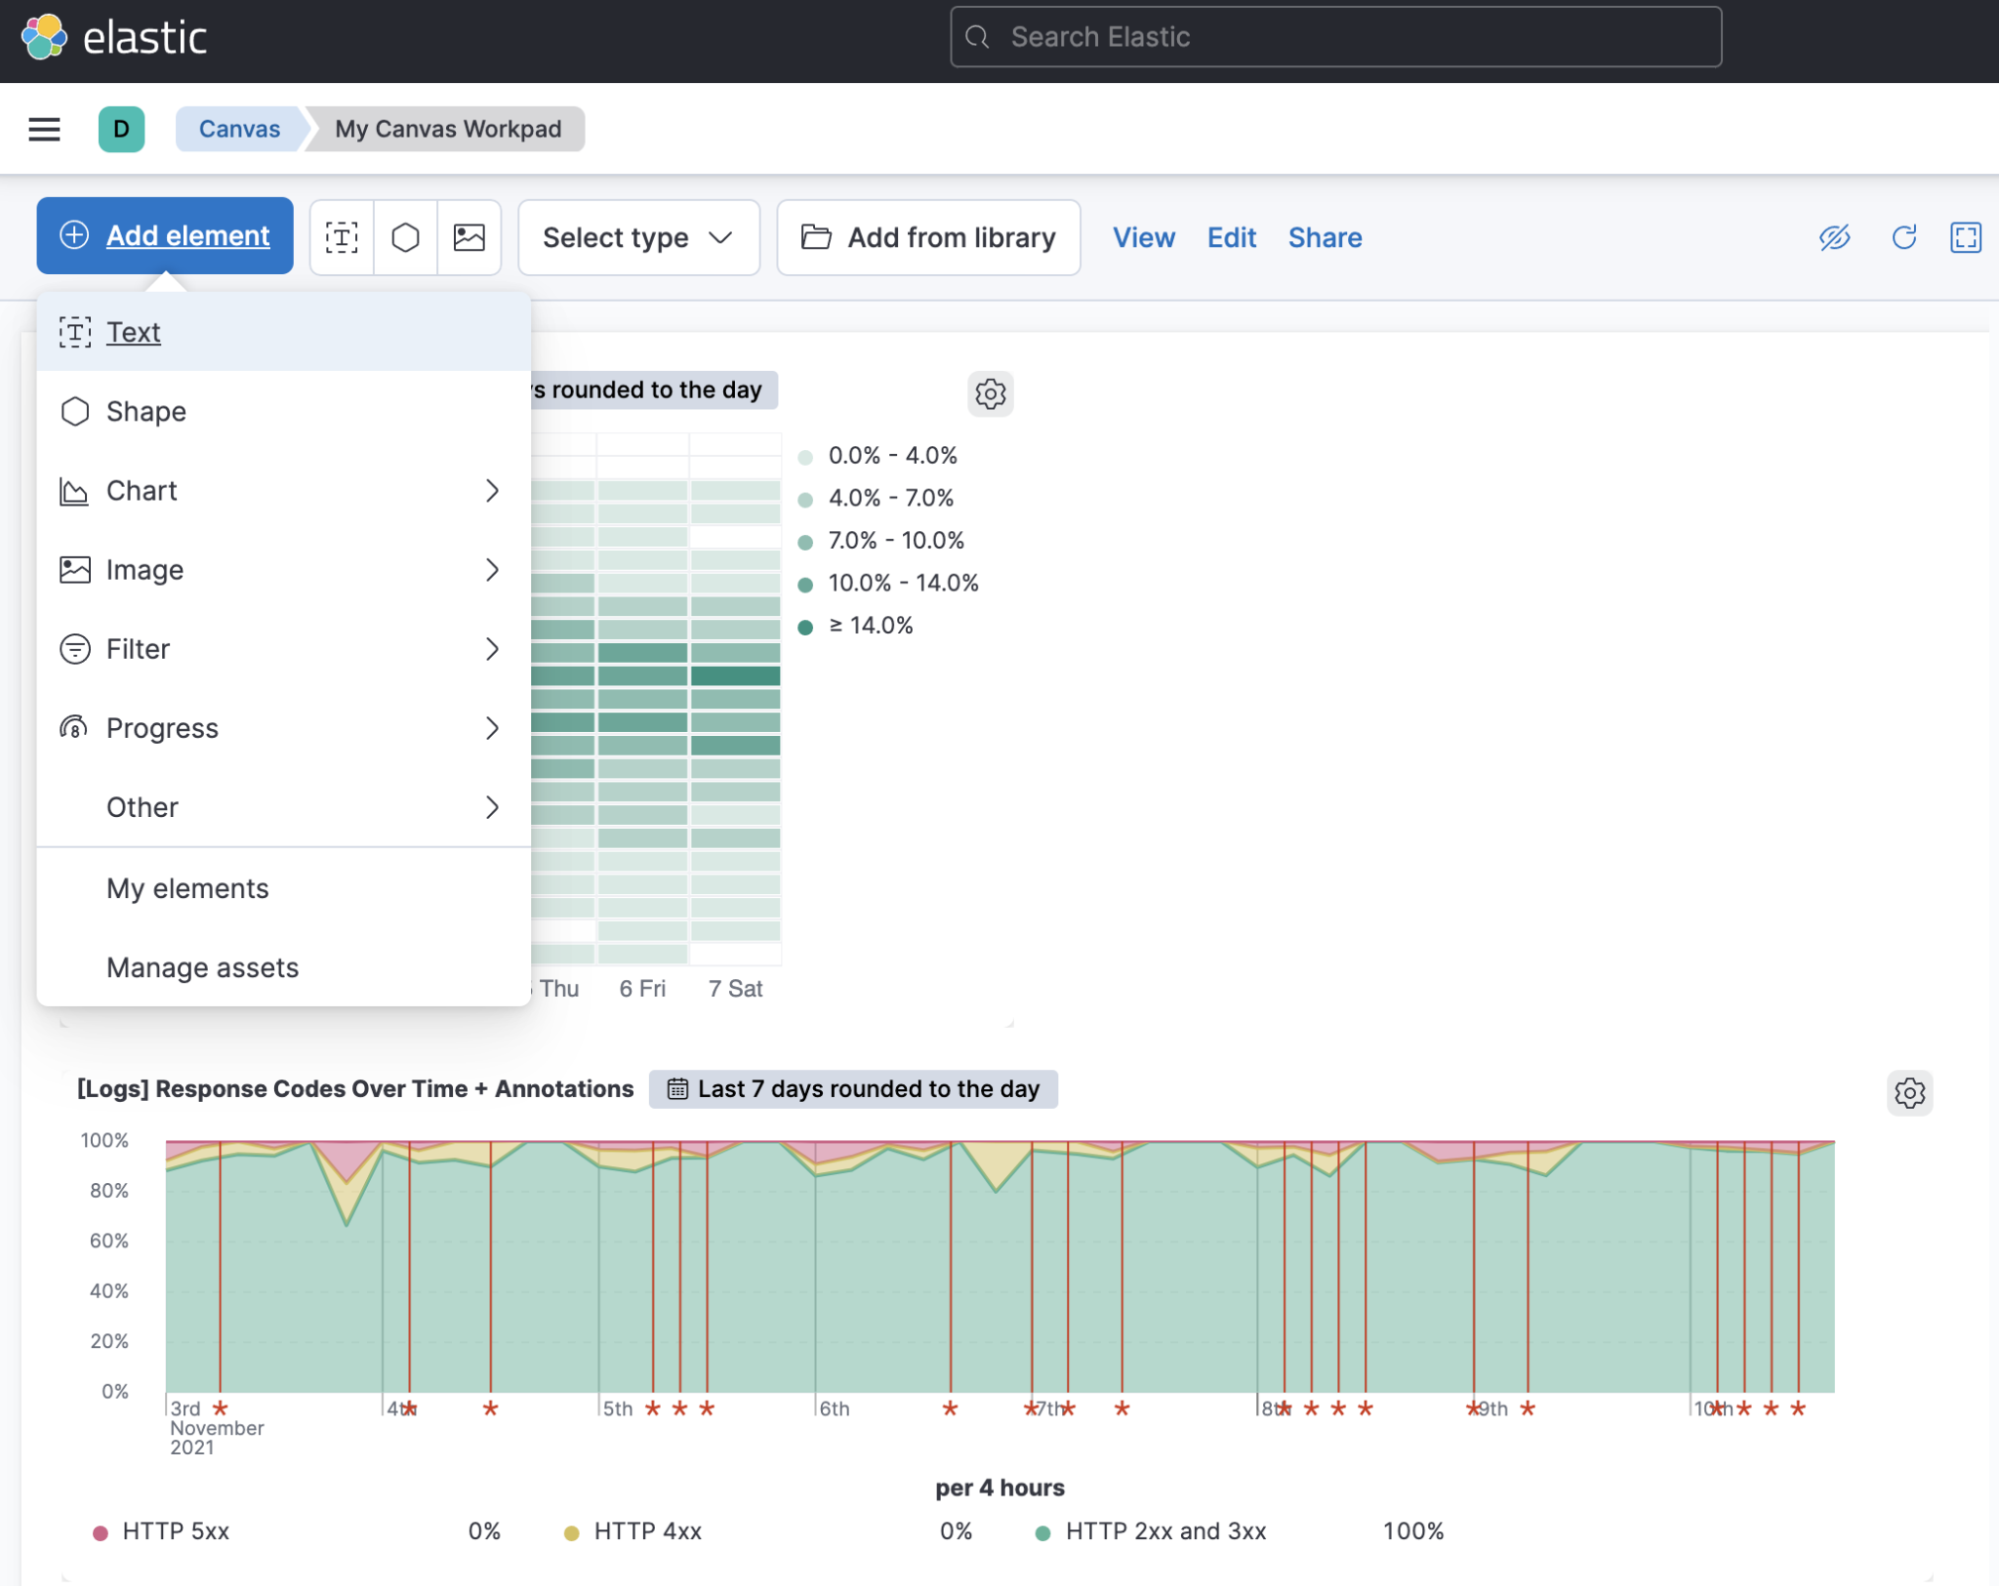
You can also now create embedded visualizations in your Canvas workpads. Just like in Dashboard, you can promote favorites to the Visualization Library for re-use.
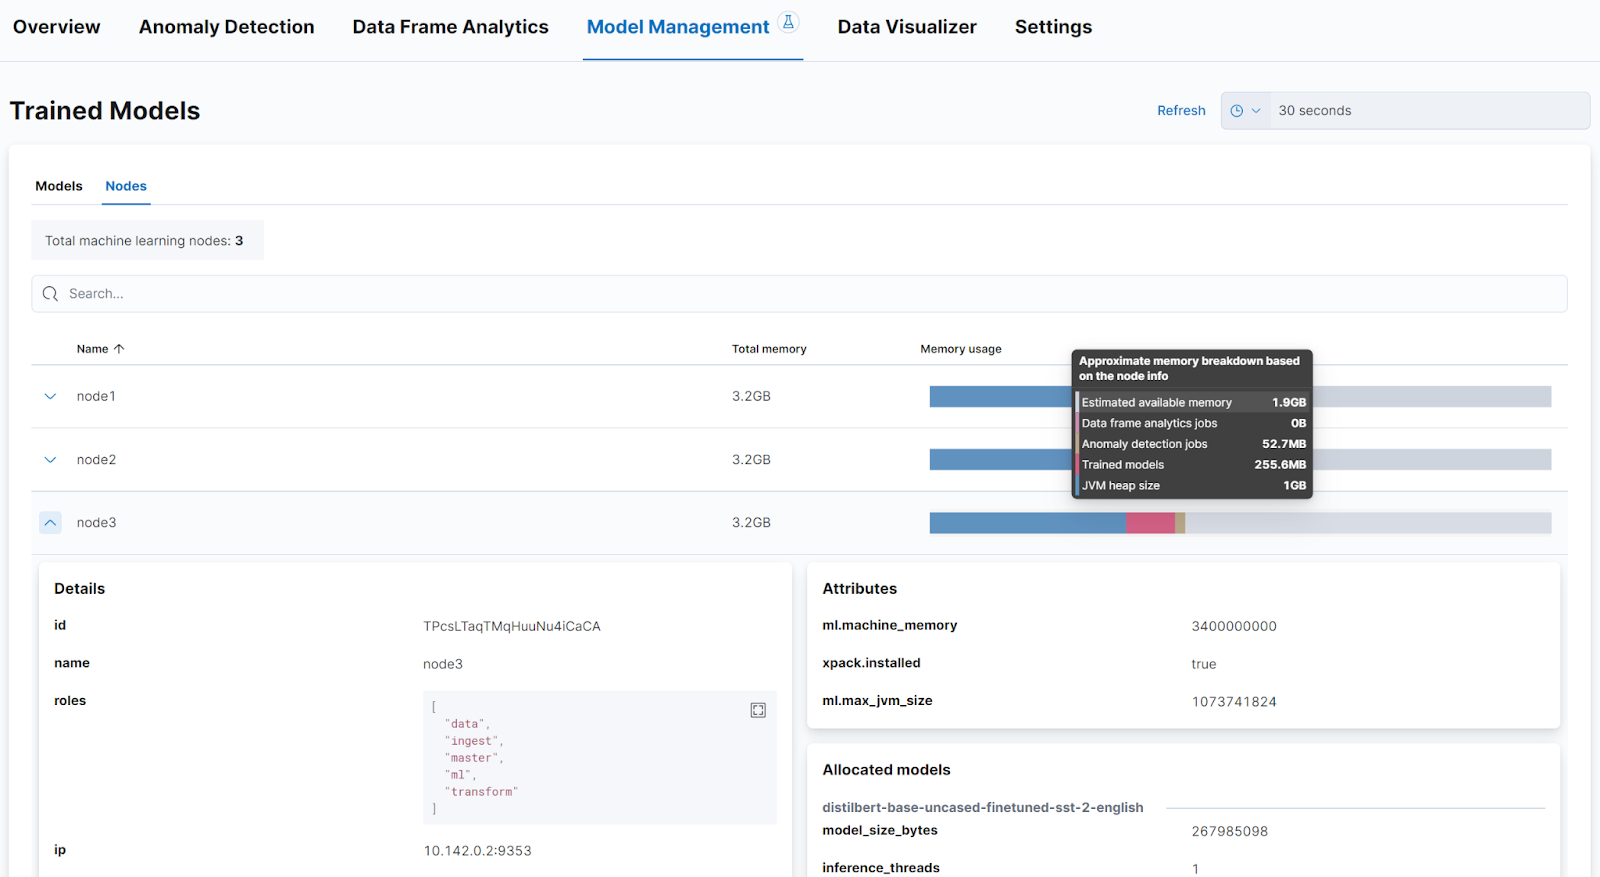
Machine learning model management
editYou can now add more trained models to bring modern natural language processing (NLP) use cases to the Elastic Stack. NLP models exist alongside data frame analytics models. The Model Management page shows approximations for memory usage on each machine learning node and displays high level stats for inference rates for each deployed trained model. These details enable you to make node sizing decisions for machine learning nodes.