IMPORTANT: No additional bug fixes or documentation updates
will be released for this version. For the latest information, see the
current release documentation.
Field statistics
edit
IMPORTANT: This documentation is no longer updated. Refer to Elastic's version policy and the latest documentation.
Field statistics
editField statistics panels allow you to display a table with additional field information in your dashboards, such as document count, values, and distribution.
- From your dashboard, select Add panel.
-
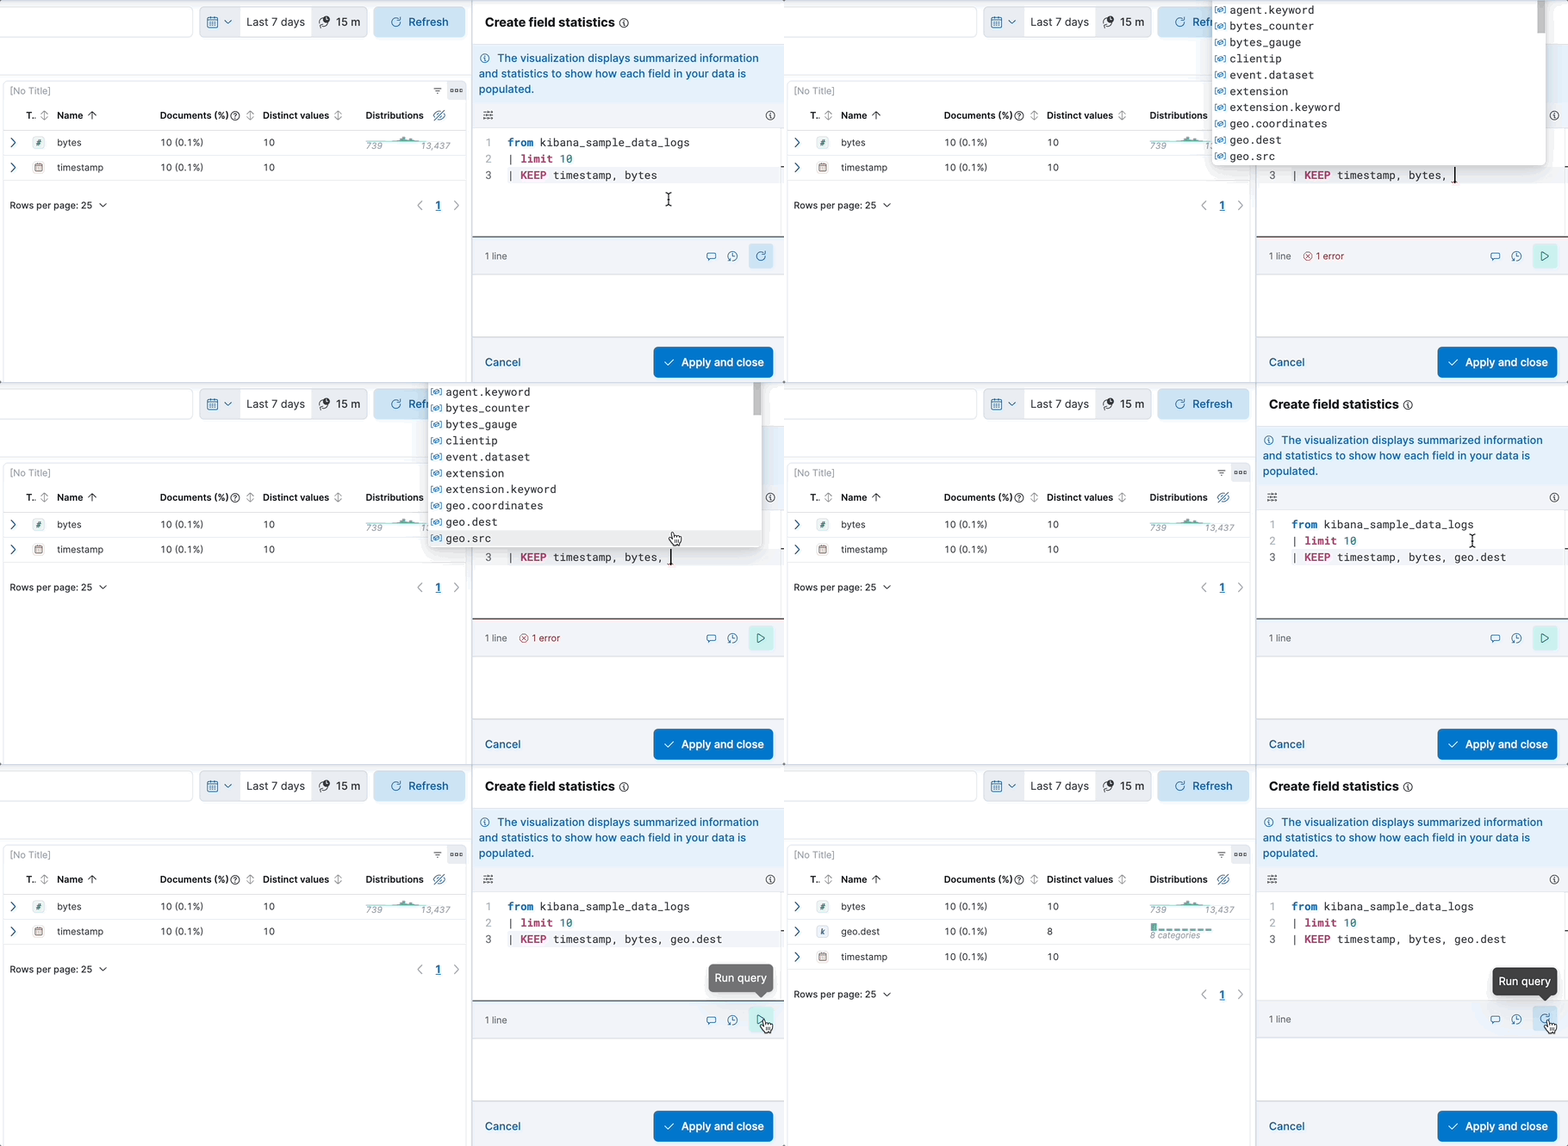
Choose Field statistics under Visualizations. An ES|QL editor appears and lets you configure your query with the fields and information that you want to show.
Check the ES|QL reference to get familiar with the syntax and optimize your query.
-
When editing your query or its configuration, run the query to update the preview of the visualization.

- Select Apply and close to save the visualization to the dashboard.