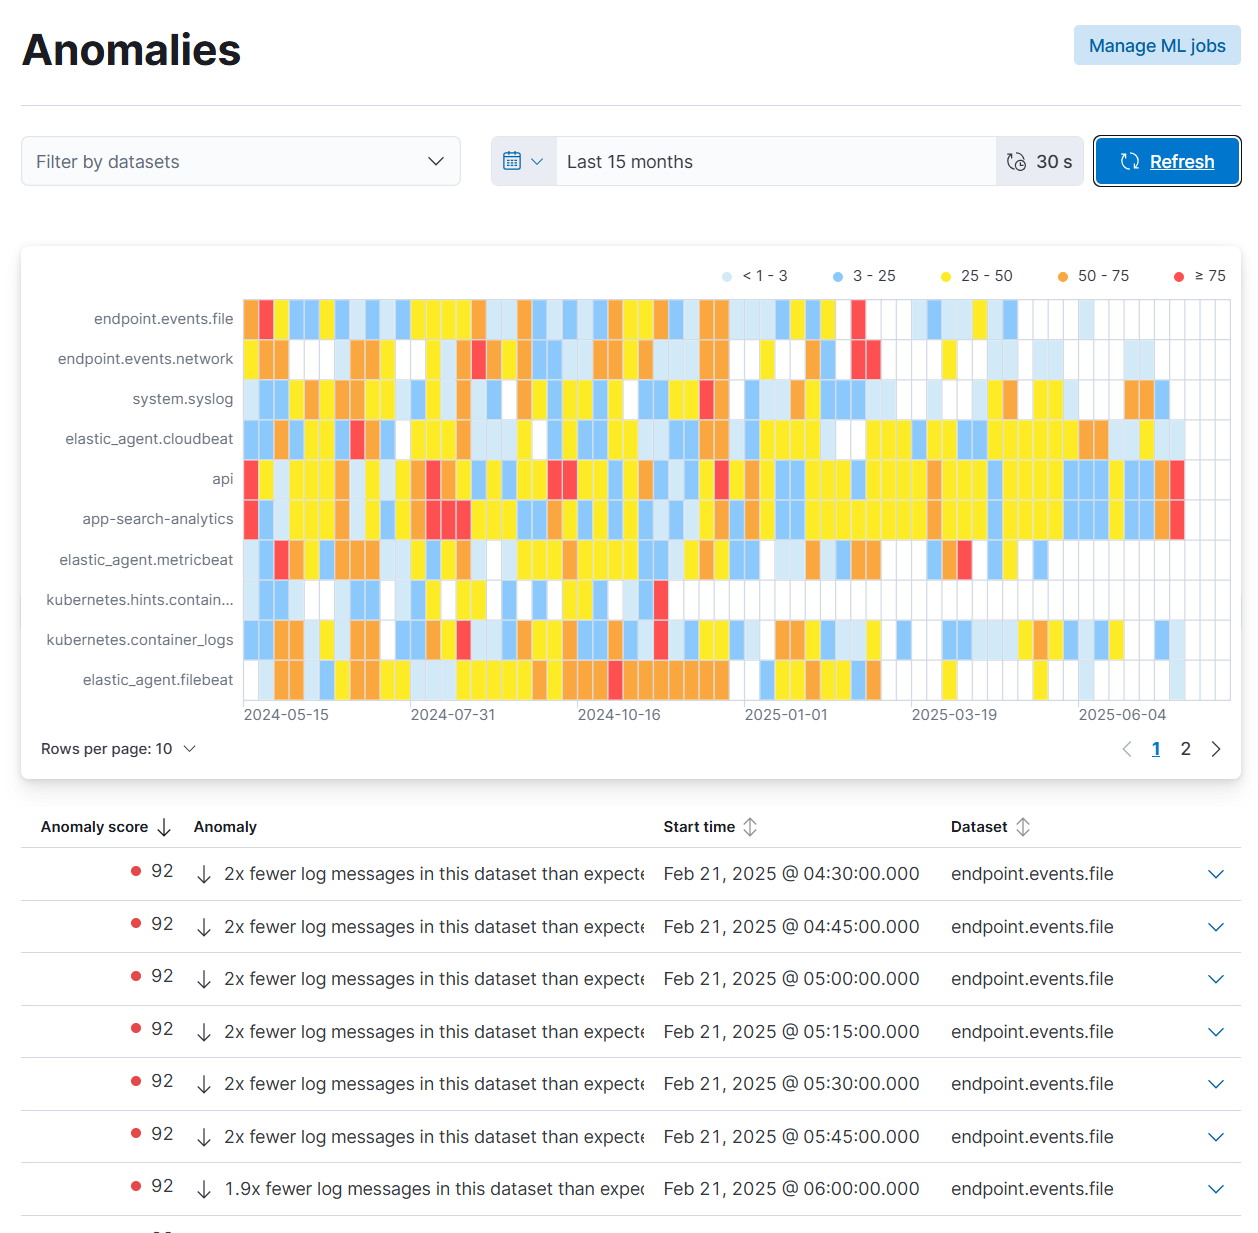
Inspect log anomalies
When the anomaly detection features of machine learning are enabled, you can use the Logs Anomalies page to detect and inspect log anomalies and the log partitions where the log anomalies occur. This means you can easily see anomalous behavior without significant human intervention — no more manually sampling log data, calculating rates, and determining if rates are expected.
Anomalies automatically highlight periods where the log rate is outside expected bounds and therefore may be anomalous. For example:
- A significant drop in the log rate might suggest that a piece of infrastructure stopped responding, and thus we’re serving fewer requests.
- A spike in the log rate could denote a DDoS attack. This may lead to an investigation of IP addresses from incoming requests.
You can also view log anomalies directly in the Machine Learning app.
This feature makes use of machine learning anomaly detection jobs. To set up jobs, you must have all Kibana feature privileges for Machine Learning. Users that have full or read-only access to machine learning features within a Kibana space can view the results of all anomaly detection jobs that are visible in that space, even if they do not have access to the source indices of those jobs. You must carefully consider who is given access to machine learning features; anomaly detection job results may propagate field values that contain sensitive information from the source indices to the results. For more details, refer to Set up machine learning features.
Create a machine learning job to detect anomalous log entry rates automatically.
- From the navigation menu, go to Other tools → Logs Anomalies, or find
Logs anomaliesin the global search field. From here, you’ll be prompted to create a machine learning job which will carry out the log rate analysis. - Choose a time range for the machine learning analysis.
- Add the indices that contain the logs you want to examine. By default, Machine Learning analyzes messages in all log indices that match the patterns set in the logs source advanced setting. To open Advanced settings, find it in the navigation menu or by using the global search field.
- Click Create ML job. This creates and runs the job. It takes a few minutes for the machine learning robots to collect the necessary data. After the job has processed the data, you can view its results.
Log anomaly machine learning jobs retain results for 120 days by default. Modify the results_retention_days setting to change this period.
The Anomalies chart shows an overall, color-coded visualization of the log entry rate, partitioned according to the value of the Elastic Common Schema (ECS) event.dataset field. This chart helps you quickly spot increases or decreases in each partition’s log rate.
If you have a lot of log partitions, use the following to filter your data:
- Hover over a time range to see the log rate for each partition.
- Click or hover on a partition name to show, hide, or highlight the partition values.

The chart shows the time range where anomalies were detected. The typical rate values are shown in gray, while the anomalous regions are color-coded and superimposed on top.
When a time range is flagged as anomalous, the machine learning algorithms have detected unusual log rate activity. This might be because:
- The log rate is significantly higher than usual.
- The log rate is significantly lower than usual.
- Other anomalous behavior has been detected. For example, the log rate is within bounds, but not fluctuating when it is expected to.
The level of anomaly detected in a time period is color-coded, from red, orange, yellow, to blue. Red indicates a critical anomaly level, while blue is a warning level.
To help you further drill down into a potential anomaly, you can view an anomaly chart for each partition. Anomaly scores range from 0 (no anomalies) to 100 (critical).
To analyze the anomalies in more detail, click View anomaly in machine learning, which opens the Anomaly Explorer in Machine Learning.