Synthetic monitoring via the Uptime app
editSynthetic monitoring via the Uptime app
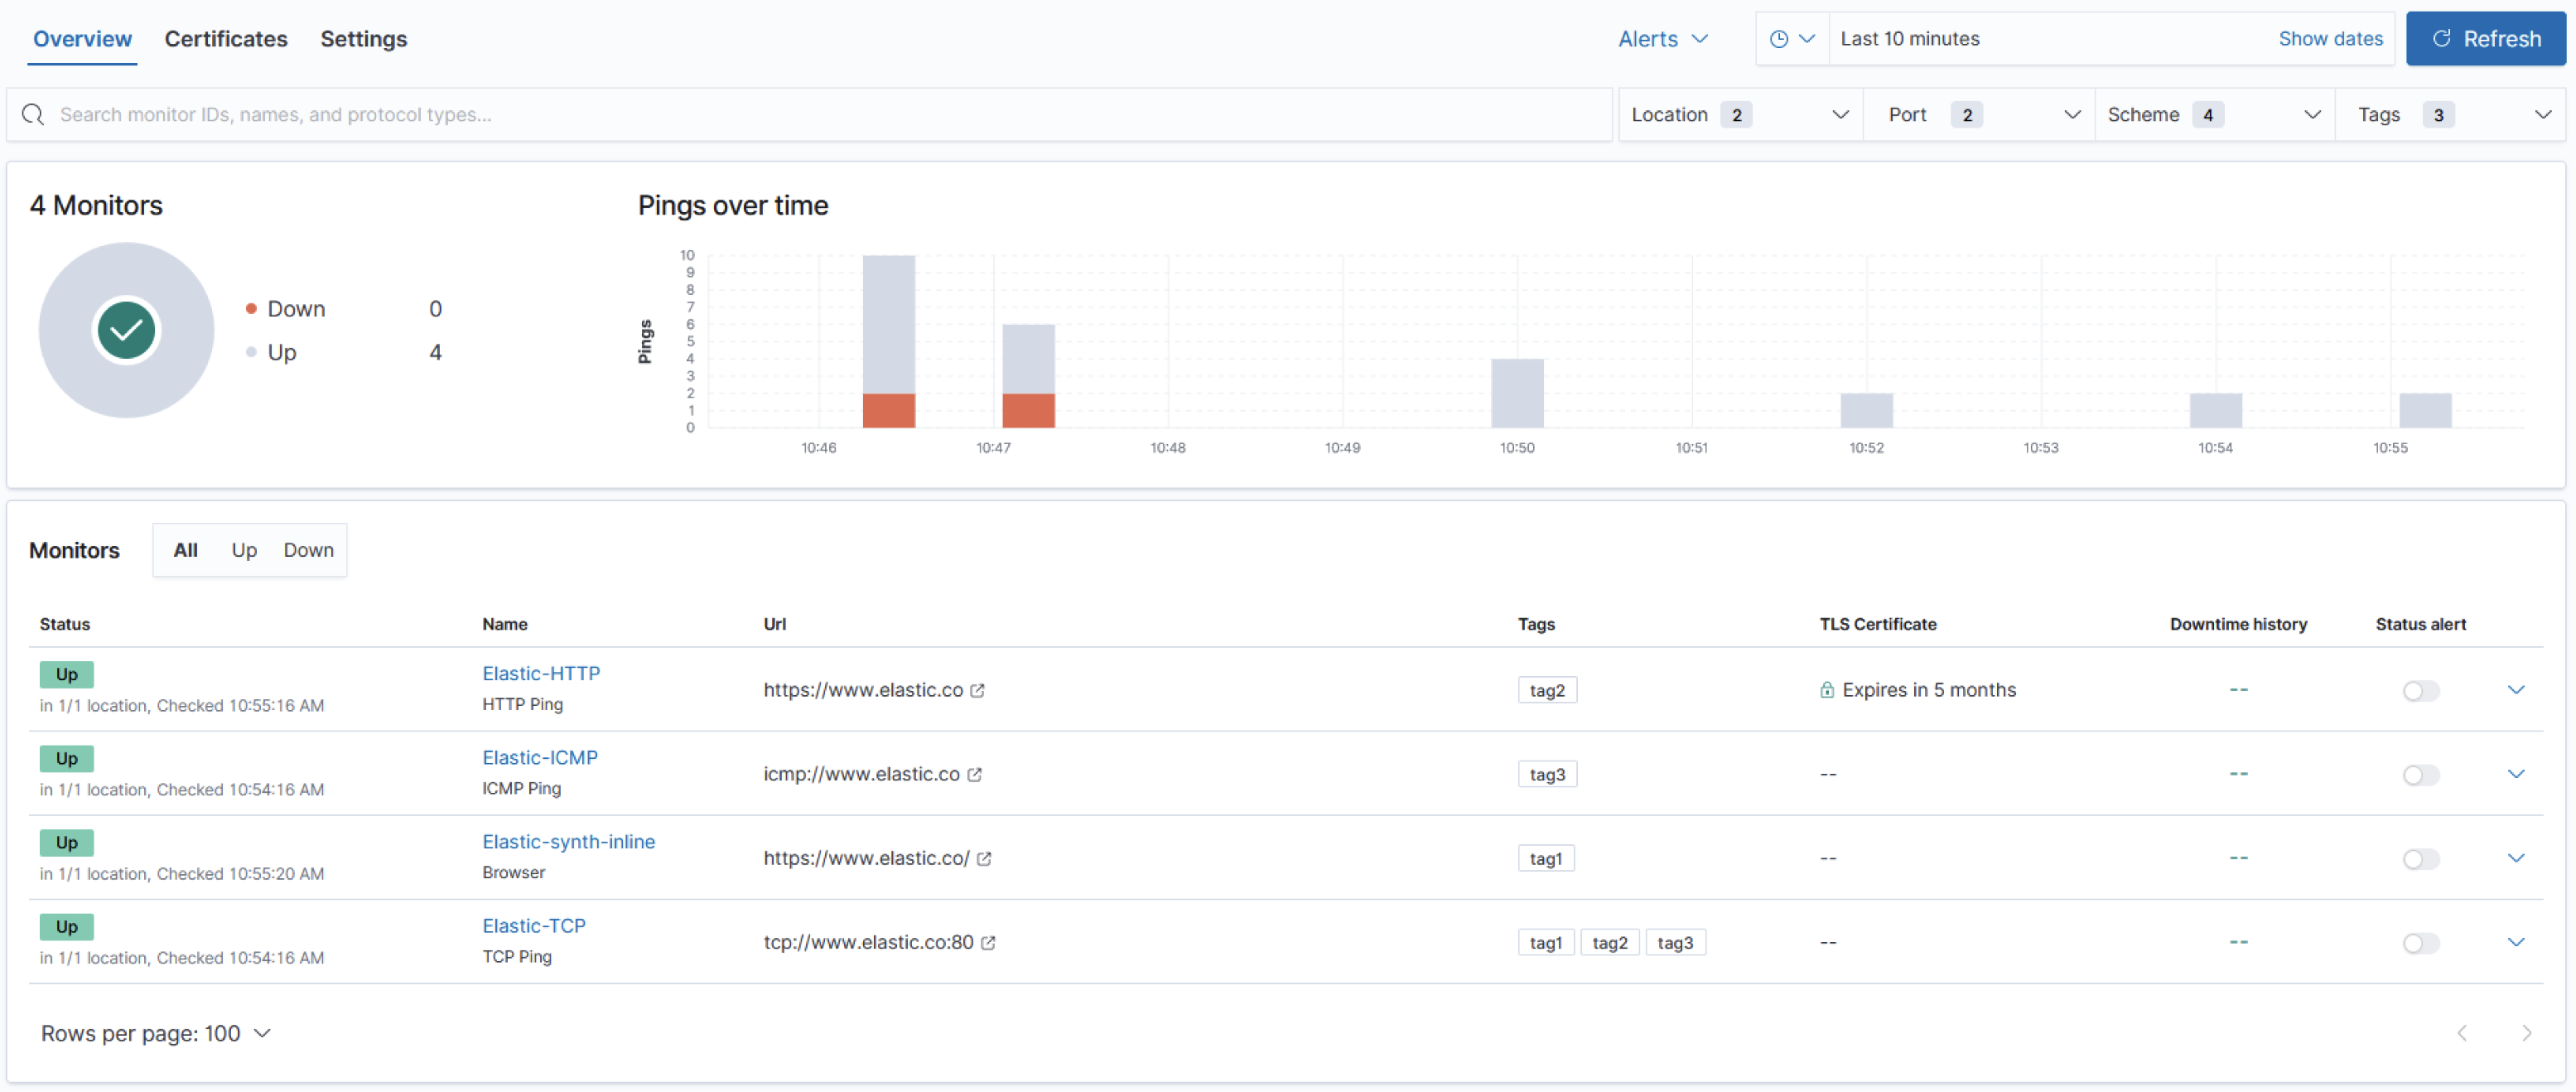
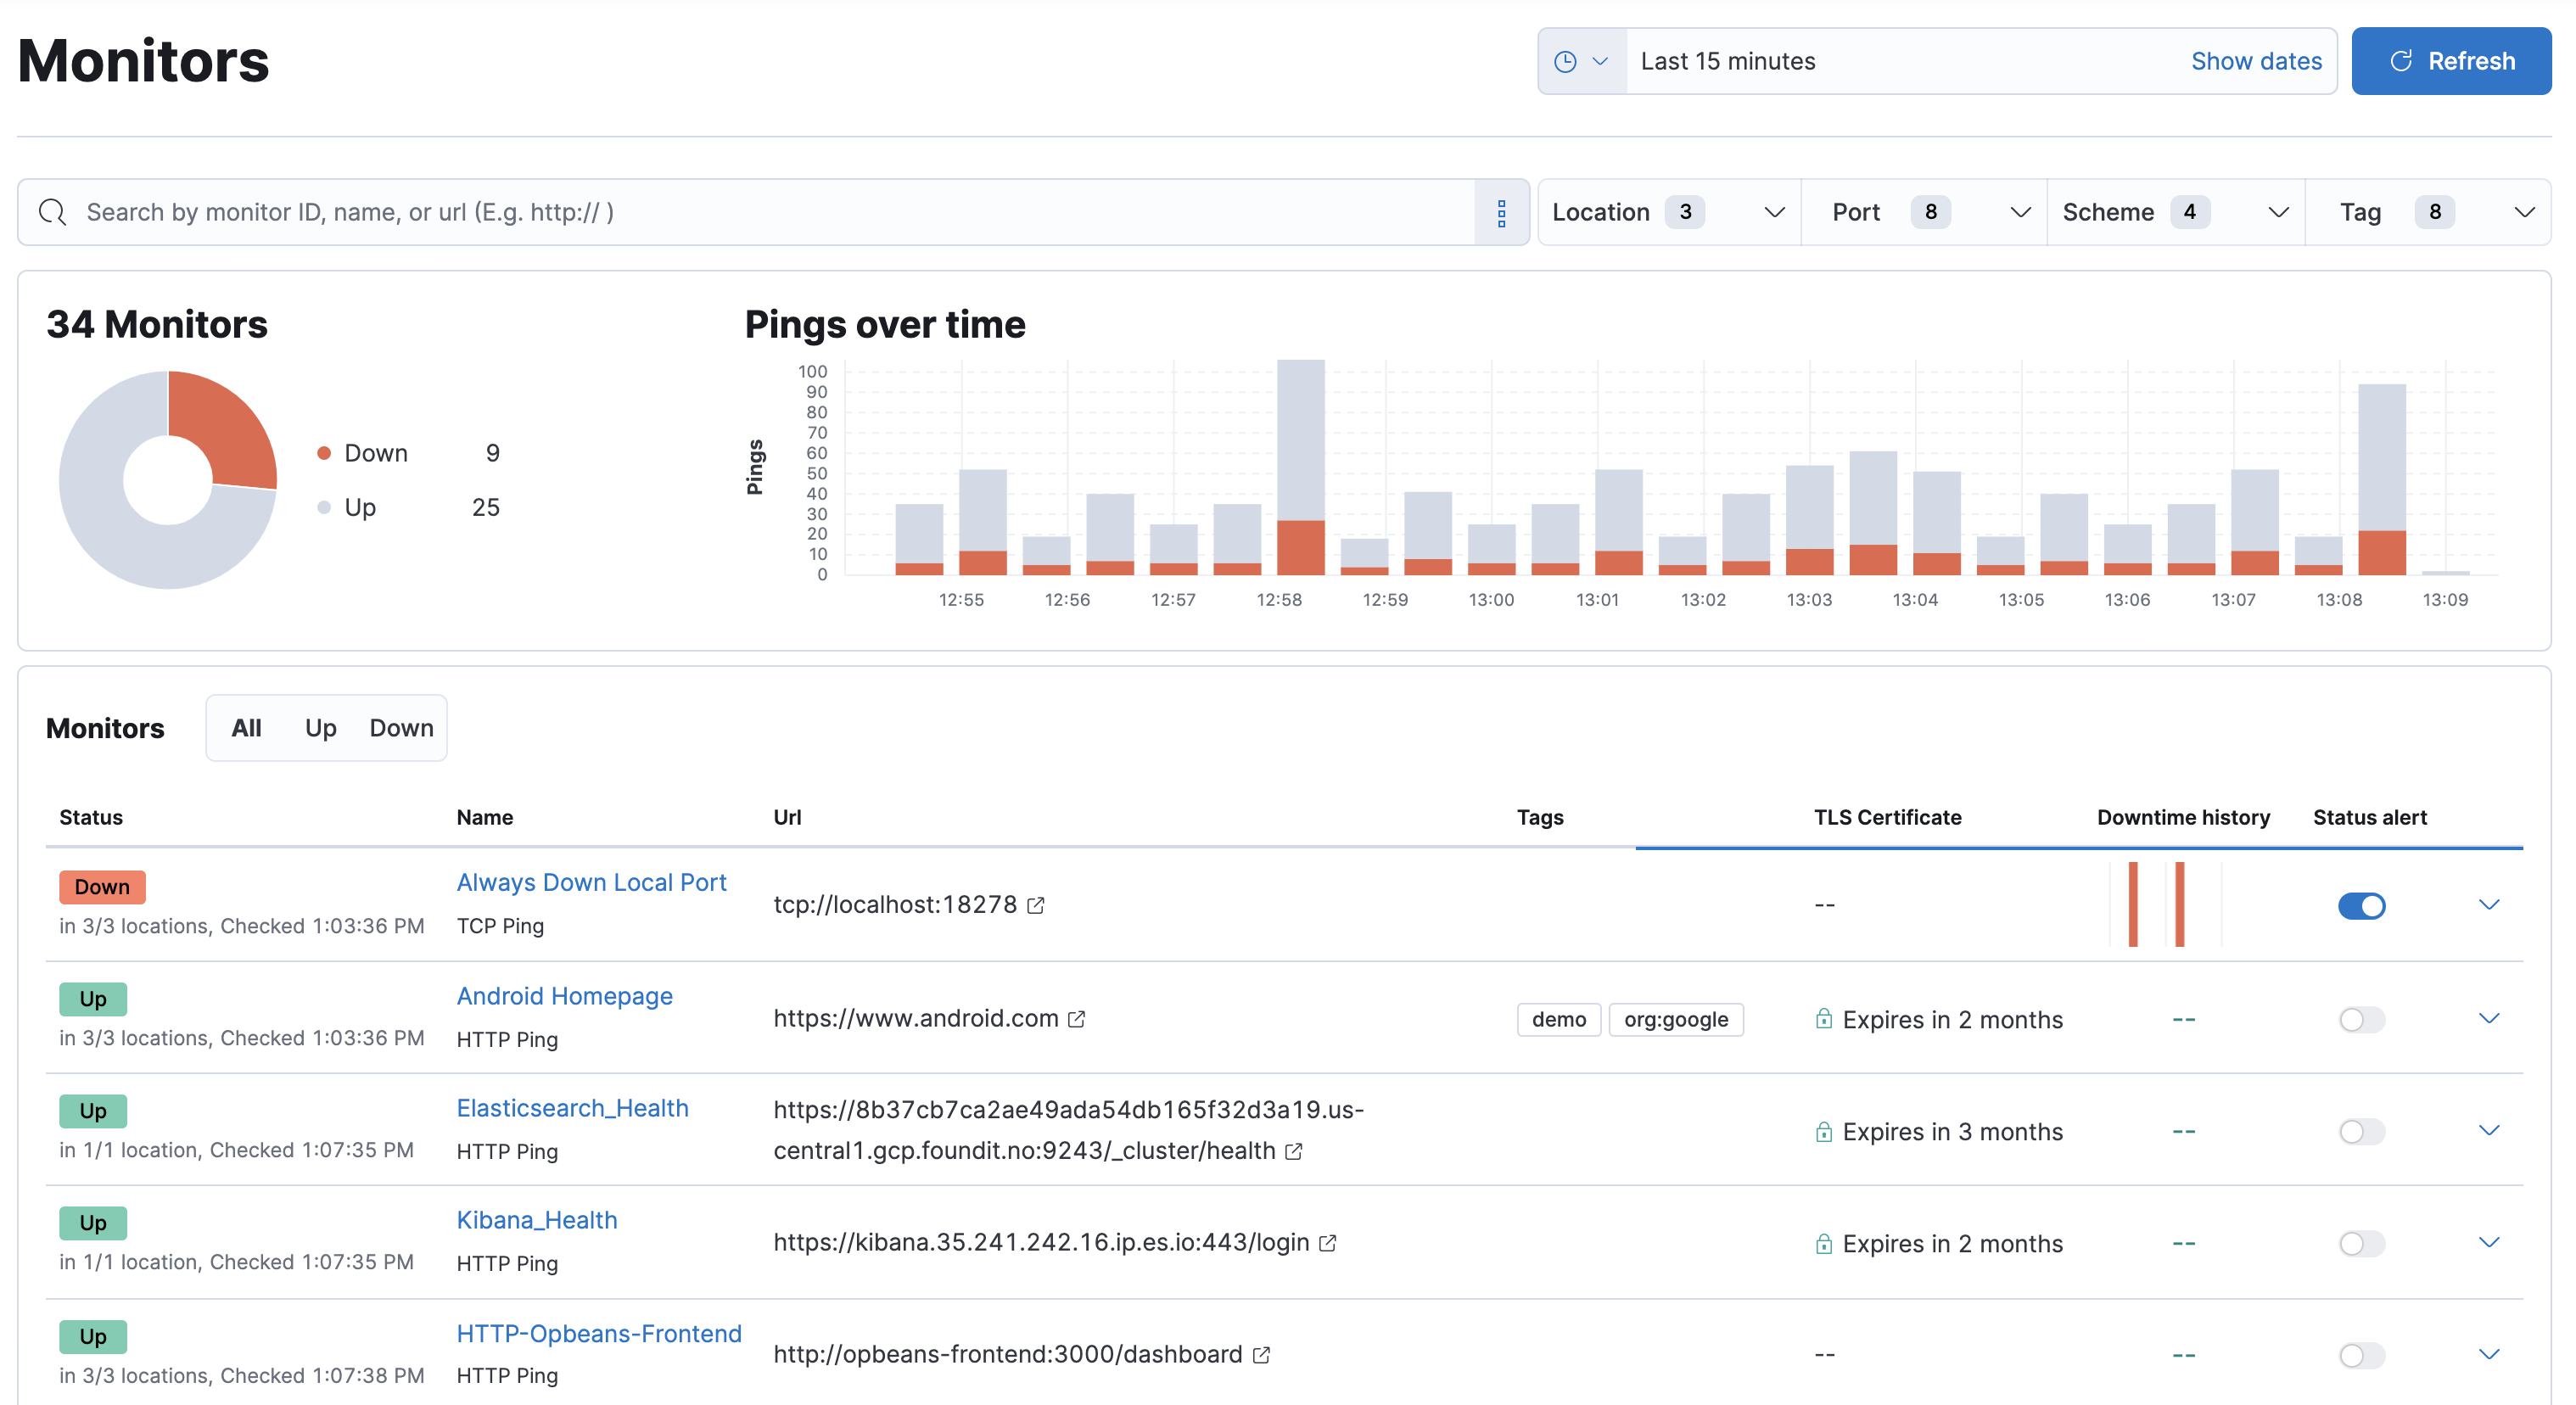
editThe Uptime app in Kibana lets you monitor user journeys and full page loads using our browser monitor, and also monitor the availability and response times of applications and services using our lightweight HTTP/S, TCP, and ICMP monitors.
Browser checks
edit[beta] This functionality is in beta and is subject to change. The design and code is less mature than official GA features and is being provided as-is with no warranties. Beta features are not subject to the support SLA of official GA features. Real browser synthetic monitoring enables you to test critical actions and requests that an end-user would perform on your site at predefined intervals and in a controlled environment. You can view each synthetic monitoring journey in the Uptime app side-by-side with your other Uptime monitors. The result is rich, consistent, and repeatable data that you can trend and alert on.
For example, test popular user journeys, like logging in, adding items to a cart, and checking out — actions that need to work for your users consistently.
Alerting ensures that any degraded performance or broken actions are fixed before impacting your bottom line or customer experience.

For more details, refer to Real browser synthetic monitoring.
Lightweight HTTP/S, TCP, and ICMP checks
editYou can monitor the status of network endpoints using lightweight HTTP/S, TCP, and ICMP checks, explore endpoint status over time, drill down into specific monitors, and view a high-level snapshot of your environment at any point in time.

For more details, refer to lightweight ICMP, TCP, and HTTP checks.