Monitor Amazon Simple Queue Service (SQS)
editMonitor Amazon Simple Queue Service (SQS)
editAmazon Simple Queue Service (SQS) is a message queuing service that allows your application components to communicate asynchronously through messages, making it easier to decouple and scale microservices, distributed systems, and serverless applications.
AWS SQS and Amazon CloudWatch are integrated and therefore, you can collect, view, and analyze data. Metrics for Amazon SQS queues are automatically collected and pushed to CloudWatch at one-minute intervals.
You can view and analyze the queue’s metrics from the Amazon SQS console, the CloudWatch console, the AWS CLI, or by using the CloudWatch API.
The Elastic Amazon SQS integration collects metrics from Amazon CloudWatch using Elastic Agent.
Get started
editTo collect SQS metrics, you typically need to install the Elastic Amazon SQS integration and deploy an Elastic Agent locally or on an EC2 instance.
Expand the quick guide to learn how, or skip to the next section if your data is already in Elasticsearch.
Quick guide: Add data
Elastic Agent is currently the preferred way to add SQS metrics. For other ways, refer to Adding data to Elasticsearch.
Dashboards
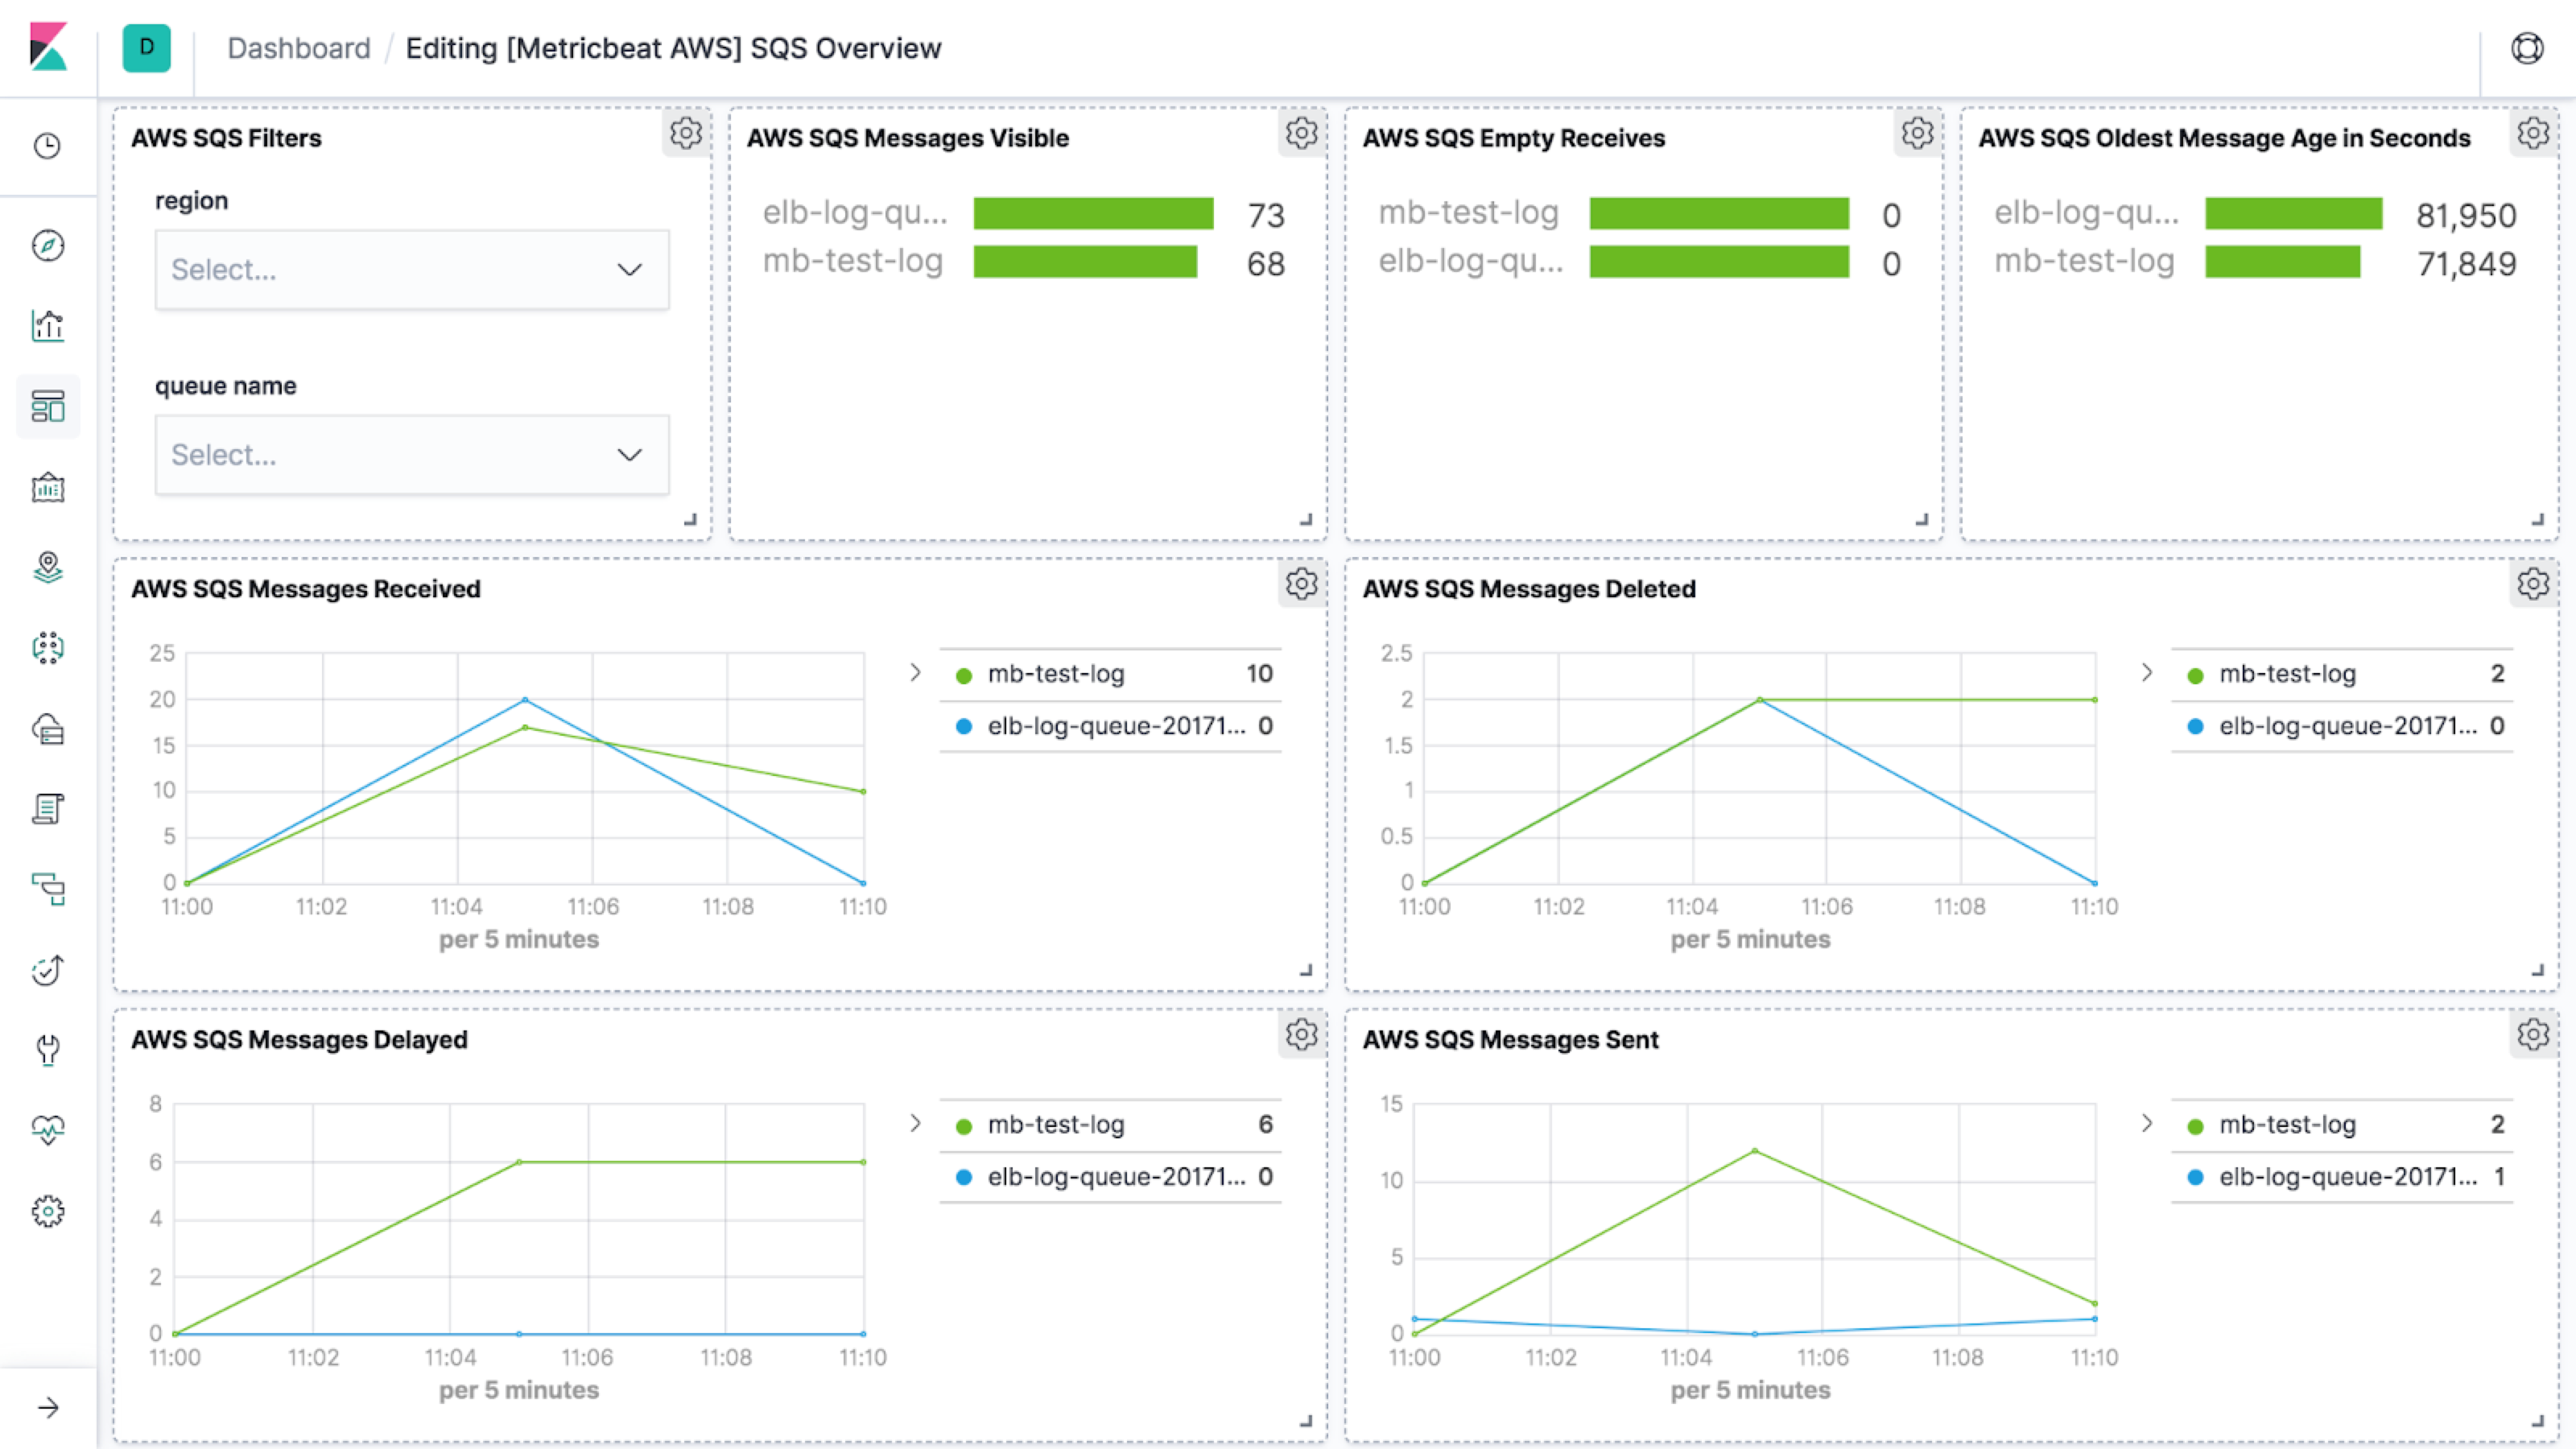
editKibana provides a full data analytics platform with out-of-the-box dashboards that you can clone and enhance to satisfy your custom visualization use cases. For example, to see an overview of your SQS metrics in Kibana, go to the Dashboard app and navigate to the [Metrics AWS] SQS Overview dashboard.
Metrics to watch
editHere are the key metrics that you should watch, organized by category. For a full list of fields exported by the integration, refer to the Amazon SQS integration docs.
-
messages
-
aws.sqs.messages.delayed -
aws.sqs.messages.not_visible -
aws.sqs.messages.visible -
aws.sqs.messages.deleted -
aws.sqs.messages.received -
aws.sqs.messages.sent -
aws.sqs.oldest_message_age.sec -
aws.sqs.sent_message_size.bytes
-
-
queue
-
aws.sqs.queue.name
-