Get started
editGet started
editTo set up a synthetic monitor, you need to configure the monitor, run it, and send data back to Elasticsearch. After setup is complete, the data will be available in Kibana to view, analyze, and alert on.
There are two ways to set up a synthetic monitor:
- Project monitors
- The Synthetics app
Read more about each option below, and choose the approach that works best for you.
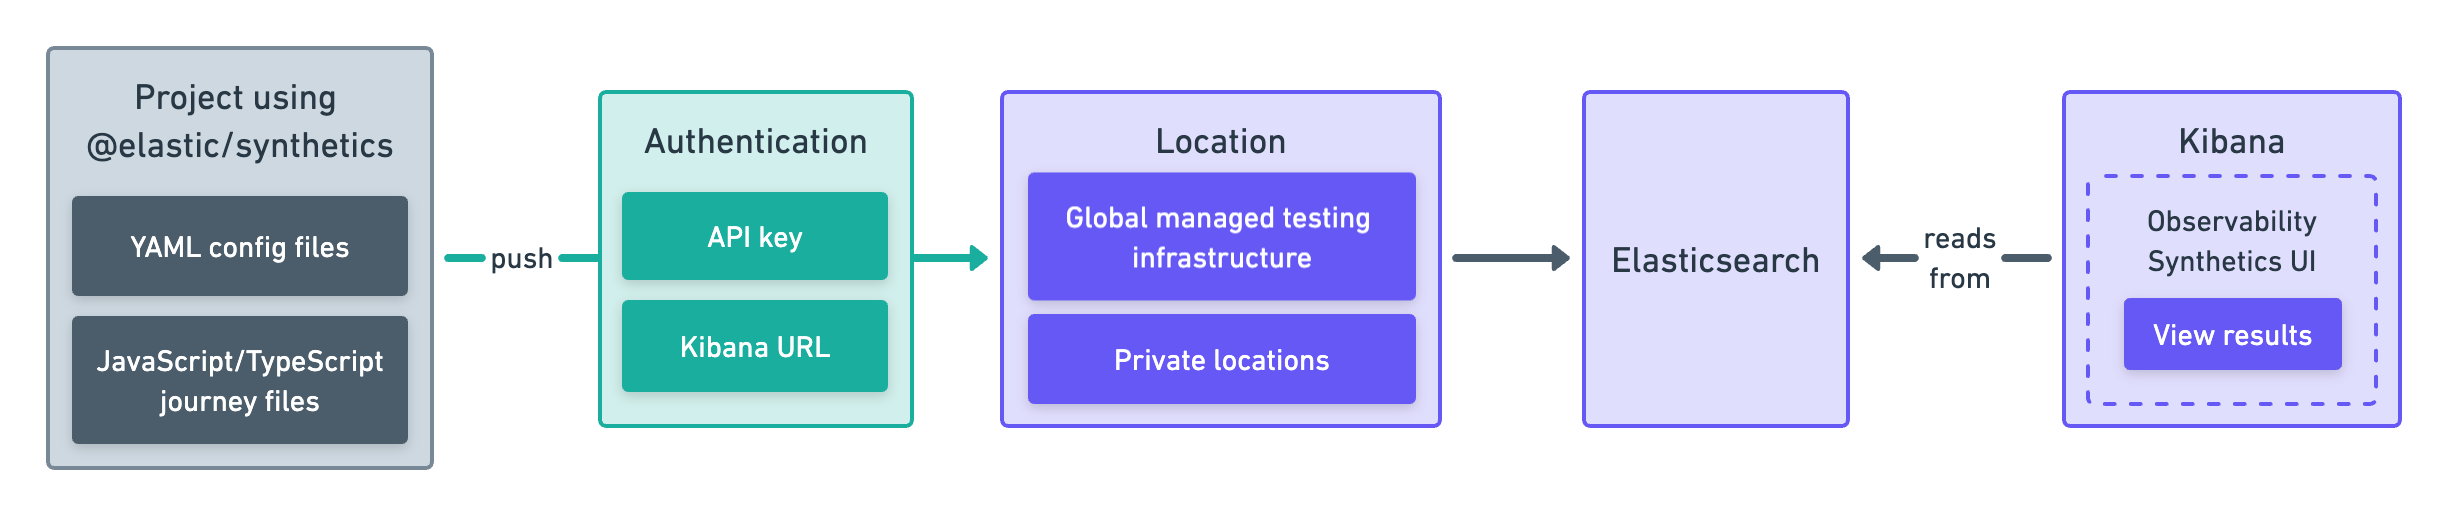
Project monitors
editWith Elastic Project monitors, you write tests in an external version-controlled
project using YAML for lightweight monitors and JavaScript or TypeScript for browser monitors.
Then, you use the @elastic/synthetics NPM library’s push command to create
monitors in Kibana.
This approach works well if you want to create both browser monitors and lightweight monitors. It also allows you to configure and update monitors using a GitOps workflow.
Get started in Use Project monitors.
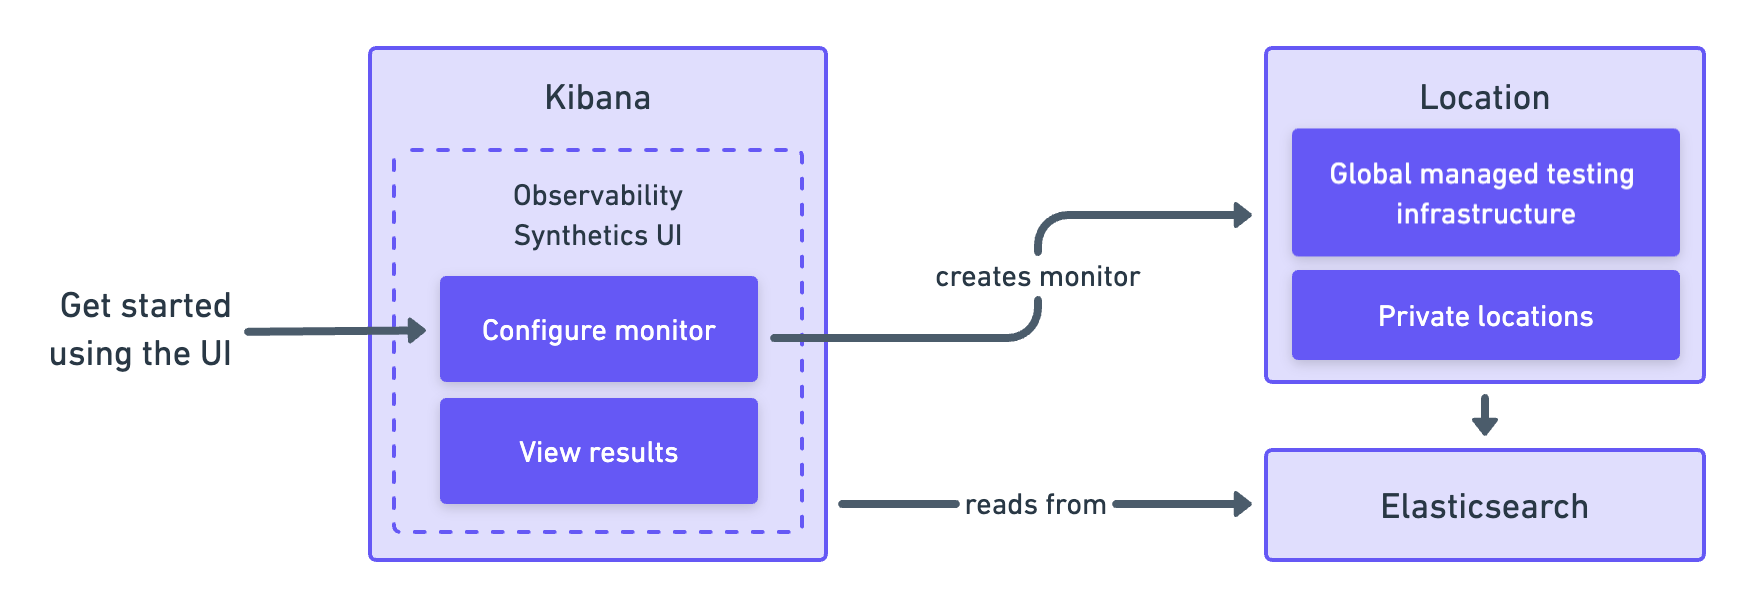
Synthetics app
editThe Synthetics app is an application in Kibana. You can create monitors directly in the Synthetics app using the user interface.
This approach works well if you want to configure and update monitors using a UI in your browser.
Get started in Use the Synthetics app.
The Elastic Synthetics integration is a method for creating synthetic monitors that is no longer recommended. Do not use the Elastic Synthetics integration to set up new monitors.
For details on how to migrate from Elastic Synthetics integration to project monitors or the Synthetics app, refer to Migrate from the Elastic Synthetics integration.
If you’ve used the Elastic Synthetics integration to create monitors in the past and need to reference documentation about the integration, go to the 8.3 documentation.