View monitor status
editView monitor status
editThe Monitors page provides you with a high-level view of all the services you are monitoring to help you quickly diagnose outages and other connectivity issues within your network.
To access this page, go to Observability > Uptime > Monitors.
Each endpoint, URL, and service represents a monitor.
Filter monitors
editTo get started with your analysis, use the automated filter options, such as location, port, scheme, and tags, or define a custom filter by field, URL, monitor ID, and other attributes.

Monitor availability
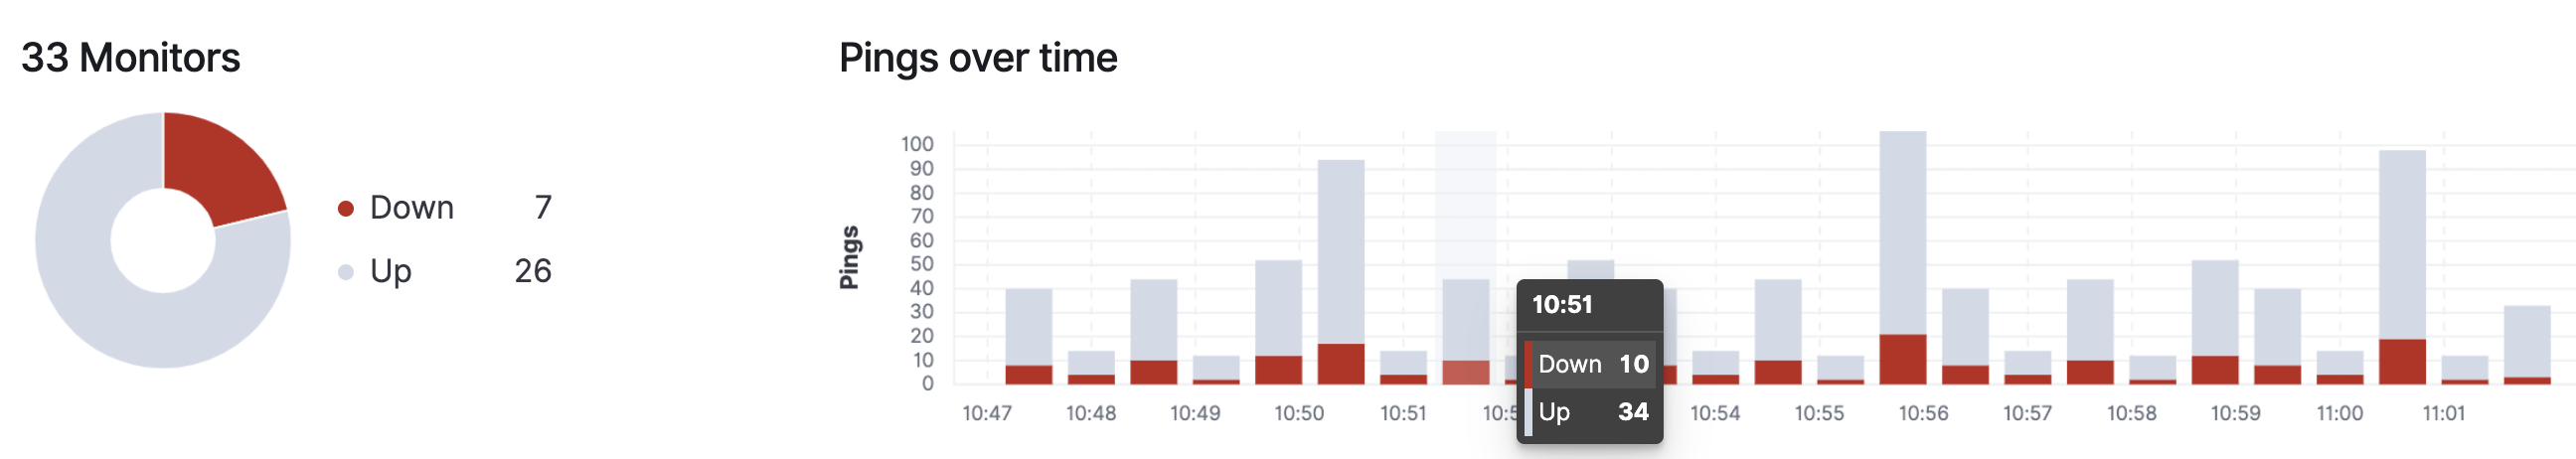
editThe snapshot panel displays the overall status of the environment you’re monitoring or
a subset of those monitors. You can see the total number of detected monitors within
the selected date range, based on the last check reported by Heartbeat, along
with the number of monitors in an up or down state.
Next to the counts, a histogram shows a count of Pings over time with a breakdown
of Up and Down counts per time bucket.
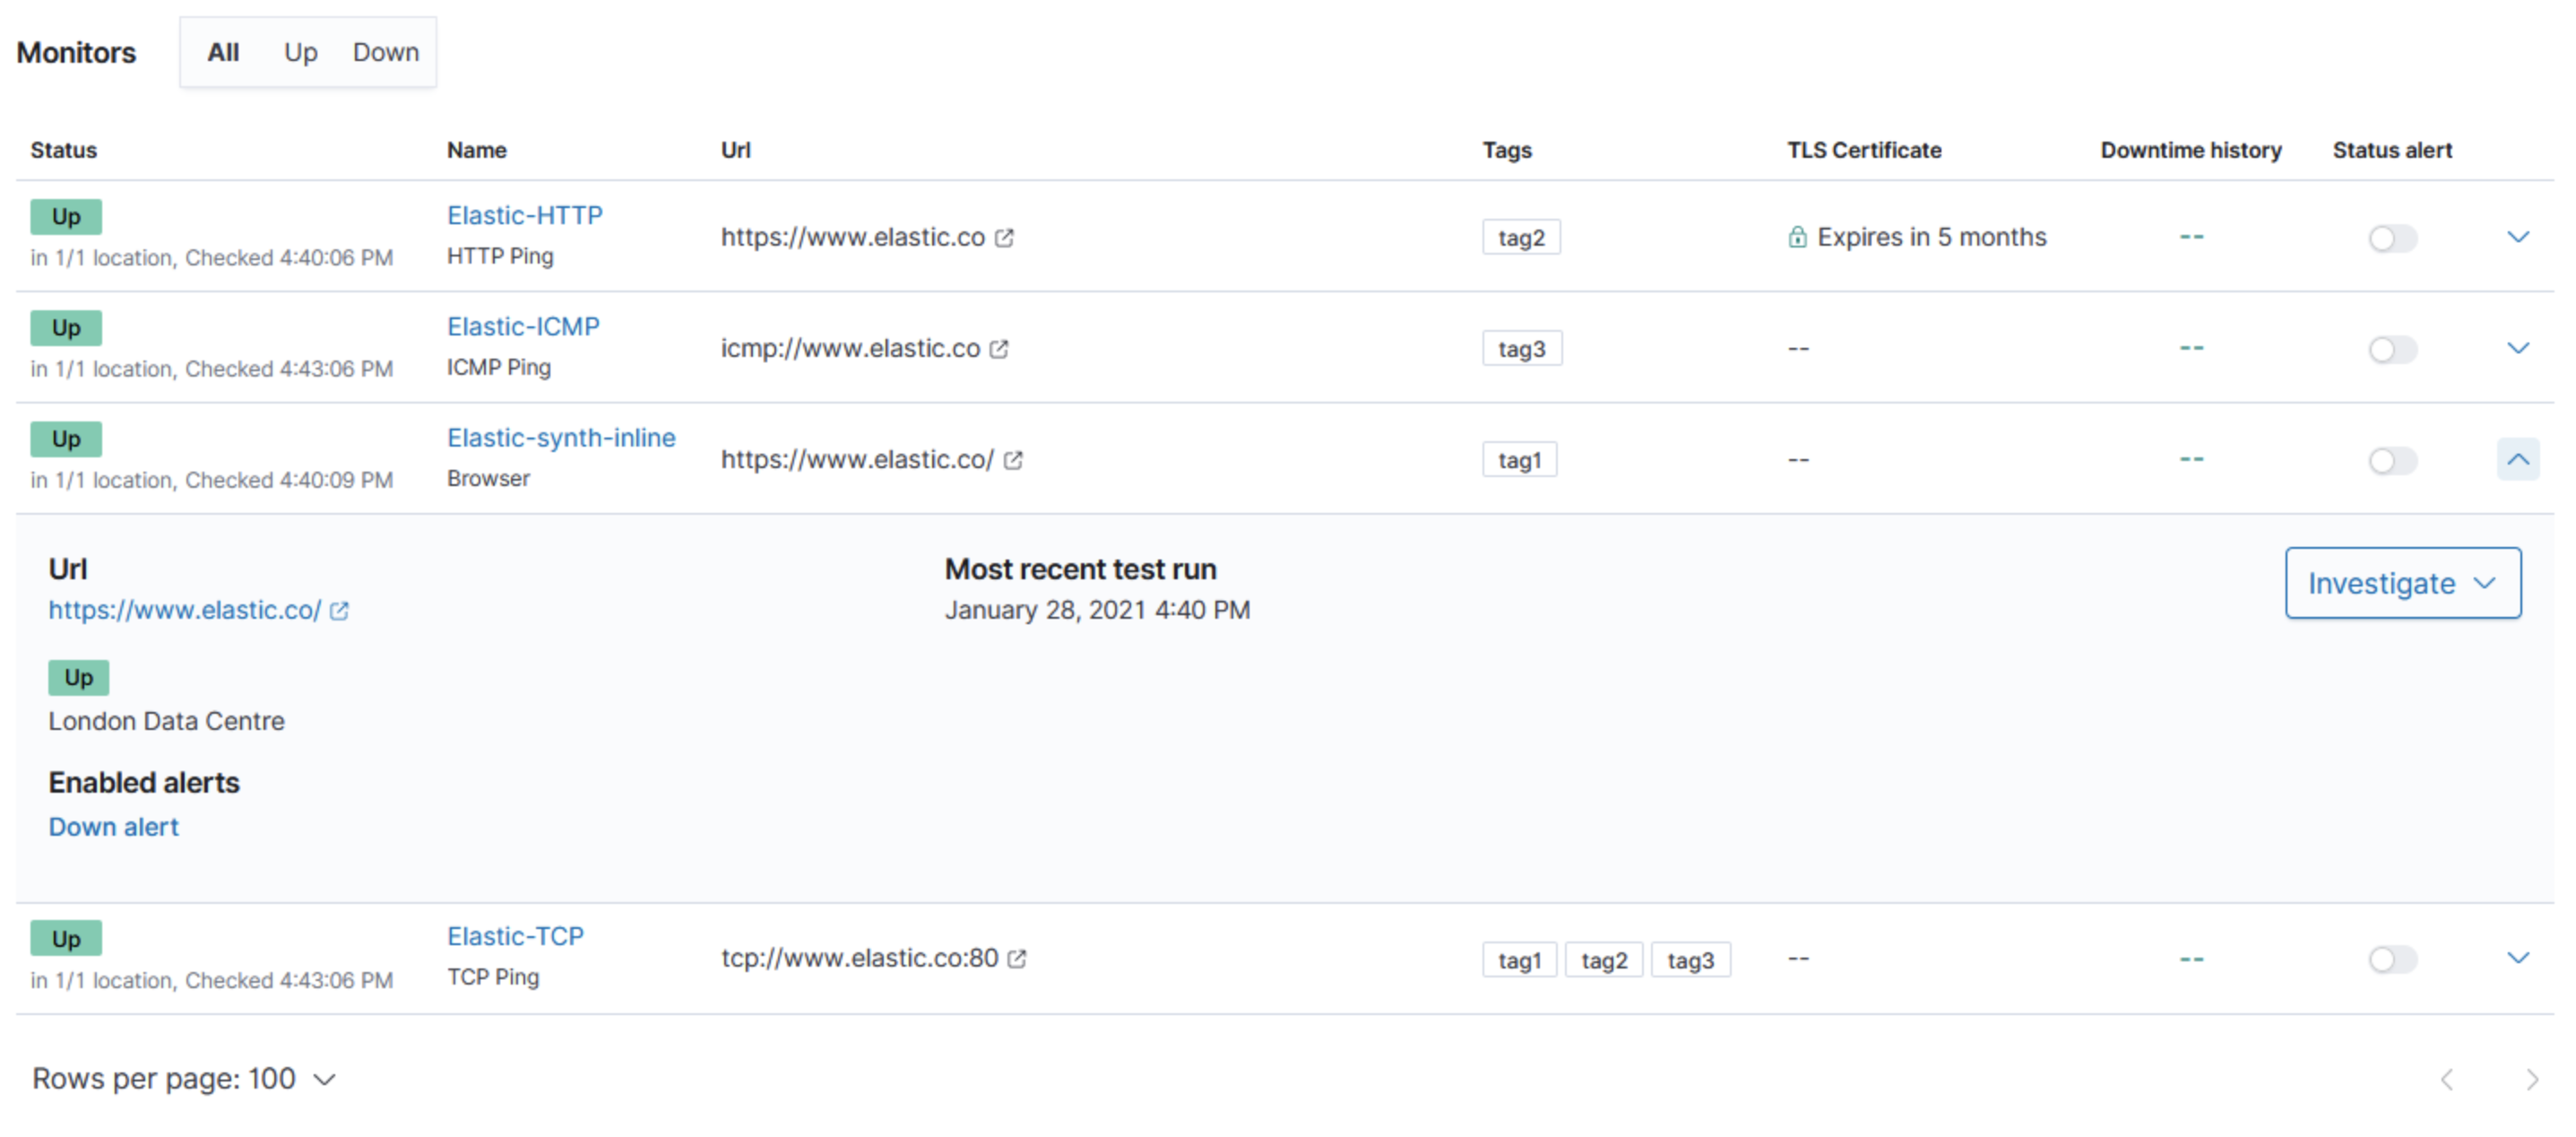
Information about individual monitors is displayed in the monitor list and provides a quick way to navigate to a detailed visualization for hosts or endpoints.
The information displayed includes the recent status of a host or endpoint, when the monitor was last checked, its URL, and, if applicable, the TLS certificate expiration time. There is also a sparkline showing downtime history.
Use monitor tags to display a custom assortment of monitors; for example, consider assigning tags based on a monitor’s hosted cloud provider – making it easy to quickly see all monitors hosted on GCP, AWS, etc.
Expand the table row for a specific monitor on the list to view additional information such as which alerts are configured for the monitor, a recent error and when it occurred, the date and time of any recent test runs, and it’s URL.
Integrate with other Observability apps
editThe Monitor list also contains a menu of available integrations. Expand the table row for a specific monitor on the list, and then click Investigate.
Depending on the features you have installed and configured, you can view logs, metrics, or APM data relating to that monitor. You can choose:
- Show host, pod, or container logs in the Logs app.
- Show APM data in the APM app.
- Show host, pod, or container metrics in the Infrastructure app.