- Observability: other versions:
- What is Elastic Observability?
- What’s new in 8.13
- Get started
- Observability AI Assistant
- Application performance monitoring (APM)
- Self manage APM Server
- Data Model
- Features
- How-to guides
- OpenTelemetry integration
- Manage storage
- Configure
- Advanced setup
- Secure communication
- Monitor
- API
- Troubleshoot
- Upgrade
- Release notes
- Known issues
- Log monitoring
- Infrastructure monitoring
- AWS monitoring
- Azure monitoring
- Synthetic monitoring
- Get started
- Scripting browser monitors
- Configure lightweight monitors
- Manage monitors
- Work with params and secrets
- Analyze monitor data
- Monitor resources on private networks
- Use the CLI
- Configure projects
- Configure Synthetics settings
- Grant users access to secured resources
- Manage data retention
- Use Synthetics with traffic filters
- Migrate from the Elastic Synthetics integration
- Scale and architect a deployment
- Synthetics support matrix
- Synthetics Encryption and Security
- Troubleshooting
- Uptime monitoring
- Real user monitoring
- Universal Profiling
- Alerting
- Service-level objectives (SLOs)
- Cases
- CI/CD observability
- Troubleshooting
- Fields reference
- Tutorials
Application performance monitoring (APM)
editApplication performance monitoring (APM)
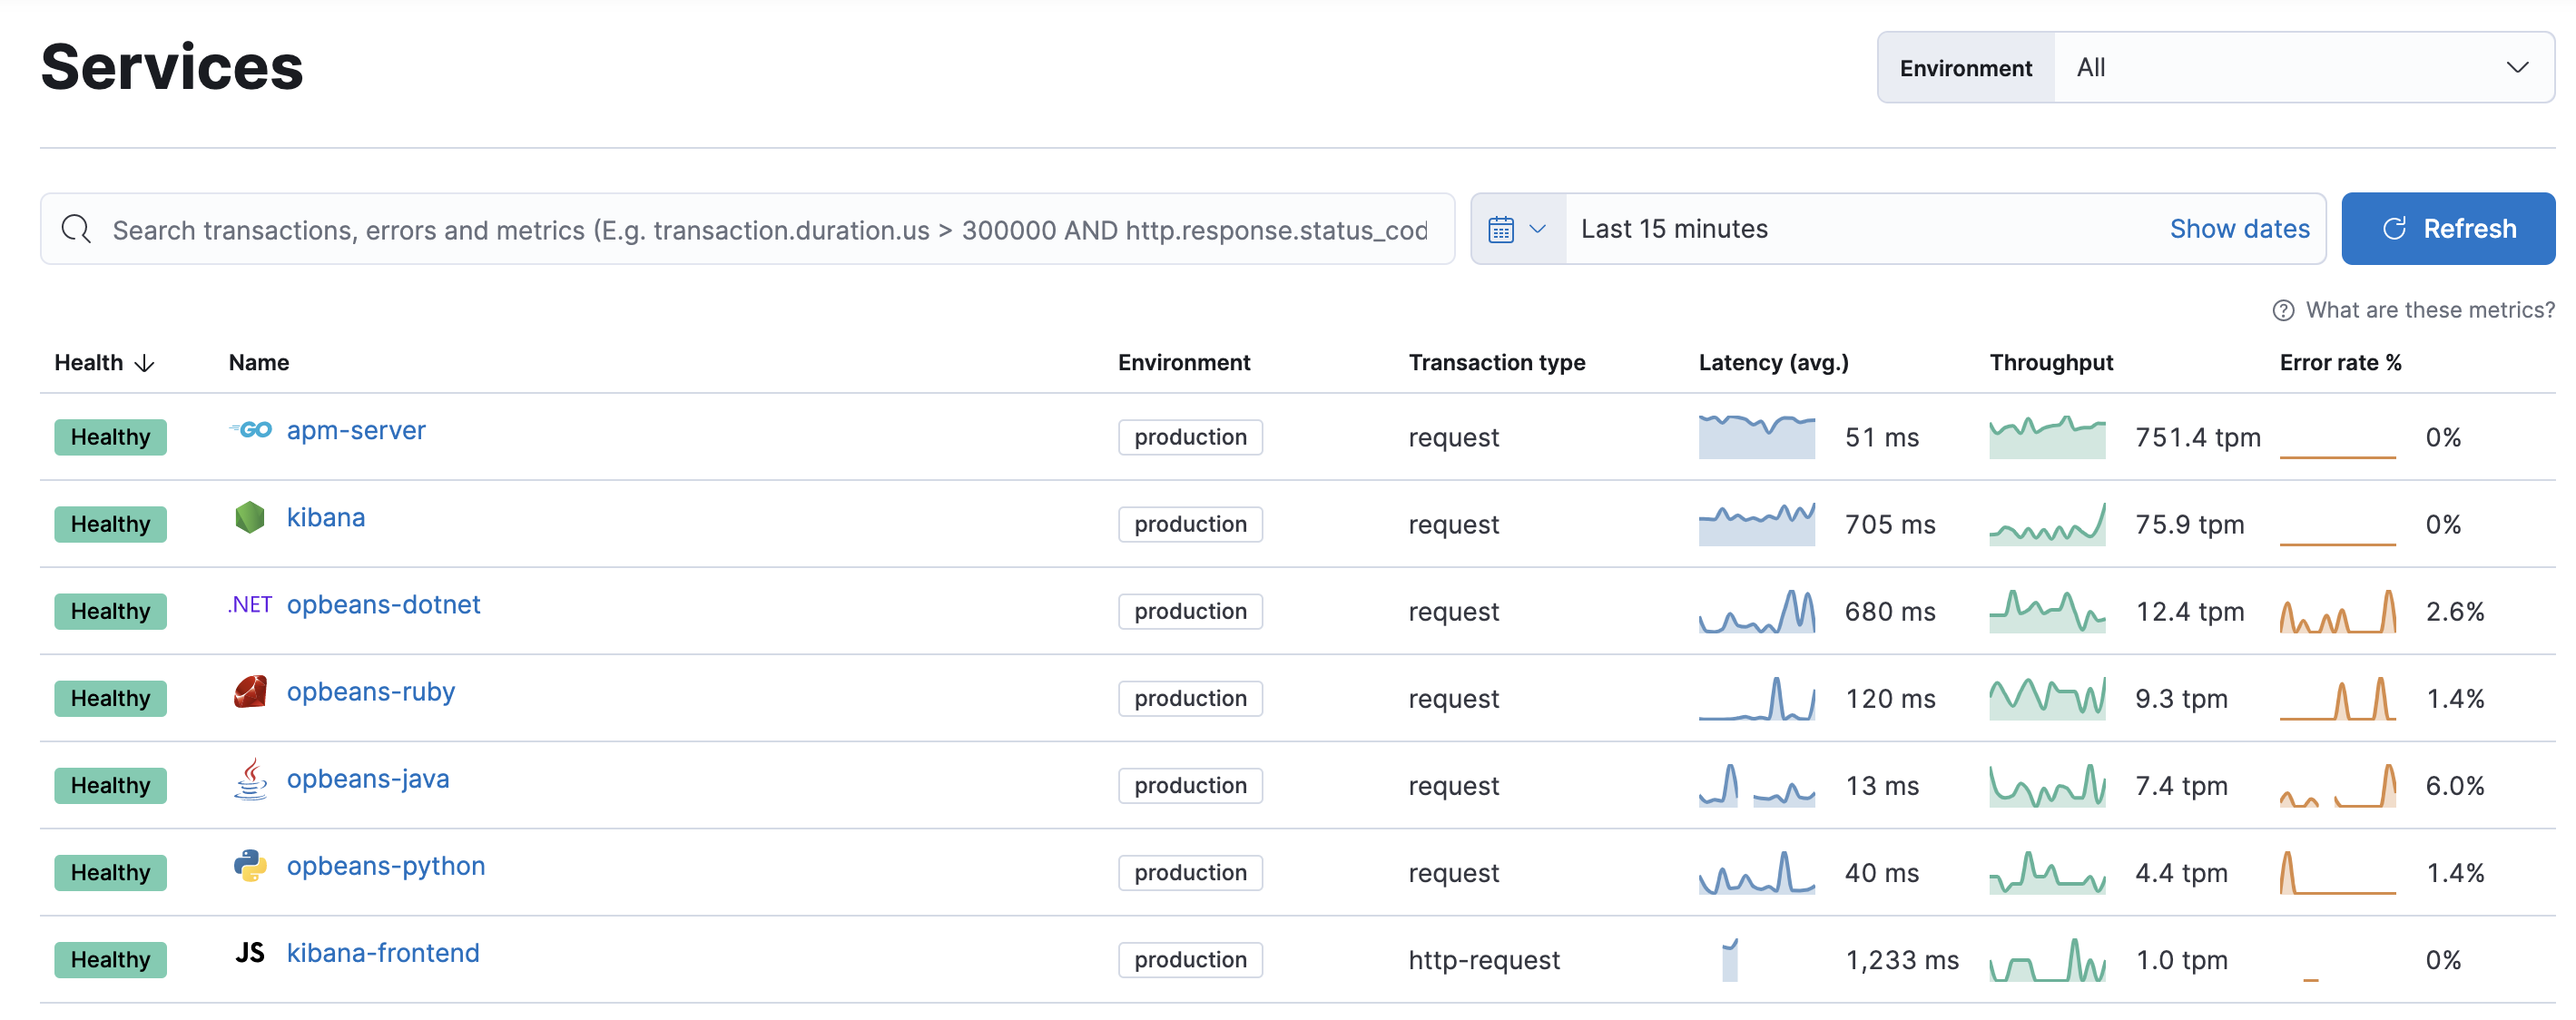
editElastic APM is an application performance monitoring system built on the Elastic Stack. It allows you to monitor software services and applications in real time, by collecting detailed performance information on response time for incoming requests, database queries, calls to caches, external HTTP requests, and more. This makes it easy to pinpoint and fix performance problems quickly.
![APM app in Kibana](images/apm-app-landing.png)
Elastic APM also automatically collects unhandled errors and exceptions. Errors are grouped based primarily on the stack trace, so you can identify new errors as they appear and keep an eye on how many times specific errors happen.
Metrics are another vital source of information when debugging production systems. Elastic APM agents automatically pick up basic host-level metrics and agent-specific metrics, like JVM metrics in the Java Agent, and Go runtime metrics in the Go Agent.
Give Elastic APM a try
editUse Get started with application traces and APM to quickly spin up an APM deployment. Want to host everything yourself instead? See Self manage APM Server.
On this page