Categorize log entries
editCategorize log entries
editApplication log events are often unstructured and contain variable data. Many log messages are the same or very similar, so classifying them can reduce millions of log lines into just a few categories.
Within the Logs app, the Categories page enables you to identify patterns in your log events quickly. Instead of manually identifying similar logs, the logs categorization view lists log events that have been grouped based on their messages and formats so that you can take action quicker.
This feature makes use of machine learning anomaly detection jobs. To set up jobs, you must
have all Kibana feature privileges for Machine Learning. Users that have full or
read-only access to machine learning features within a Kibana space can view the results of
all anomaly detection jobs that are visible in that space, even if they do not have
access to the source indices of those jobs. You must carefully consider who is
given access to machine learning features; anomaly detection job results may propagate field values
that contain sensitive information from the source indices to the results. For
more details, refer to Set up machine learning features.
Create log categories
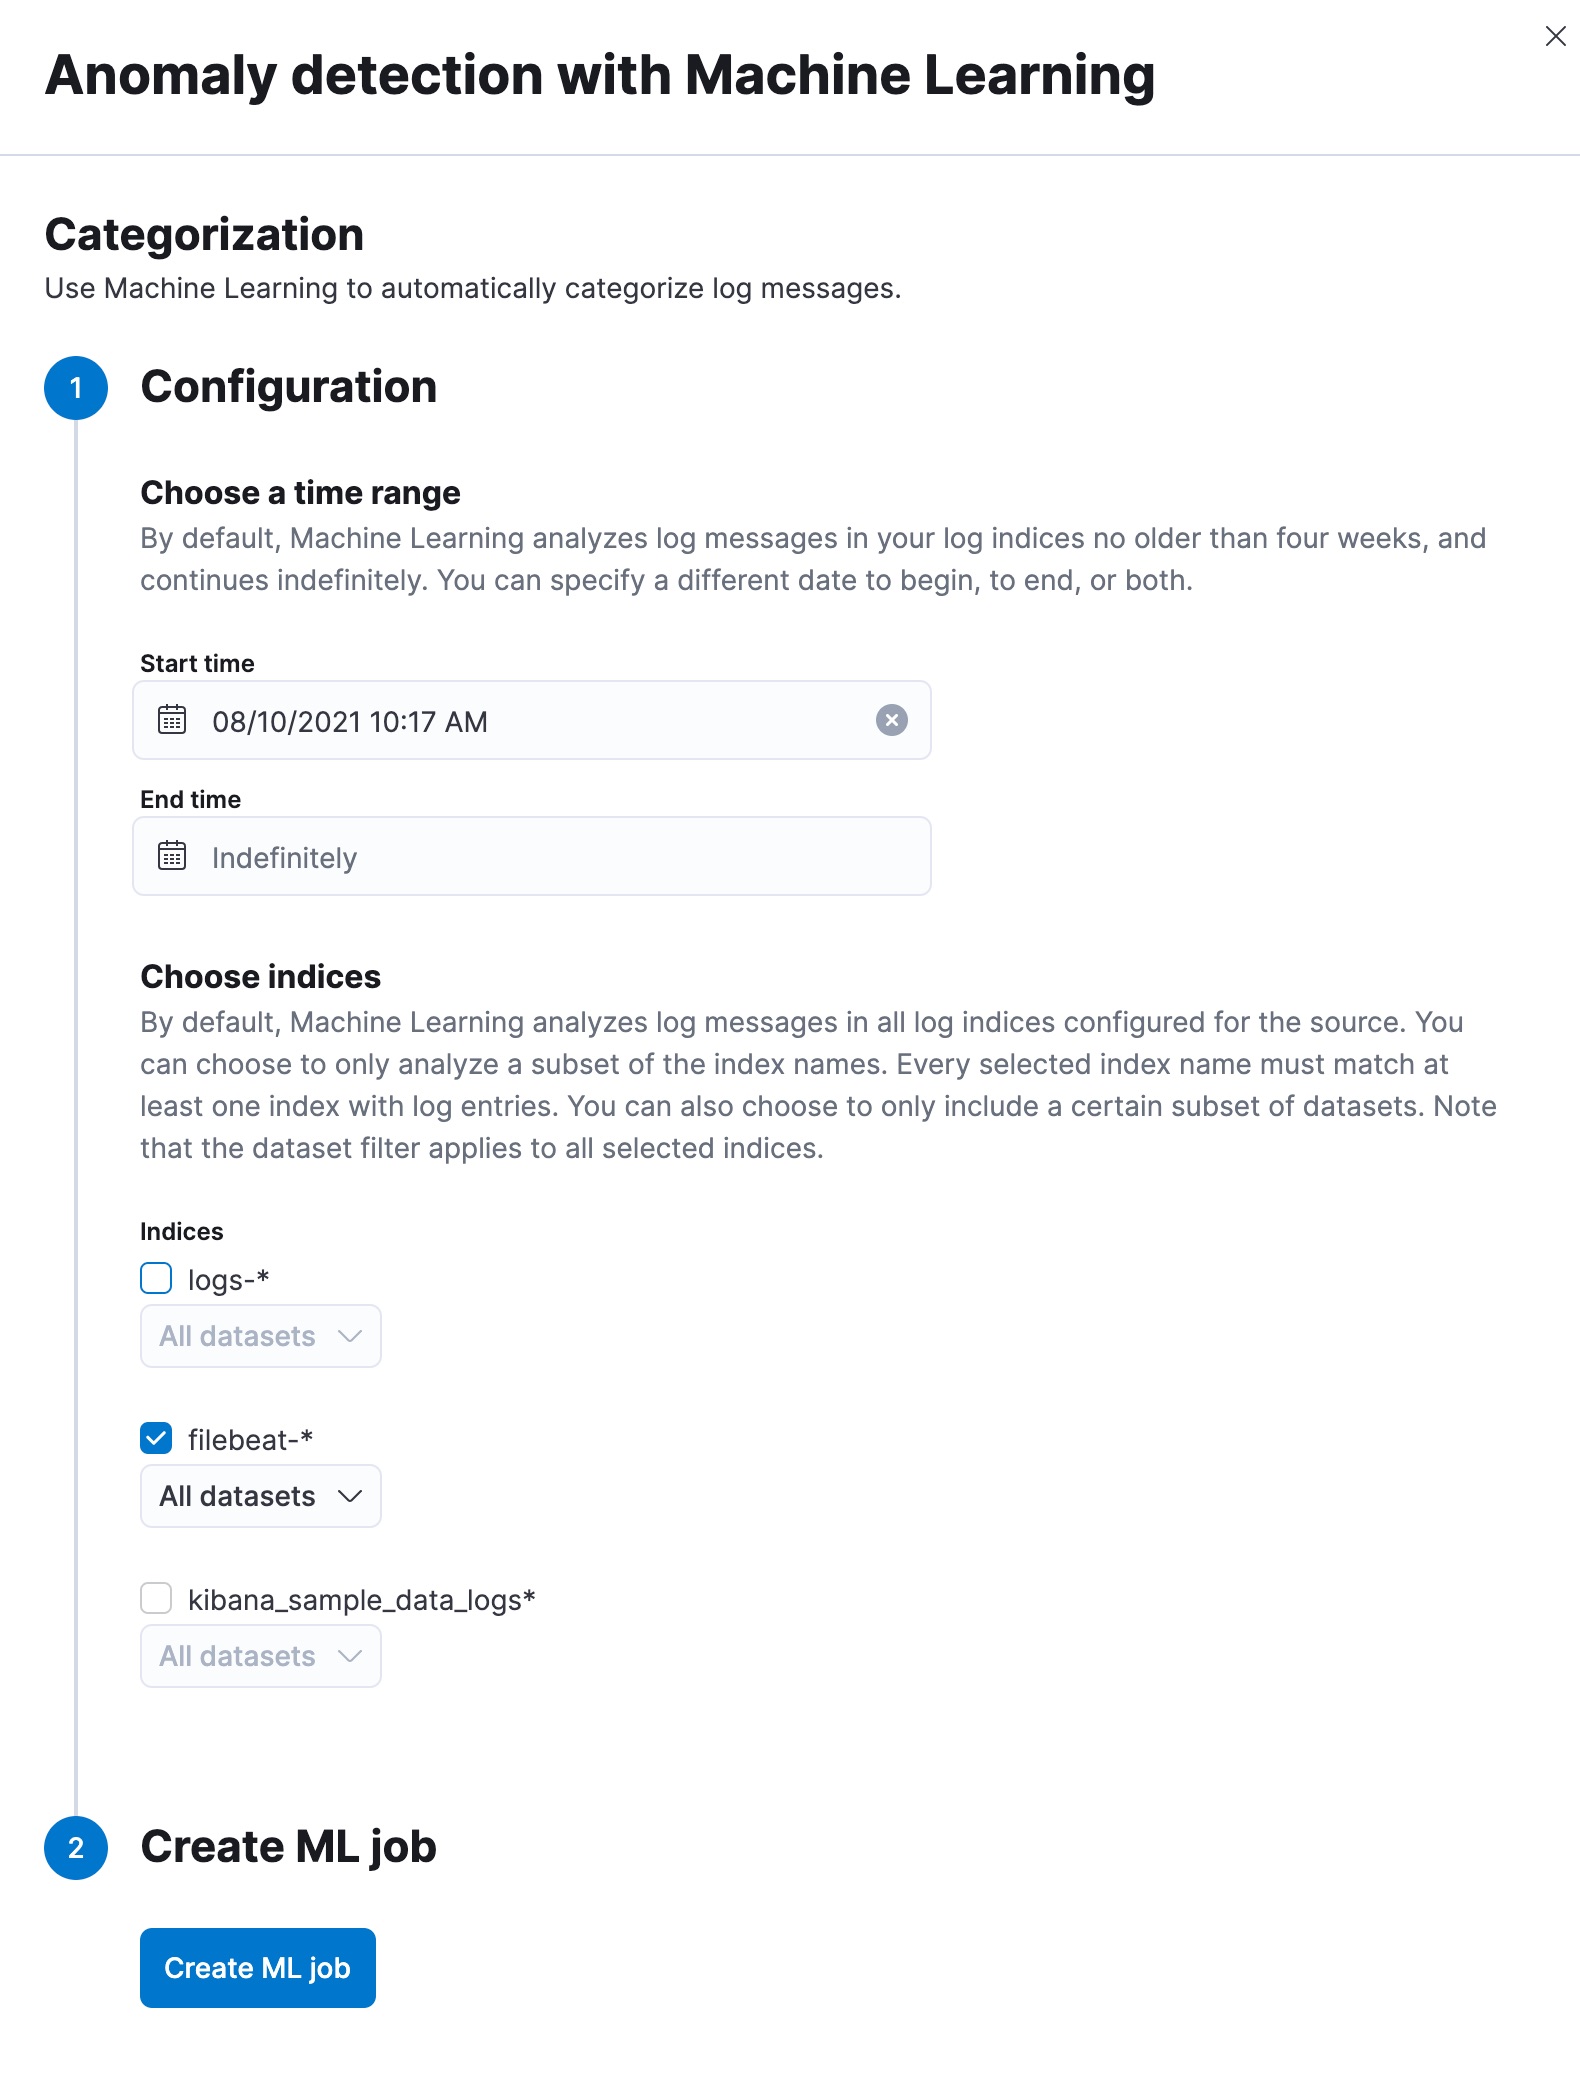
editCreate a machine learning job to categorize log messages automatically. Machine learning observes the static parts of the message, clusters similar messages, classifies them into message categories, and detects unusually high message counts in the categories.

- Select Categories, and you are prompted to use machine learning to create log rate categorizations.
- Choose a time range for the machine learning analysis. By default, the machine learning job analyzes log messages no older than four weeks and continues indefinitely.
- Add the indices that contain the logs you want to examine.
- Click Create ML job. The job is created, and it starts to run. It takes a few minutes for the machine learning robots to collect the necessary data. After the job processed the data, you can view the results.
Analyze log categories
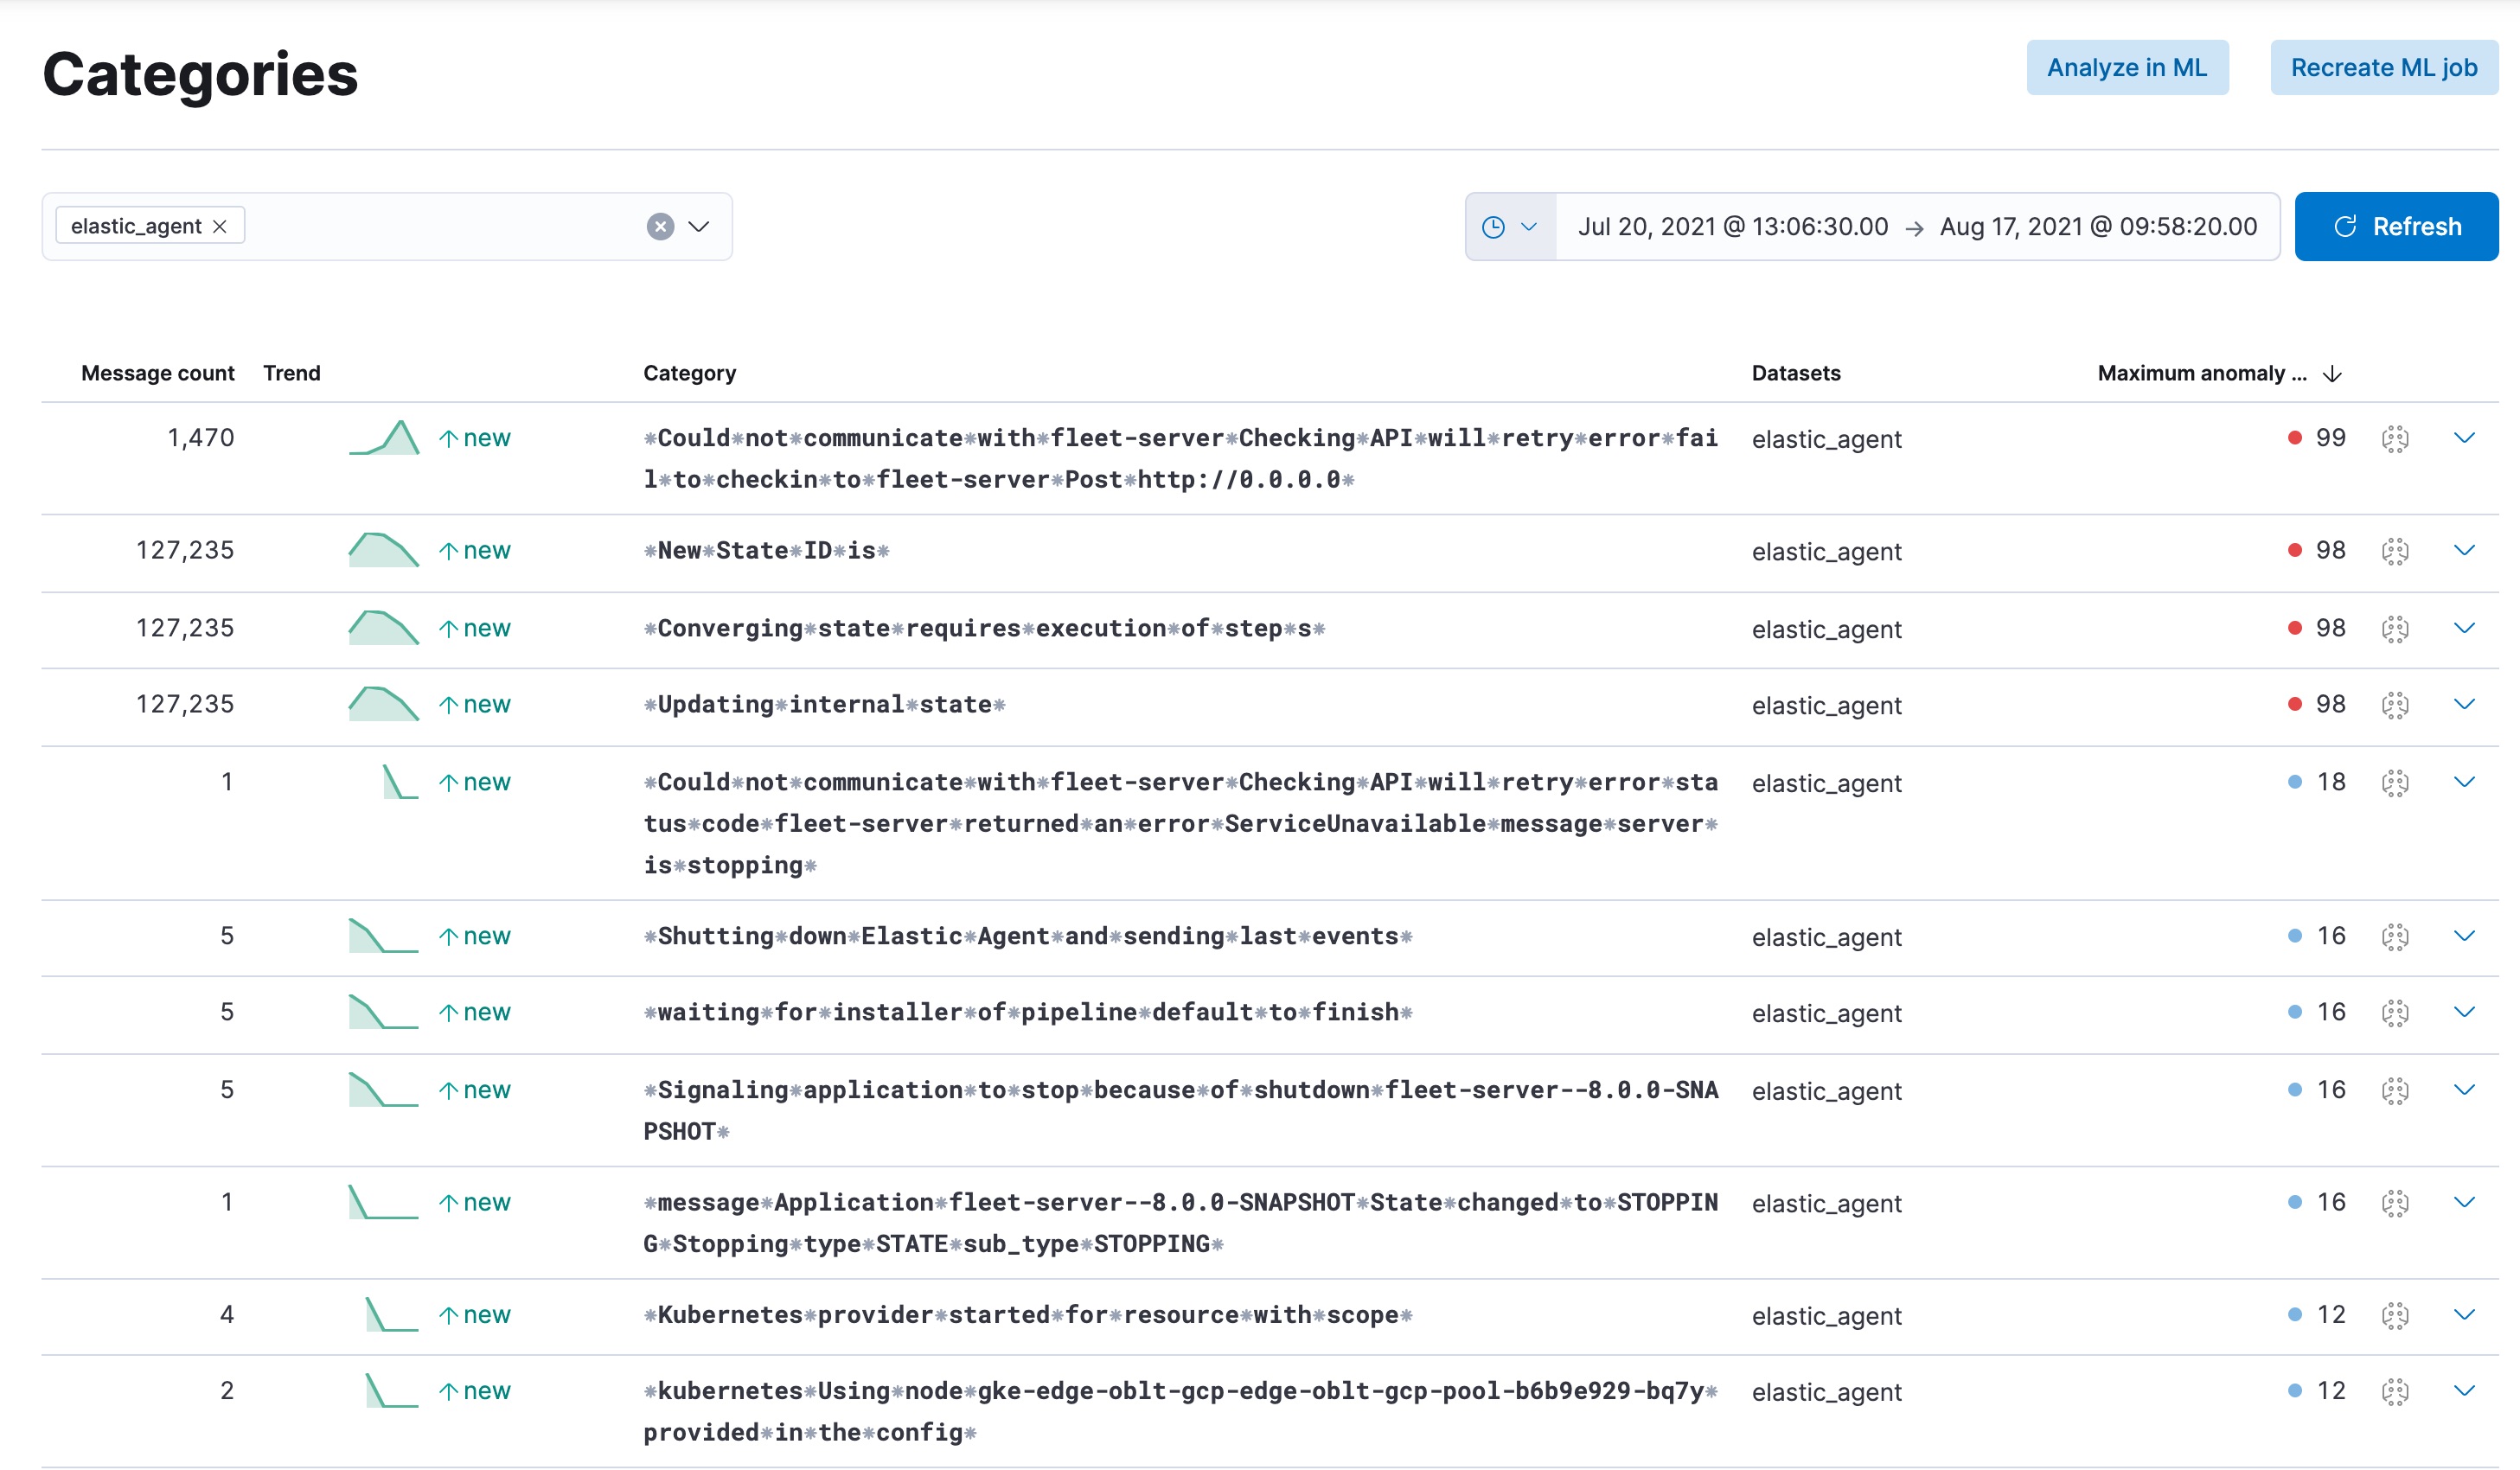
editThe Categories page lists all the log categories from the selected indices.
You can filter the categories by indices. The screenshot below shows the
categories from the elastic.agent log.

The category row contains the following information:
- message count: shows how many messages belong to the given category.
- trend: indicates how the occurrence of the messages changes in time.
- category name: it is the name of the category and is derived from the message text.
- datasets: the name of the datasets where the categories are present.
- maximum anomaly score: the highest anomaly score in the category.
To view a log message under a particular category, click the arrow at the end of the row. To further examine a message, it can be viewed in the corresponding log event on the Stream page or displayed in its context.

For more information about categorization, go to Detecting anomalous categories of data.