Use advanced queries on your application data
editUse advanced queries on your application data
editQuerying your APM data is an essential tool that can make finding bottlenecks in your code even more straightforward.
Using the query bar, a powerful data query feature, you can pass advanced queries on your data to filter on specific pieces of information you’re interested in.
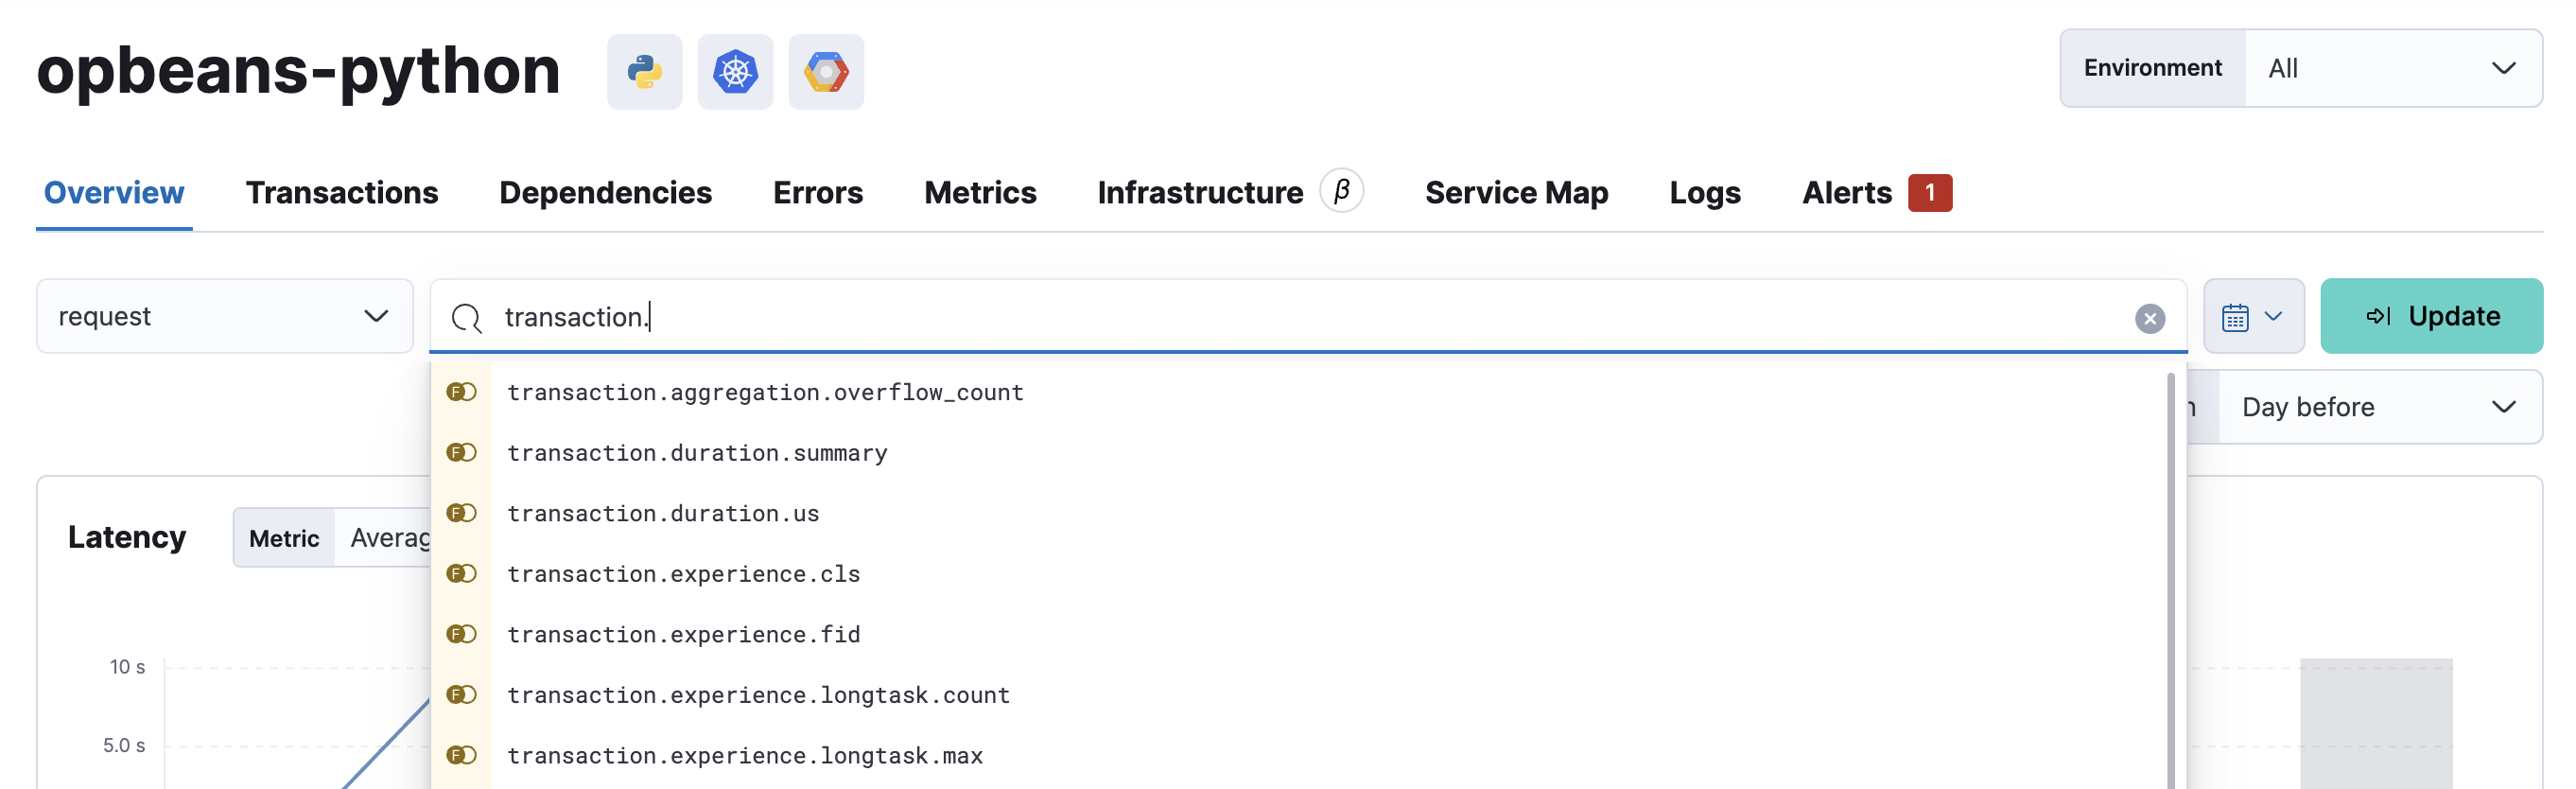
The query bar comes with a handy autocomplete that helps find the fields and even provides suggestions to the data they include. You can select the query bar and hit the down arrow on your keyboard to begin scanning recommendations.
When querying in the Applications UI, you’re merely searching and selecting data from fields in Elasticsearch documents. Queries entered into the query bar are also added as parameters to the URL, so it’s easy to share a specific query or view with others.
When you type, you can begin to see some of the transaction fields available for filtering:
To learn more about the Kibana query language capabilities, see the Kibana Query Language Enhancements documentation.
APM queries can be handy for removing noise from your data in the Services, Transactions, Errors, Metrics, and Traces views.
For example, in the Services view, you can quickly view a list of all the instrumented services running on your production
environment: service.environment : production. Or filter the list by including the APM agent’s name and the host it’s running on:
service.environment : "production" and agent.name : "java" and host.name : "prod-server1".
On the Traces view, you might want to view failed transaction results from any of your running containers:
transaction.result :"FAILURE" and container.id : *.
On the Transactions view, you may want to list only the slower transactions than a specified time threshold: transaction.duration.us > 2000000.
Or filter the list by including the service version and the Kubernetes pod it’s running on:
transaction.duration.us > 2000000 and service.version : "7.12.0" and kubernetes.pod.name : "pod-5468b47f57-pqk2m".
Alternatively, you can query your APM documents in Discover. Querying documents in Discover works the same way as queries in the Applications UI, and Discover supports all of the example Applications UI queries shown on this page.
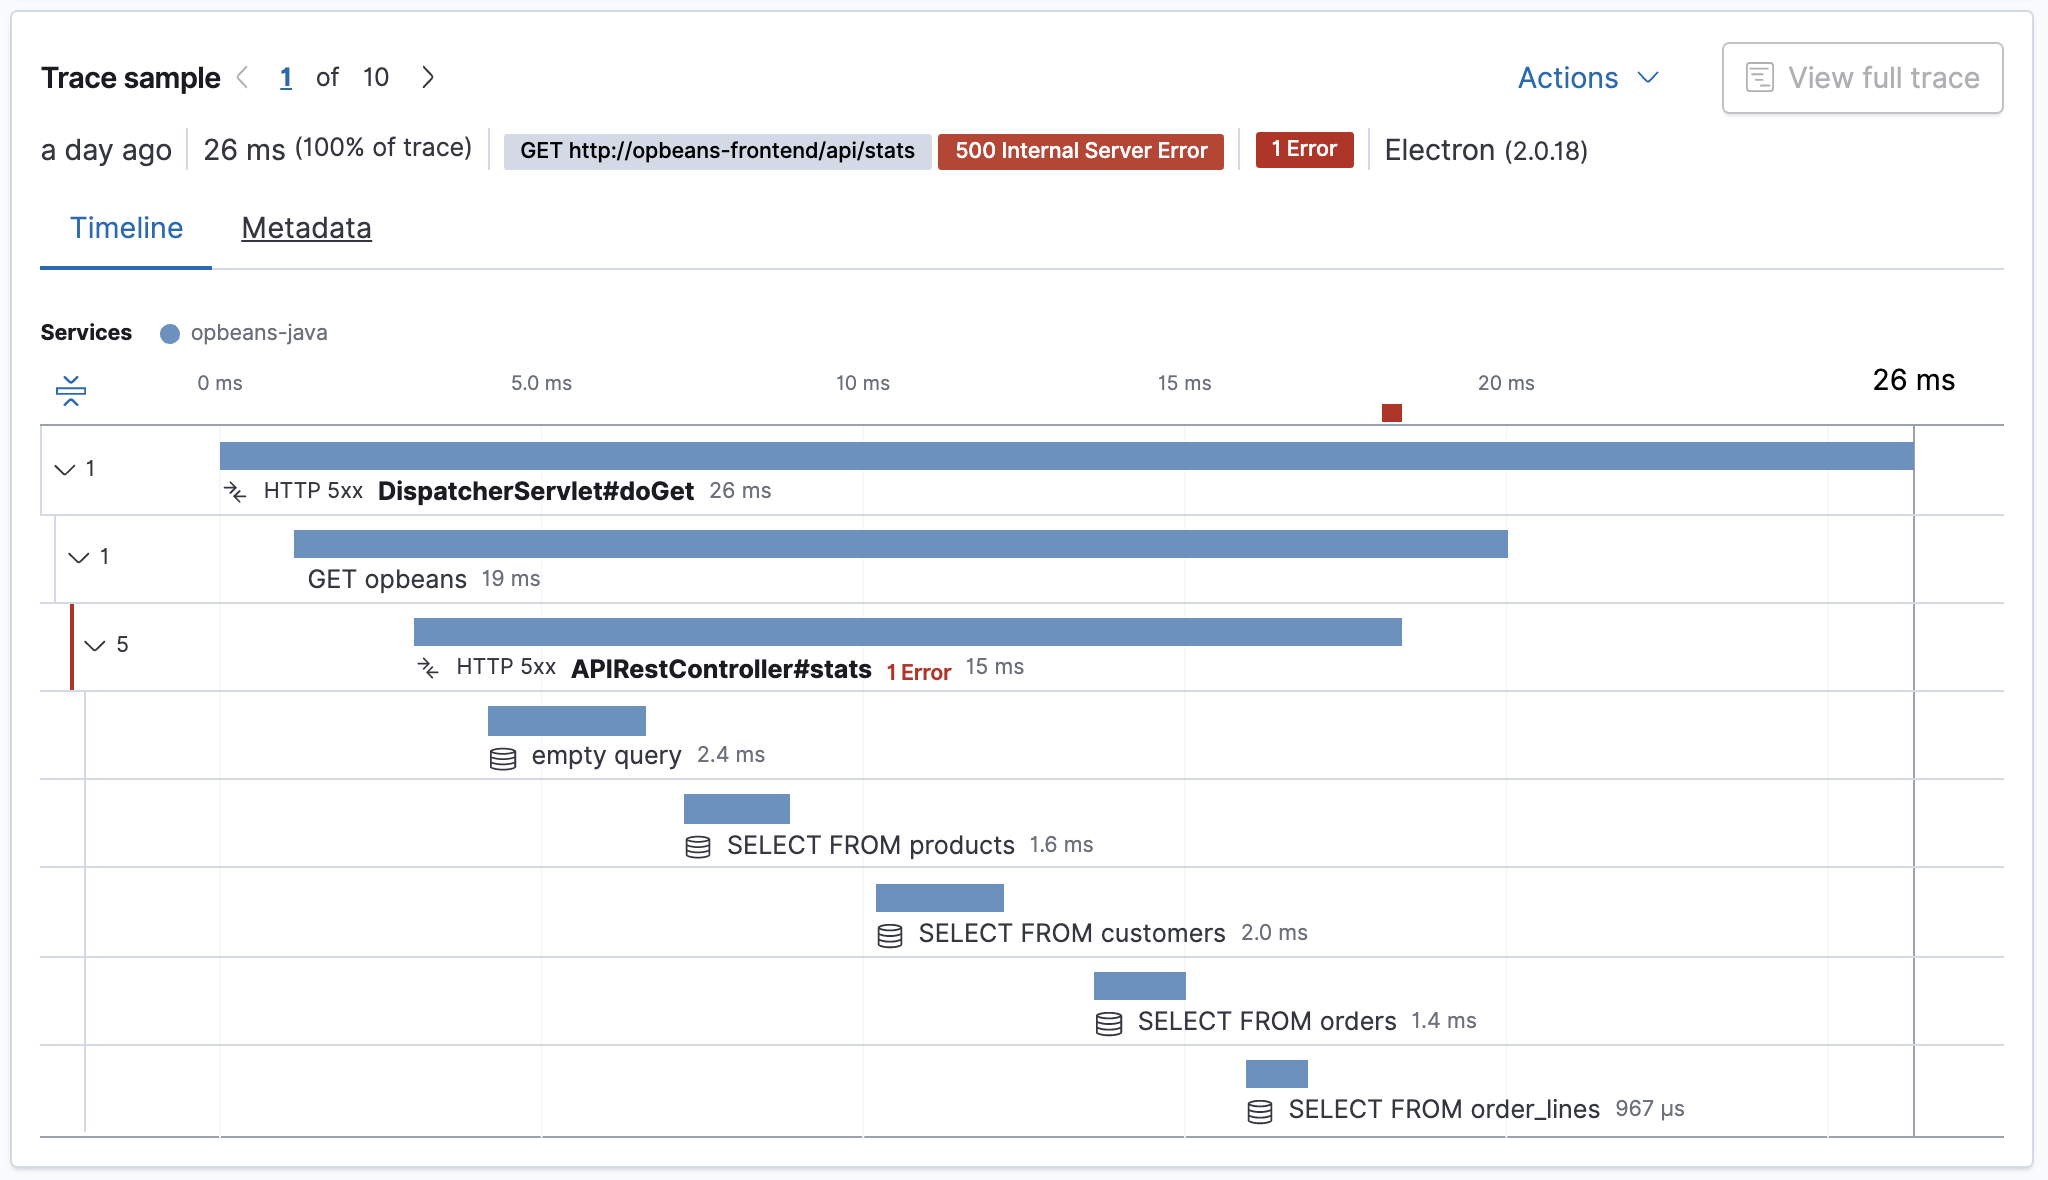
One example where you may want to make use of Discover is to view all transactions for an endpoint instead of just a sample.
Starting in v7.6, you can view ten samples per bucket in the Applications UI, instead of just one.
Use the Applications UI to find a transaction name and time bucket that you’re interested in learning more about. Then, switch to Discover and make a search:
processor.event: "transaction" AND transaction.name: "<TRANSACTION_NAME_HERE>" and transaction.duration.us > 13000 and transaction.duration.us < 14000`
In this example, we’re interested in viewing all of the APIRestController#customers transactions
that took between 13 and 14 milliseconds. Here’s what Discover returns:
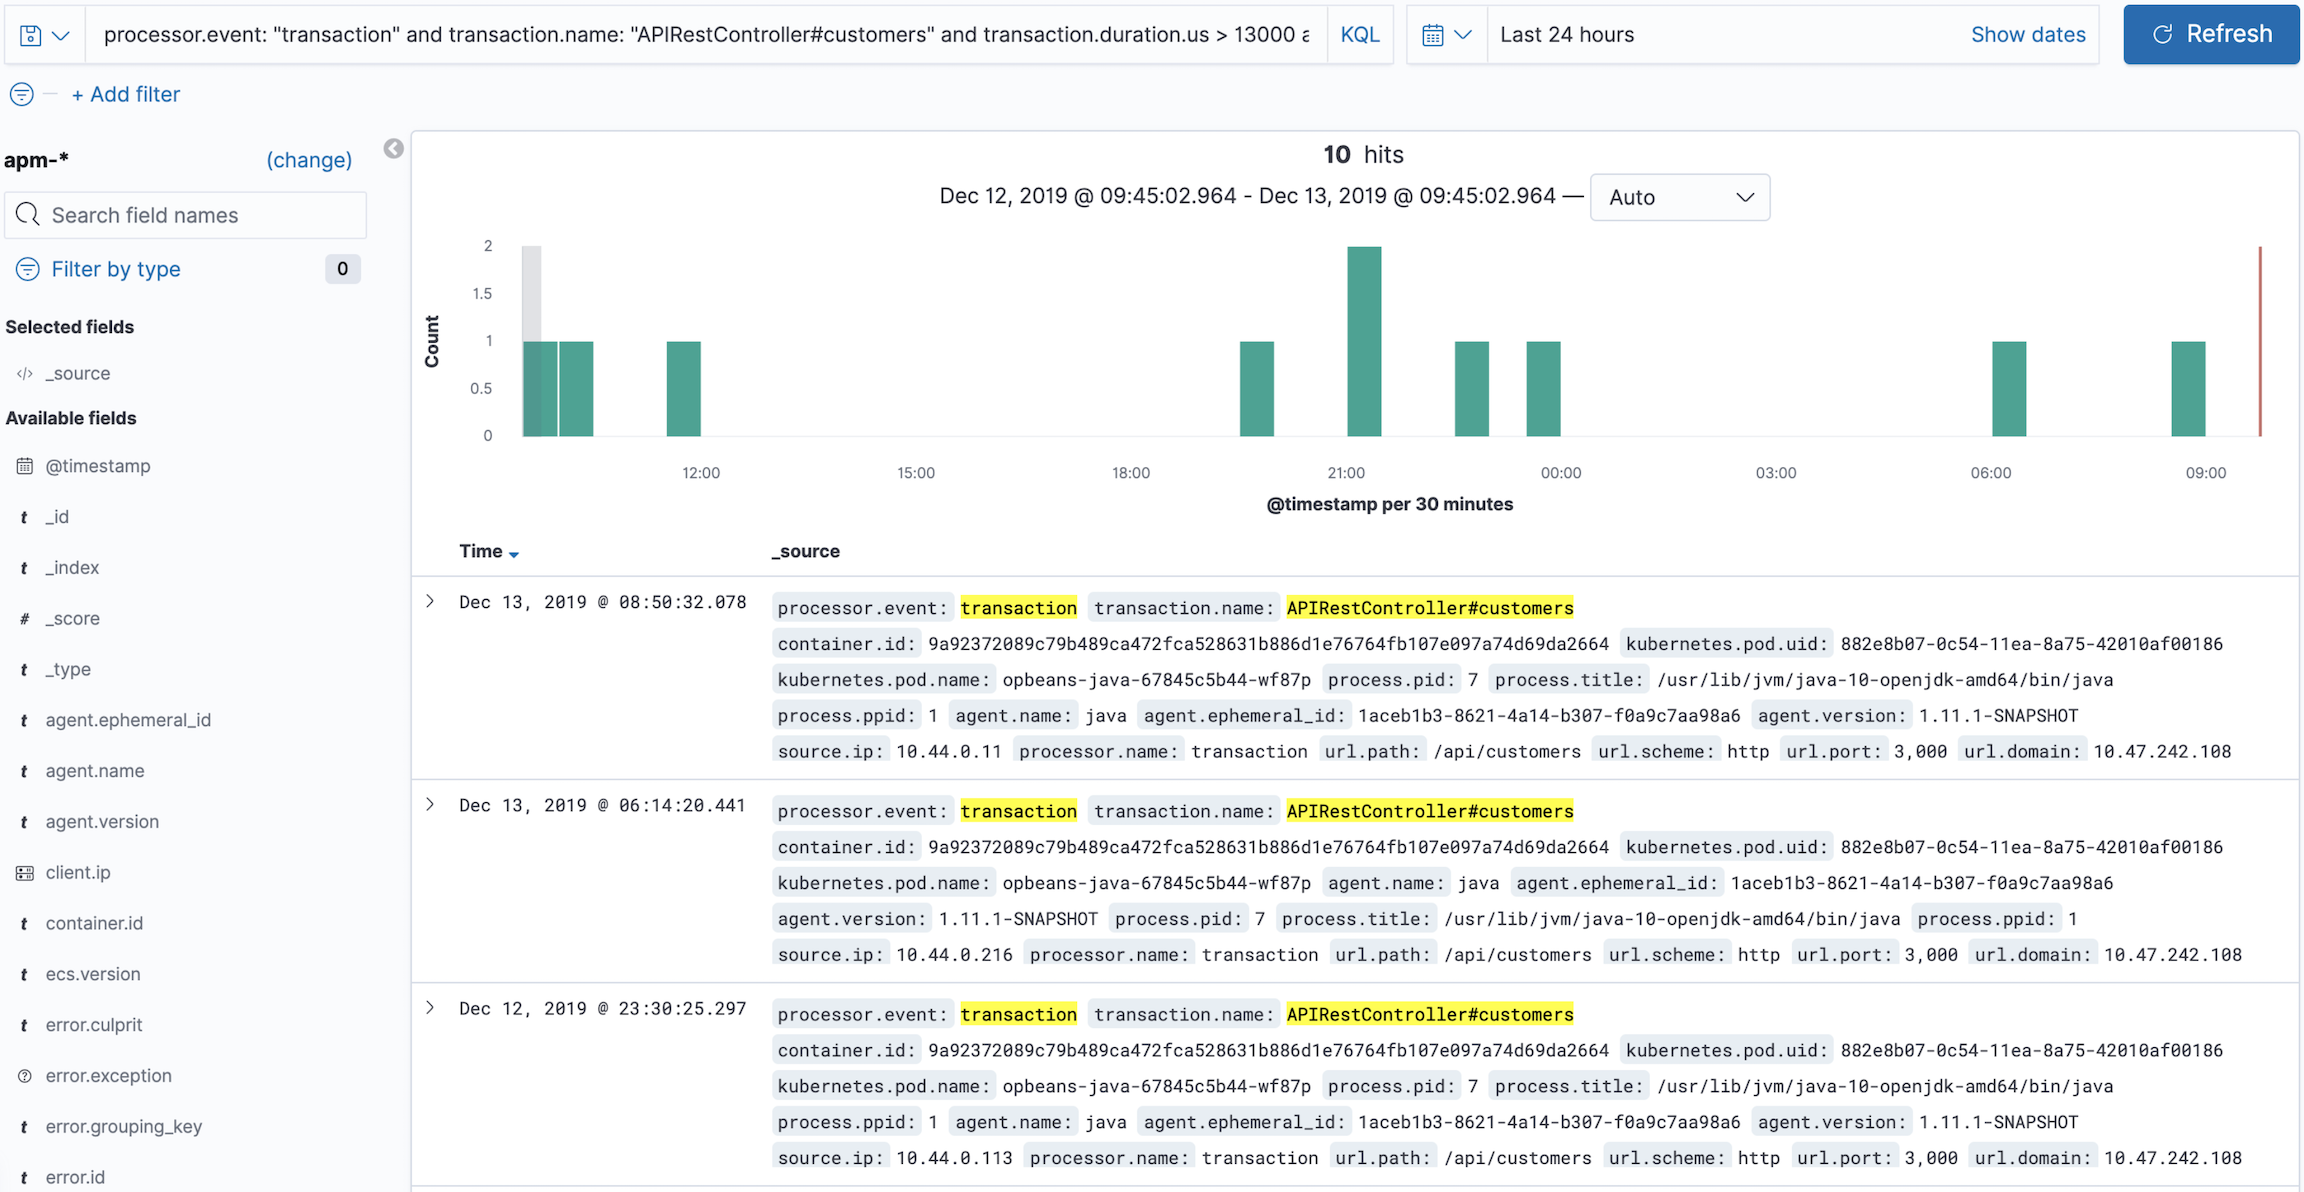
You can now explore the data until you find a specific transaction that you’re interested in.
Copy that transaction’s transaction.id and paste it into the Applications UI to view the data in the context of the Applications UI: