This documentation contains work-in-progress information for future Elastic Stack and Cloud releases. Use the version selector to view supported release docs. It also contains some Elastic Cloud serverless information. Check out our serverless docs for more details.
Logs
editLogs
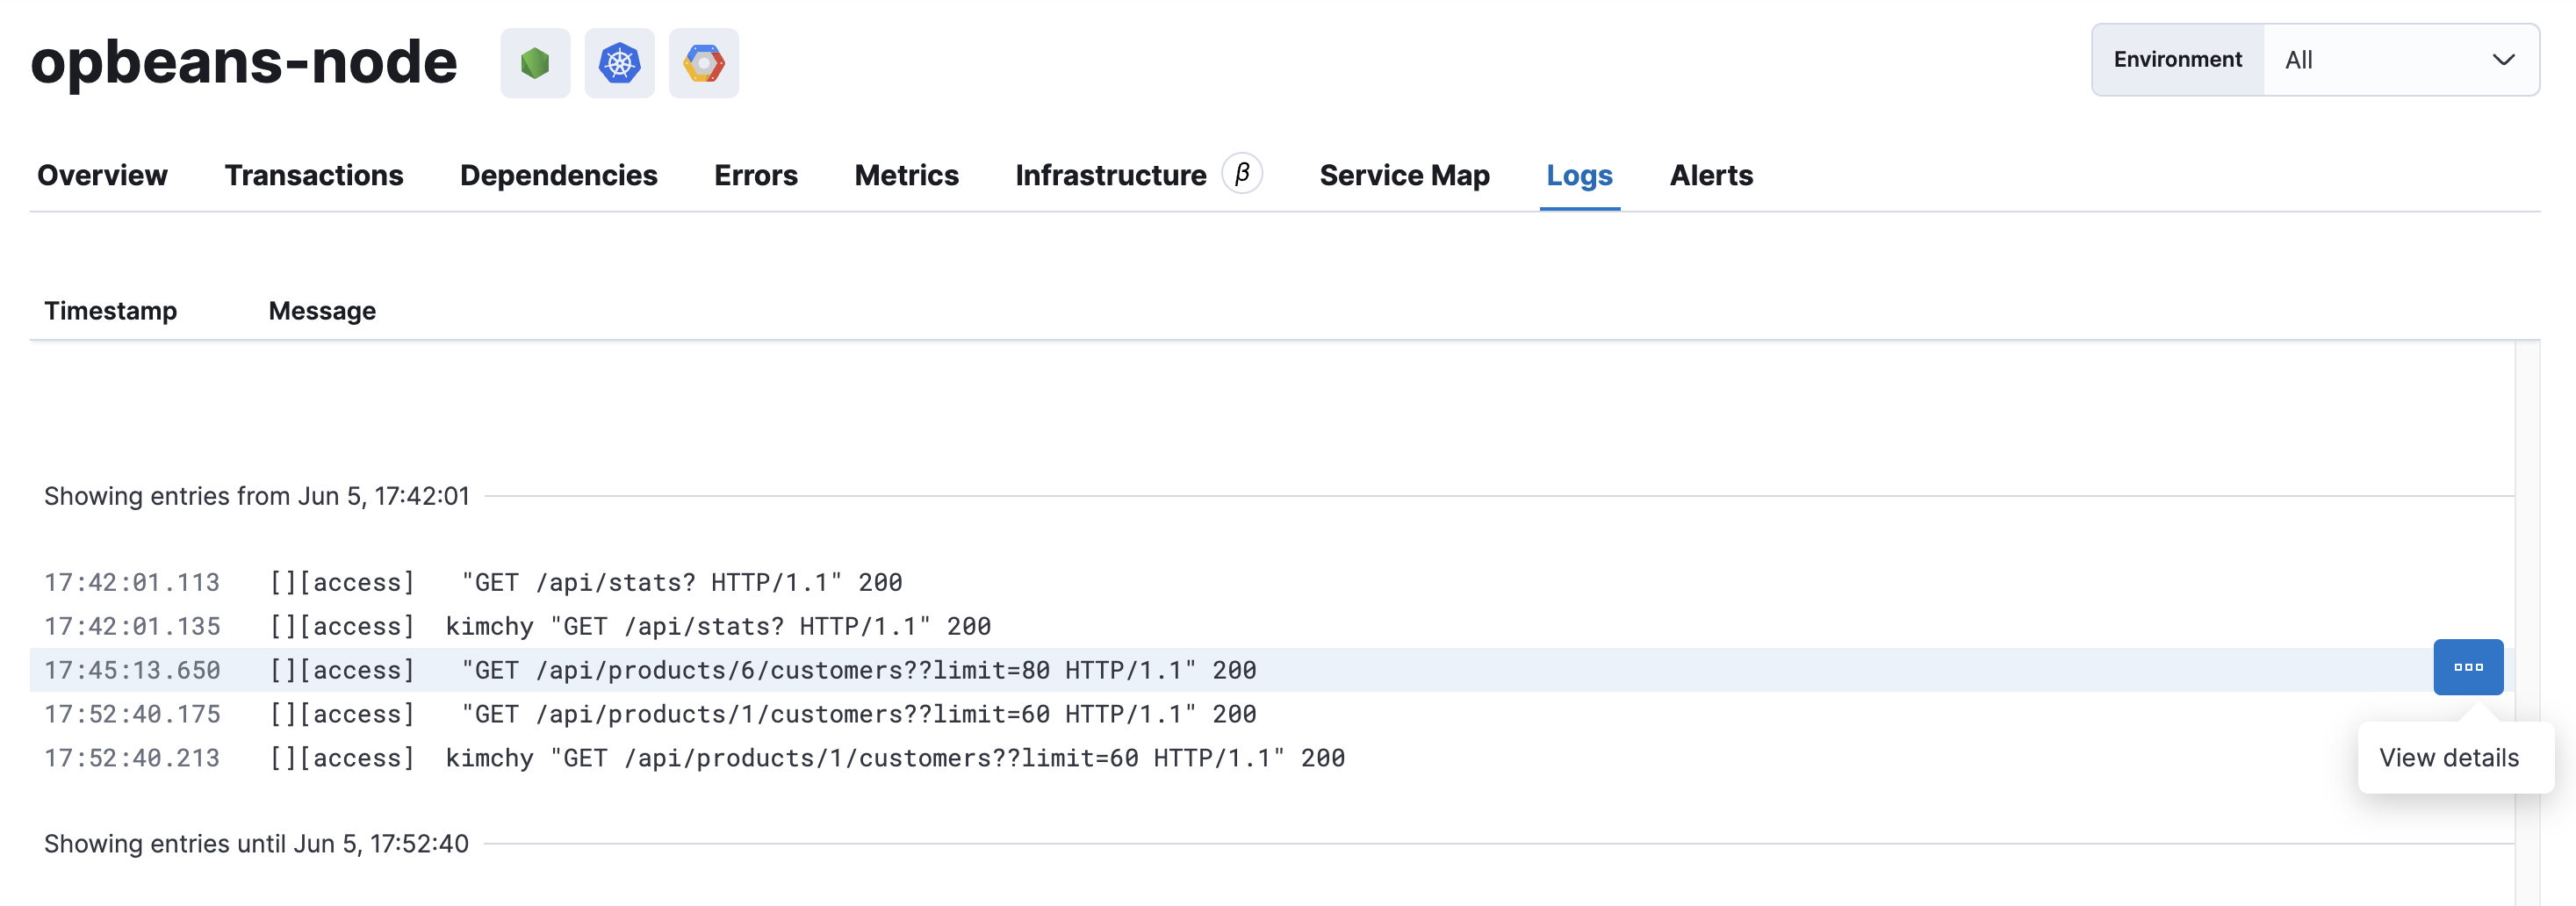
editThe Logs tab shows contextual logs for the selected service.
Logs provide detailed information about specific events, and are crucial to successfully debugging slow or erroneous transactions.
If you’ve correlated your application’s logs and traces, you never have to search for relevant data; it’s already available to you. Viewing log and trace data together allows you to quickly diagnose and solve problems.
To learn how to correlate your logs with your instrumented services, see log correlation

Logs displayed on this page are filtered on service.name
Integrate with logging frameworks
editElastic APM integrates with popular logging frameworks, making it easy to correlate your logs and traces. This enables you to:
- View the context of a log and the parameters provided by a user
- View all logs belonging to a particular trace
- Easily move between logs and traces when debugging application issues
See the Stream application logs guide to get started.