Triage threshold breaches
editTriage threshold breaches
editThreshold breaches occur when an Observability data type reaches or exceeds the threshold set in your custom threshold rule.
For example, you might have a custom threshold rule that triggers an alert when the total number of log documents with a log level of error reaches 100.
To triage issues quickly, go to the alert details page:
- Find Alerts in the main menu or use the global search field.
-
From the Alerts table, click the
 icon next to the alert and select View alert details.
The alert details page shows information about the alert, including when the alert was triggered, the duration of the alert, and the last status update. If there is a "group by" field specified in the rule, the page also includes the source. You can follow the links to navigate to the rule definition.
Explore charts on the page to learn more about the threshold breach:
-
Charts for each condition. The page includes a chart for each condition specified in the rule. These charts help you understand when the breach occurred and its severity.
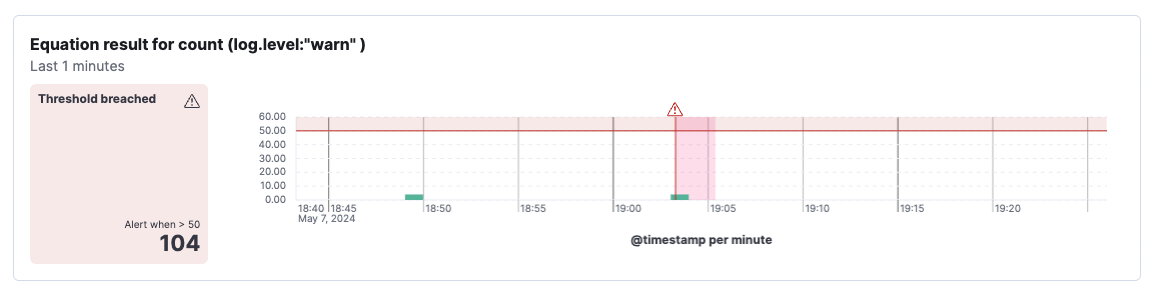
The timeline is annotated to show when the threshold was breached. You can hover over an alert icon to see the timestamp of the alert.
-
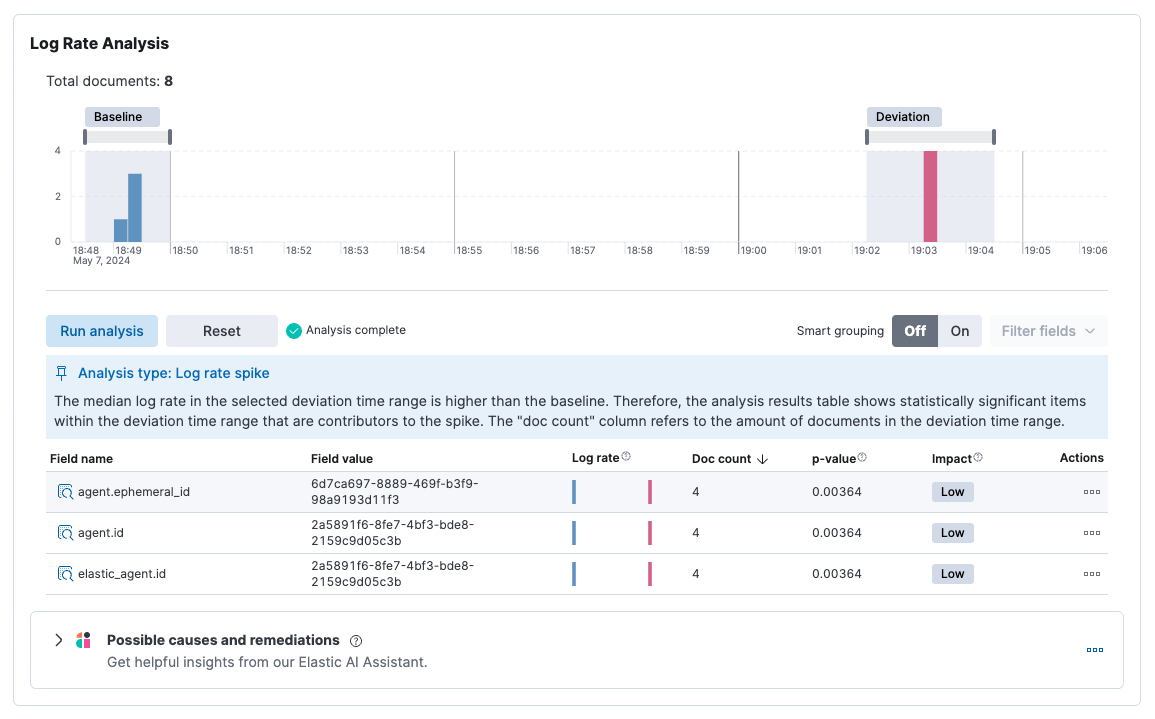
Log rate analysis chart. If your rule is intended to detect log threshold breaches (that is, it has a single condition that uses a count aggregation), you can run a log rate analysis, assuming you have the required license. Running a log rate analysis is useful for detecting significant dips or spikes in the number of logs. Notice that you can adjust the baseline and deviation, and then run the analysis again. For more information about using the log rate analysis feature, refer to the AIOps Labs documentation.
-
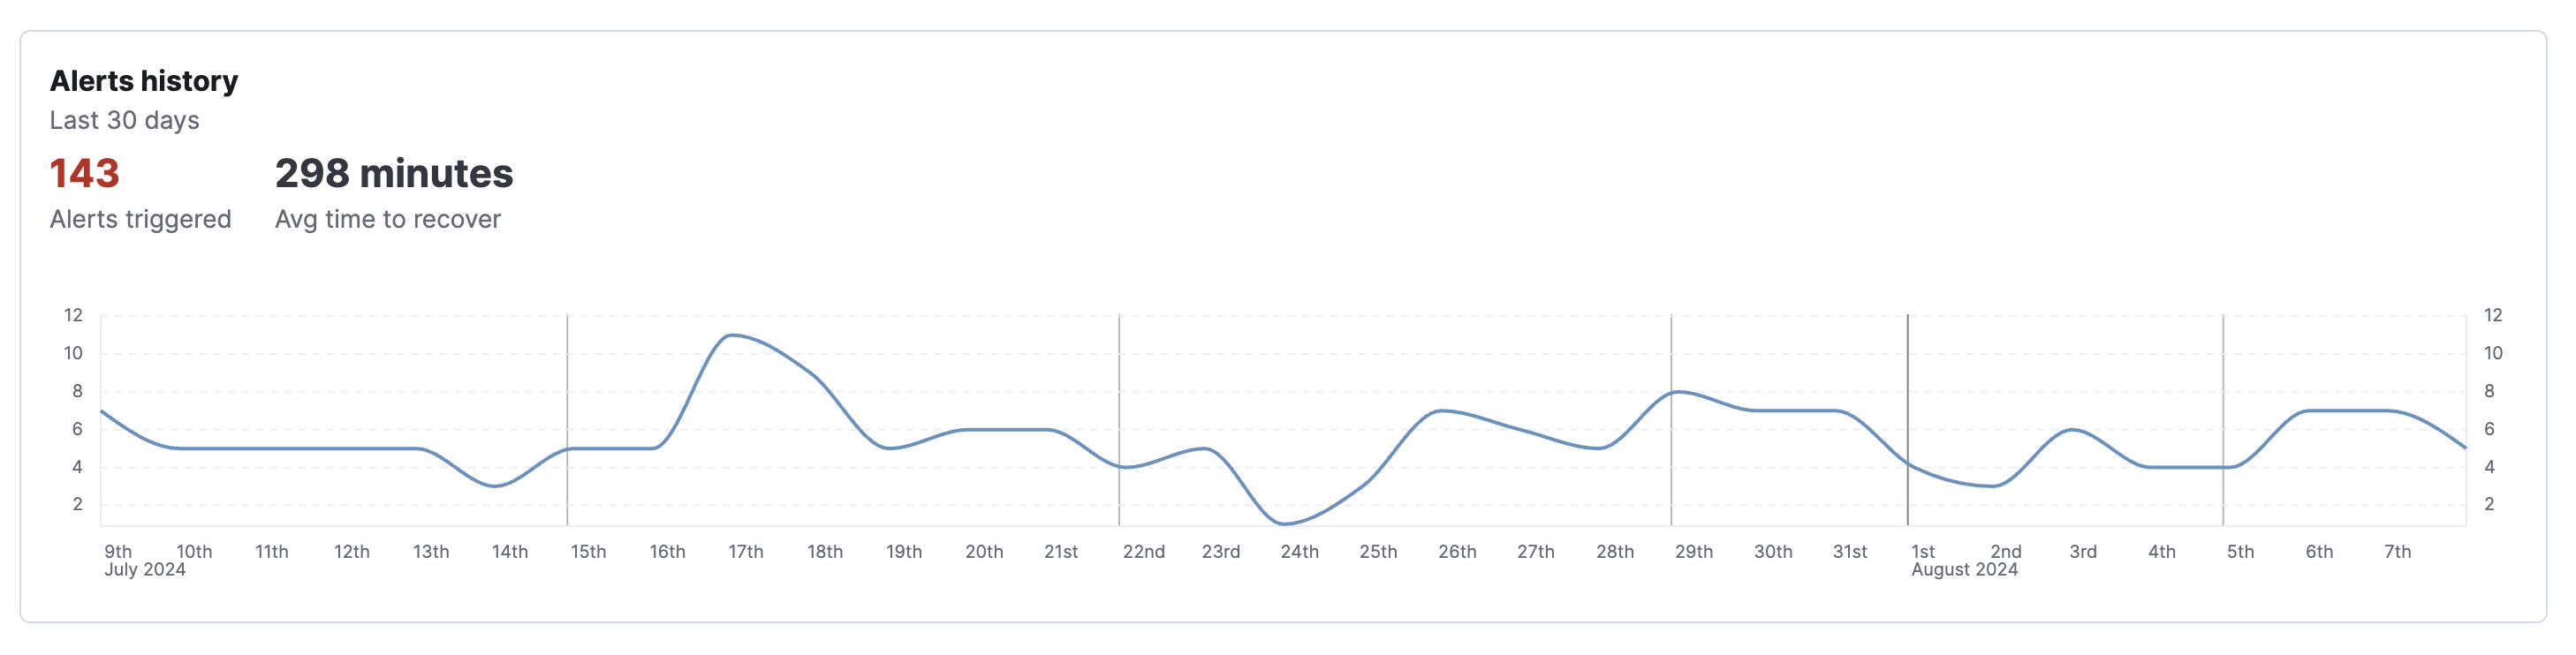
Alerts history chart. The next chart provides information about alerts for the same rule and group over the last 30 days. It shows the number of those alerts that were triggered per day, the total number of alerts triggered throughout the 30 days, and the average time it took to recover after a breach.
Analyze these charts to better understand when the breach started, it’s current state, and how the issue is trending.
After investigating the alert, you may want to:
- Click Snooze the rule to snooze notifications for a specific time period or indefinitely.
-
Click the
 icon and select Add to case to add the alert to a new or existing case. To learn more, refer to Cases.
-
Click the icon and select Mark as untracked.
When an alert is marked as untracked, actions are no longer generated.
You can choose to move active alerts to this state when you disable or delete rules.