Ingest data to Elastic Security
editIngest data to Elastic Security
editTo ingest data, you can use:
- The Elastic Agent with the Elastic Defend integration, which protects your hosts and sends logs, metrics, and endpoint security data to Elastic Security. See Install and configure the Elastic Defend integration.
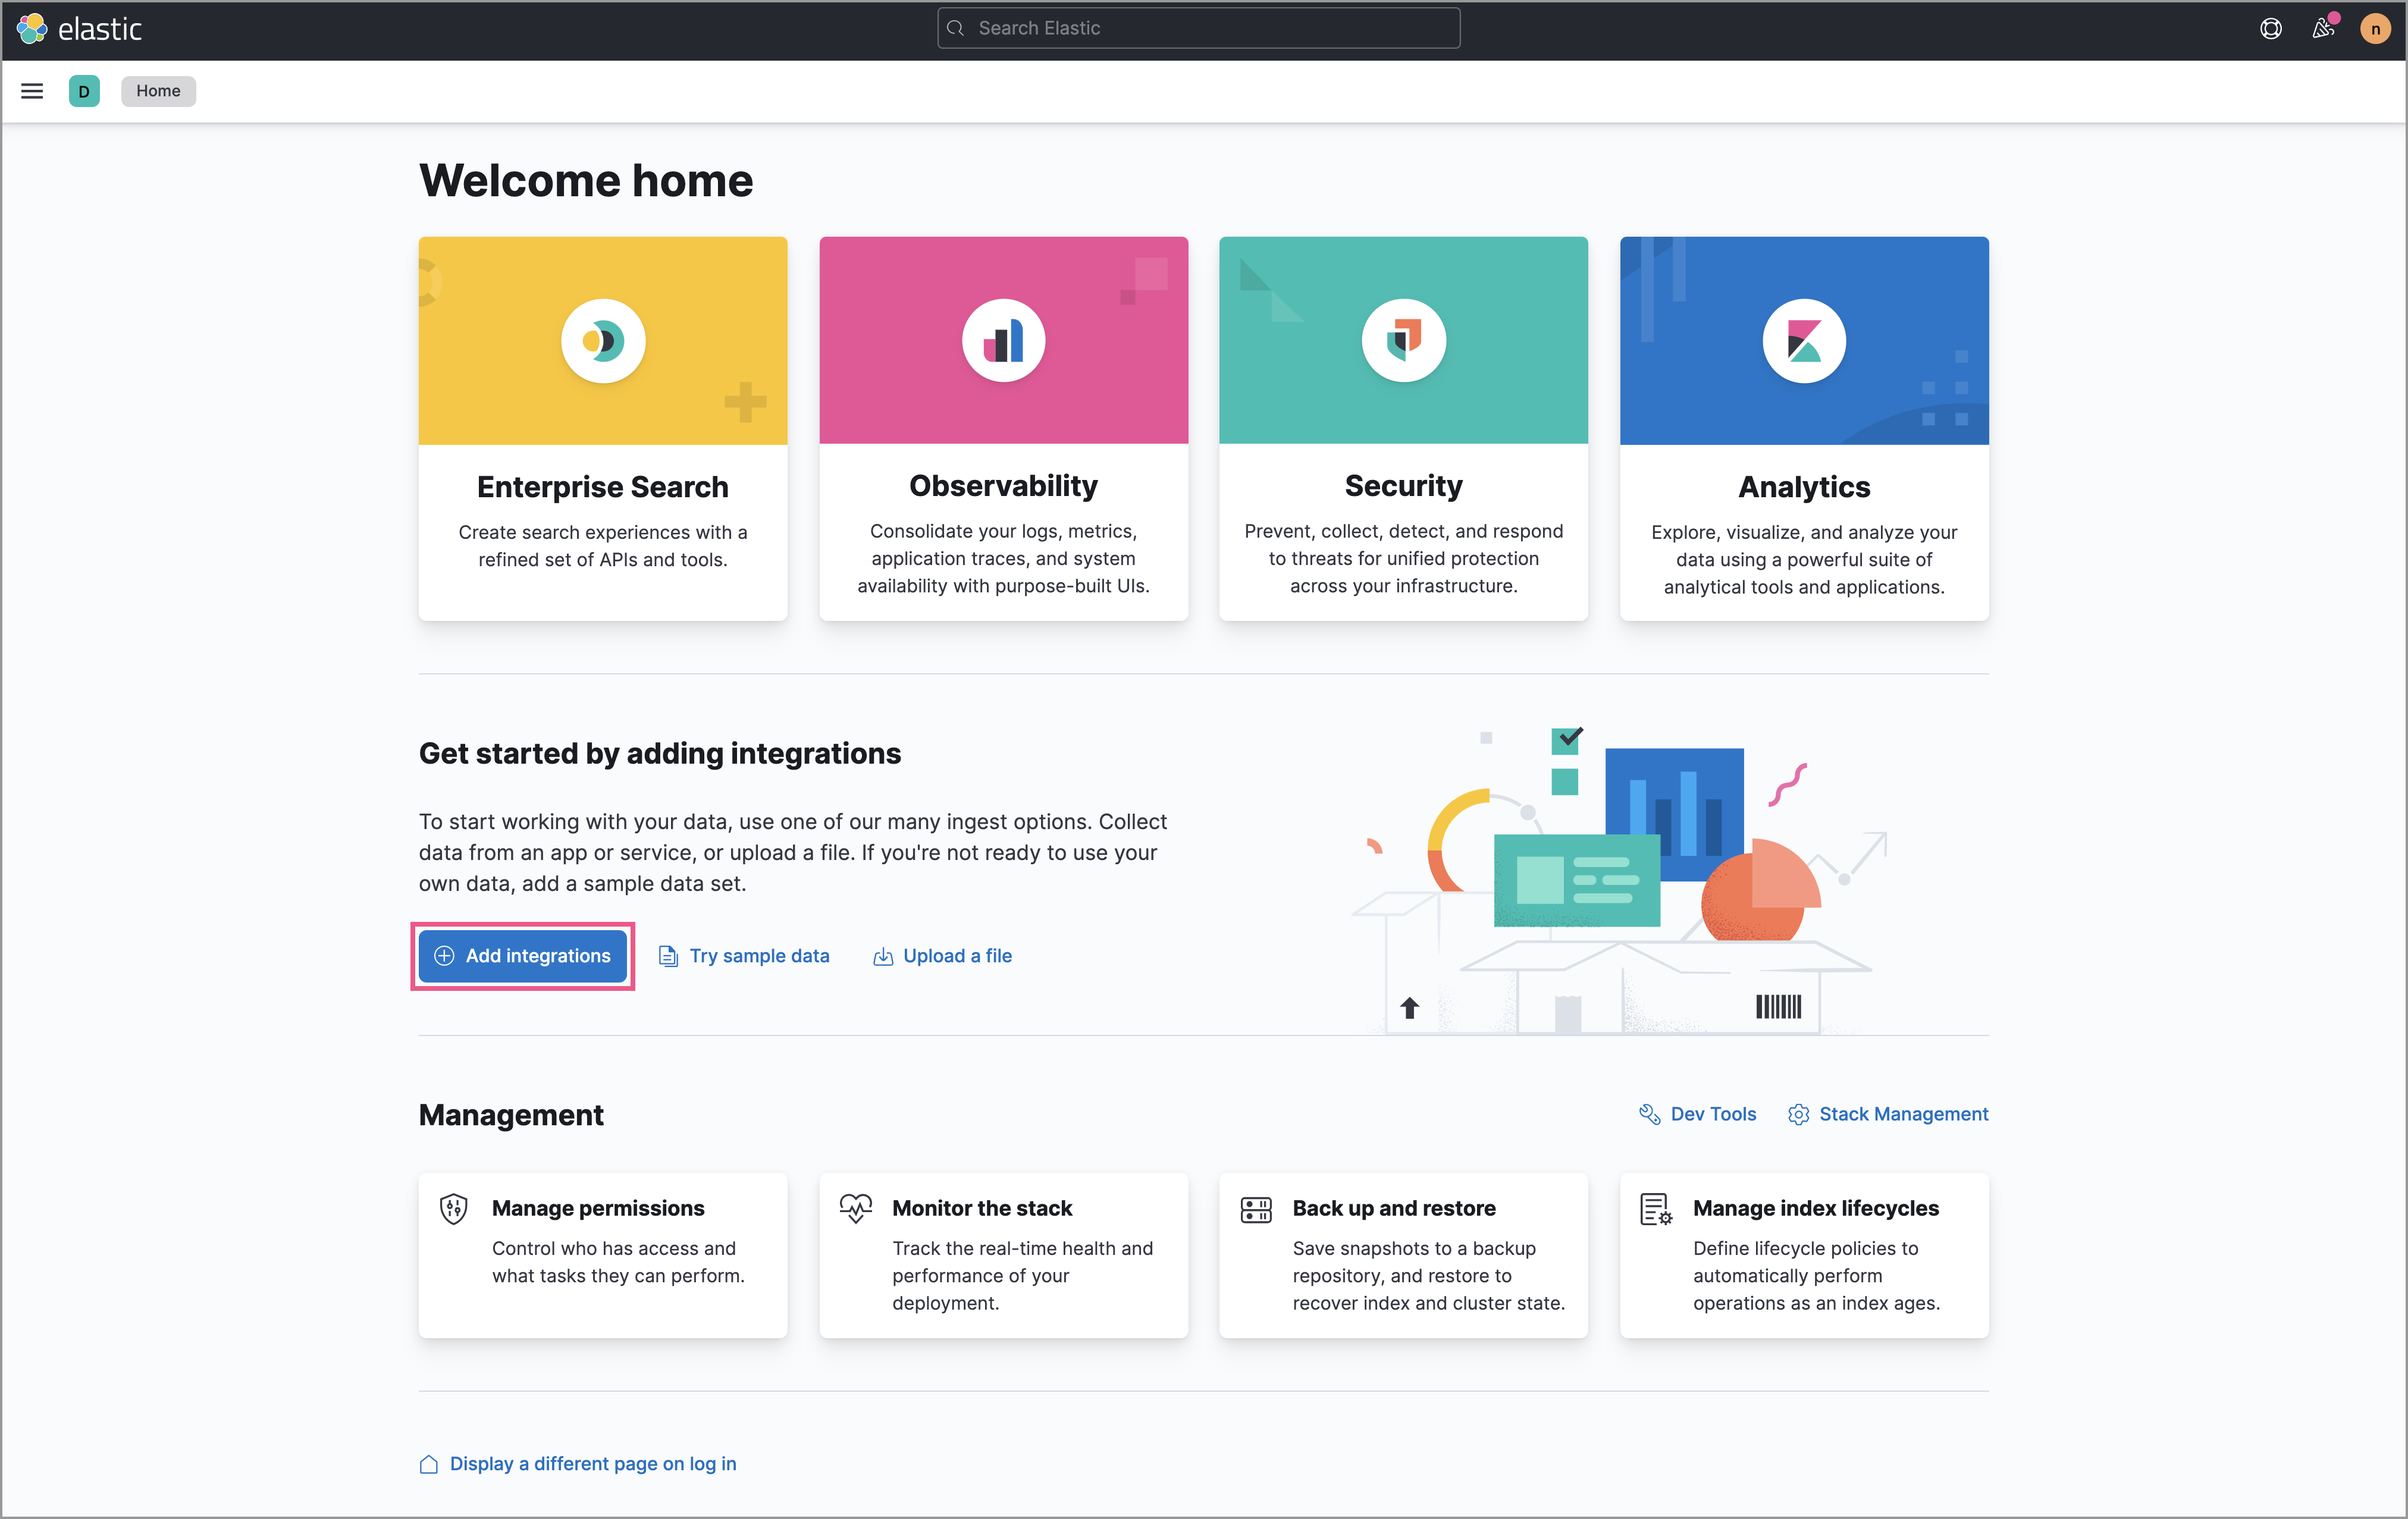
- The Elastic Agent with integrations, which are available in the Elastic Package Registry (EPR). To install an integration that works with Elastic Security, go to the Kibana Home page or main navigation menu and click Add integrations. On the Integrations page, click the Security category filter, then select an integration to view the installation instructions. For more information on integrations, refer to Integrations.
- Beats shippers installed for each system you want to monitor.
- The Elastic Agent to send data from Splunk to Elastic Security. See Get started with data from Splunk.
- Third-party collectors configured to ship ECS-compliant data. Elastic Security ECS field reference provides a list of ECS fields used in Elastic Security.
If you use a third-party collector to ship data to Elastic Security, you must
map its fields to the Elastic Common Schema (ECS). Additionally,
you must add its index to the Elastic Security indices (open the main menu, then go to Stack Management → Advanced Settings → securitySolution:defaultIndex).
Elastic Security uses the host.name ECS field as the
primary key for identifying hosts.
The Elastic Agent with the Elastic Defend integration ships these data sources:
- Process - Linux, macOS, Windows
- Network - Linux, macOS, Windows
- File - Linux, macOS, Windows
- DNS - Windows
- Registry - Windows
- DLL and Driver Load - Windows
- Security - Windows
Install Beats shippers
editTo add hosts and populate Elastic Security with network security events, you need to install and configure Beats on the hosts from which you want to ingest security events:
- Filebeat for forwarding and centralizing logs and files
- Auditbeat for collecting security events
- Winlogbeat for centralizing Windows event logs
- Packetbeat for analyzing network activity
You can install Beats using the Kibana UI guide or directly from the command line.
Install Beats using the Kibana UI guide
editWhen you add integrations that use Beats, you’re guided through the Beats installation process. To begin, go to the Home page, click Add integrations, and then follow the links for the types of data you want to collect.
On the Integrations page, you can select the Beats only filter to only view integrations using Beats.

Download and install Beats from the command line
editTo install Beats, see these installation guides:
Enable modules and configuration options
editNo matter how you installed Beats, you need to enable modules in Auditbeat and Filebeat to populate Elastic Security with data.
For a full list of security-related beat modules, click here.
To populate Hosts data, enable these modules:
-
Auditbeat system module - Linux, macOS, Windows:
- packages
- processes
- logins
- sockets
- users and groups
- Auditbeat auditd module - Linux kernel audit events
- Auditbeat file integrity module - Linux, macOS, Windows
- Filebeat system module - Linux system logs
- Filebeat Santa module - macOS security events
- Winlogbeat - Windows event logs
To populate Network data, enable Packetbeat protocols and Filebeat modules: