Overview dashboard
editOverview dashboard
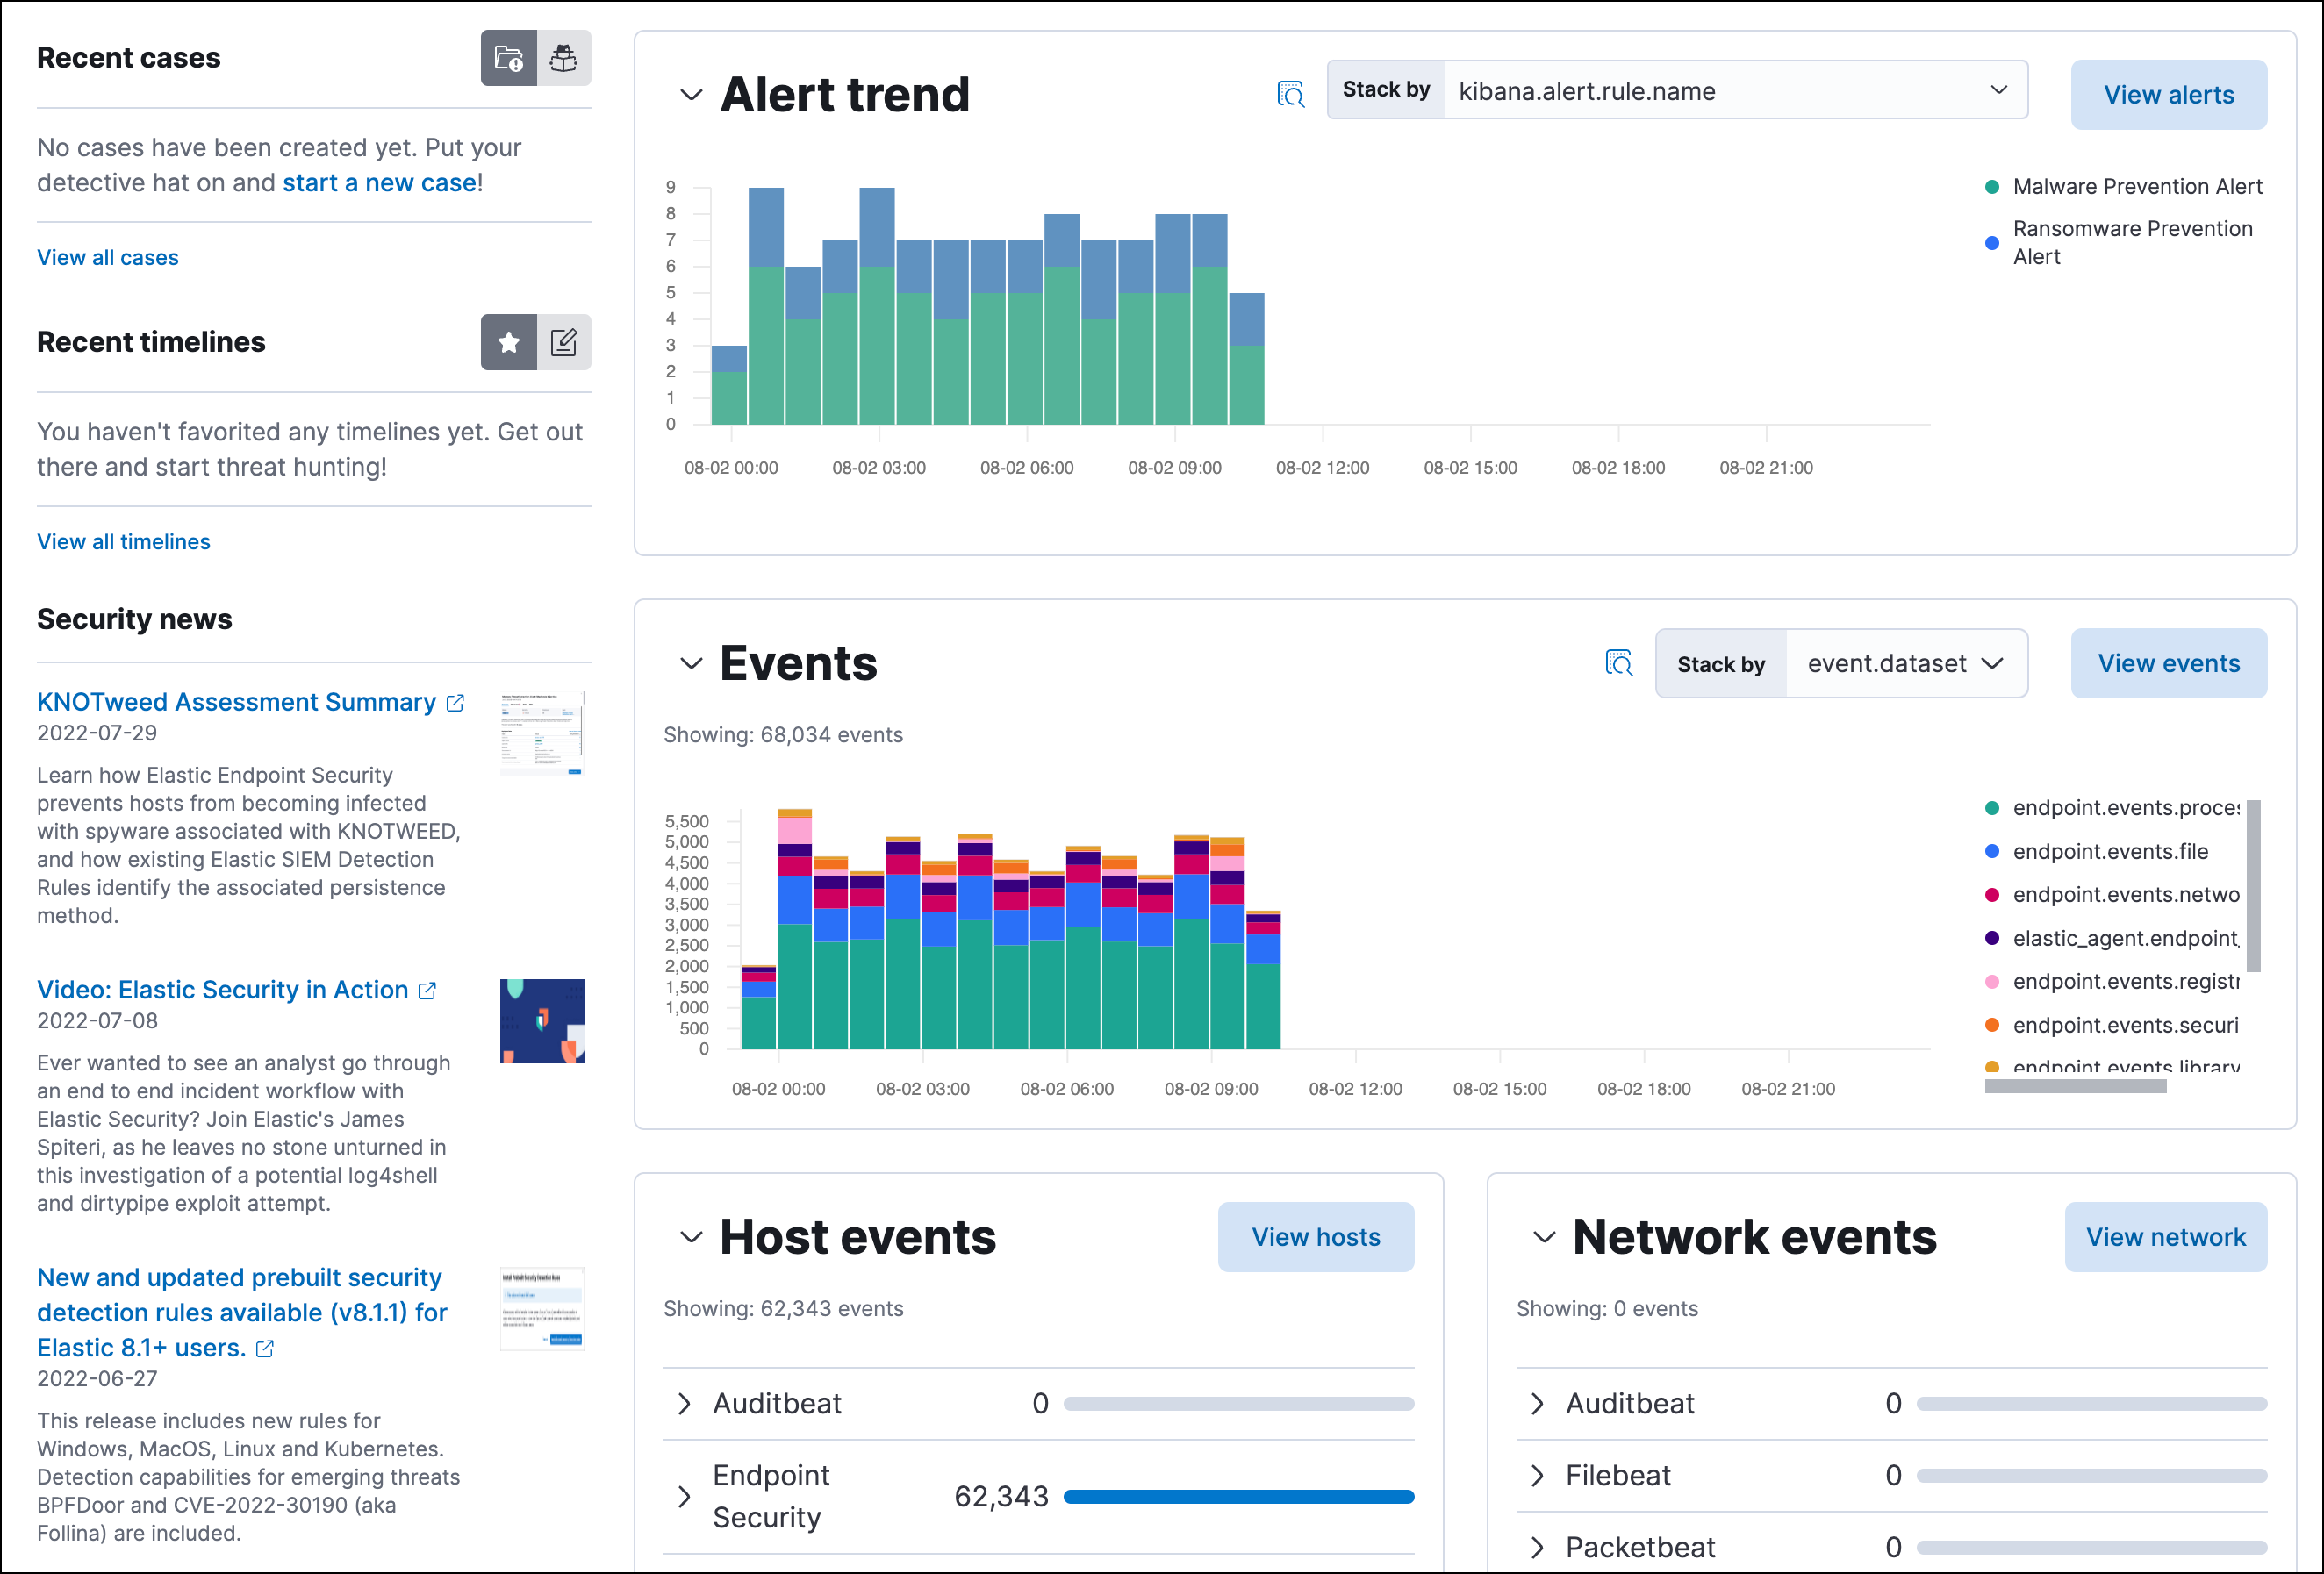
editThe Overview dashboard provides a high-level snapshot of alerts and events. It helps you assess overall system health and find anomalies that may require further investigation.

Live feed
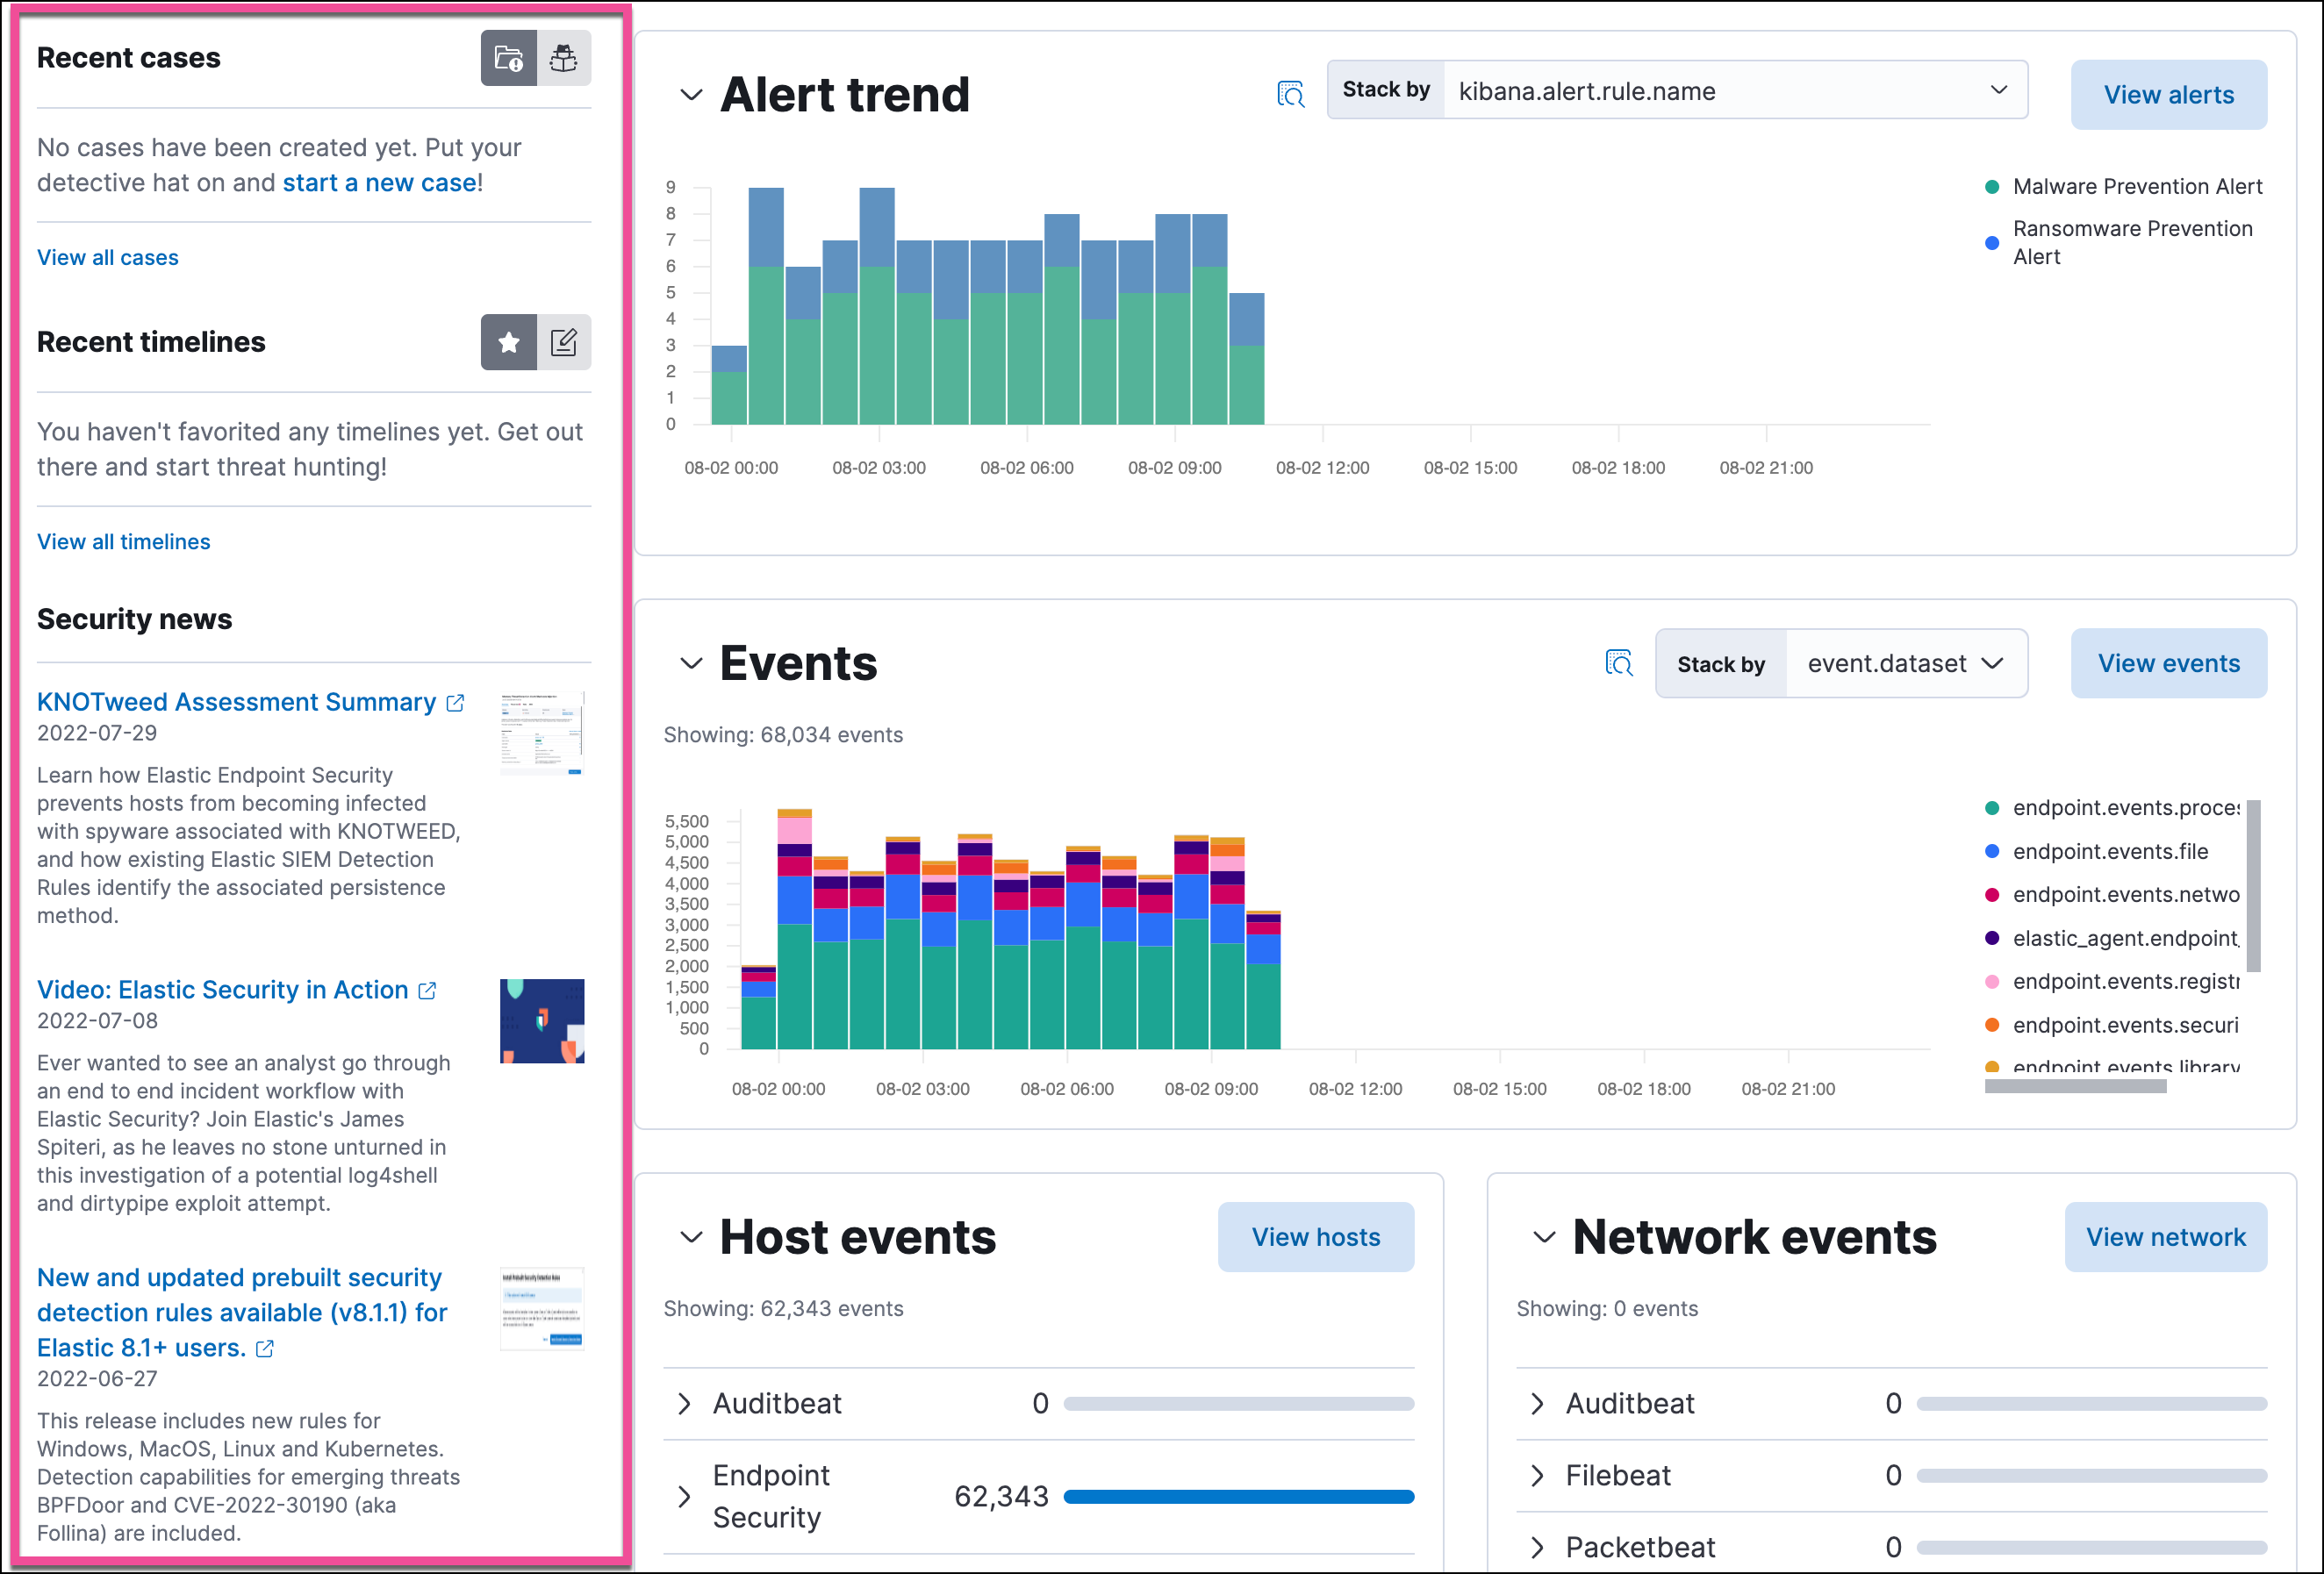
editThe live feed on the Overview dashboard helps you quickly access recently created cases, favorited Timelines, and the latest Elastic Security news.
The Security news section provides the latest Elastic Security news to help you stay informed of new developments, learn about Elastic Security features, and more.

Histograms
editTime-based histograms show the number of detections, alerts, and events that have occurred within the selected time range. To focus on a particular time, click and drag to select a time range, or choose a preset value. The Stack by menu lets you select which field is used to organize the data. For example, in the Alert trend histogram, stack by kibana.alert.rule.name to display alert counts by rule name within the specified time frame.
Many Elastic Security histograms, graphs, and tables contain an Inspect button so you can examine the Elasticsearch queries used to retrieve data throughout the app.
Host and network events
editView event and host counts grouped by data source, such as Auditbeat or Elastic Defend. Expand a category to view specific counts of host or network events from the selected source.

Threat Intelligence
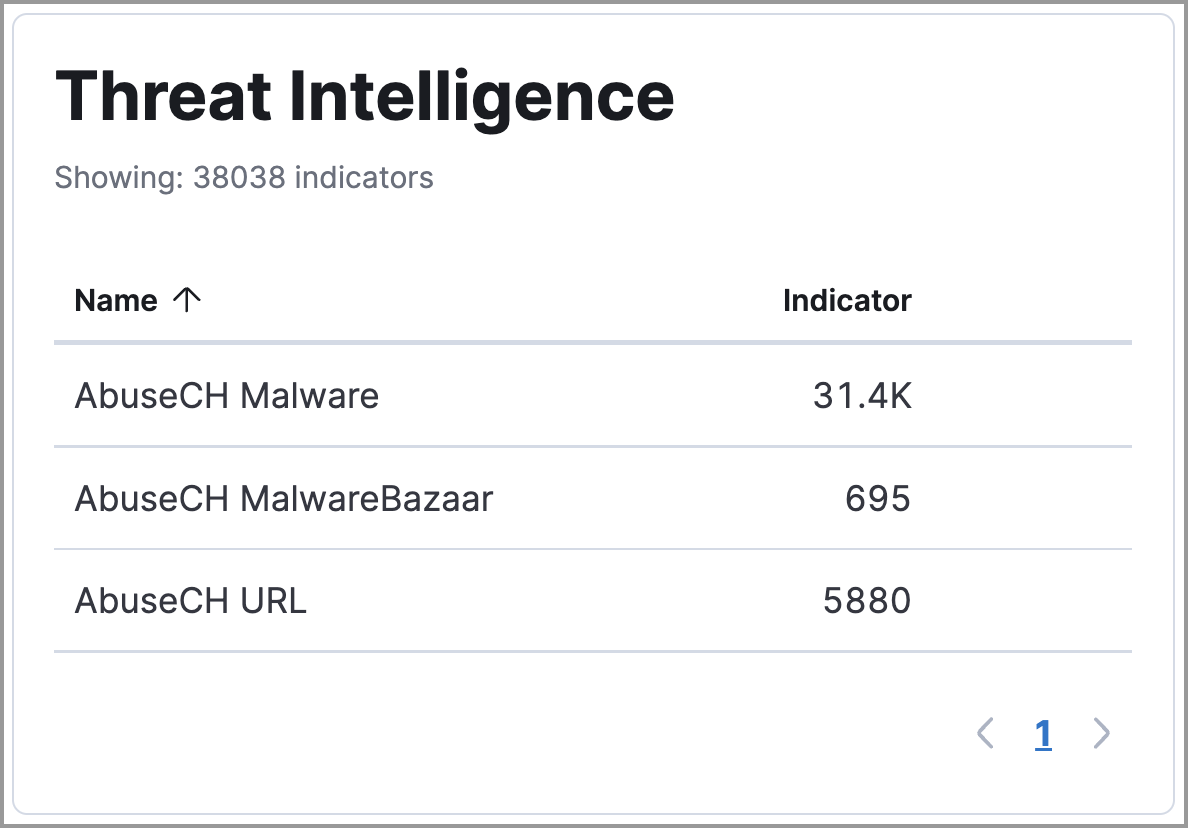
editThe Threat Intelligence view on the Overview dashboard provides streamlined threat intelligence data for threat detection and matching.
The view shows the total number of ingested threat indicators, enabled threat intelligence sources, and ingested threat indicators per source. To visualize the ingested threat indicator data, click the Source link for a threat intelligence source.
For more information about connecting to threat intelligence sources, visit Enable threat intelligence integrations.
