Examine Osquery results
editExamine Osquery results
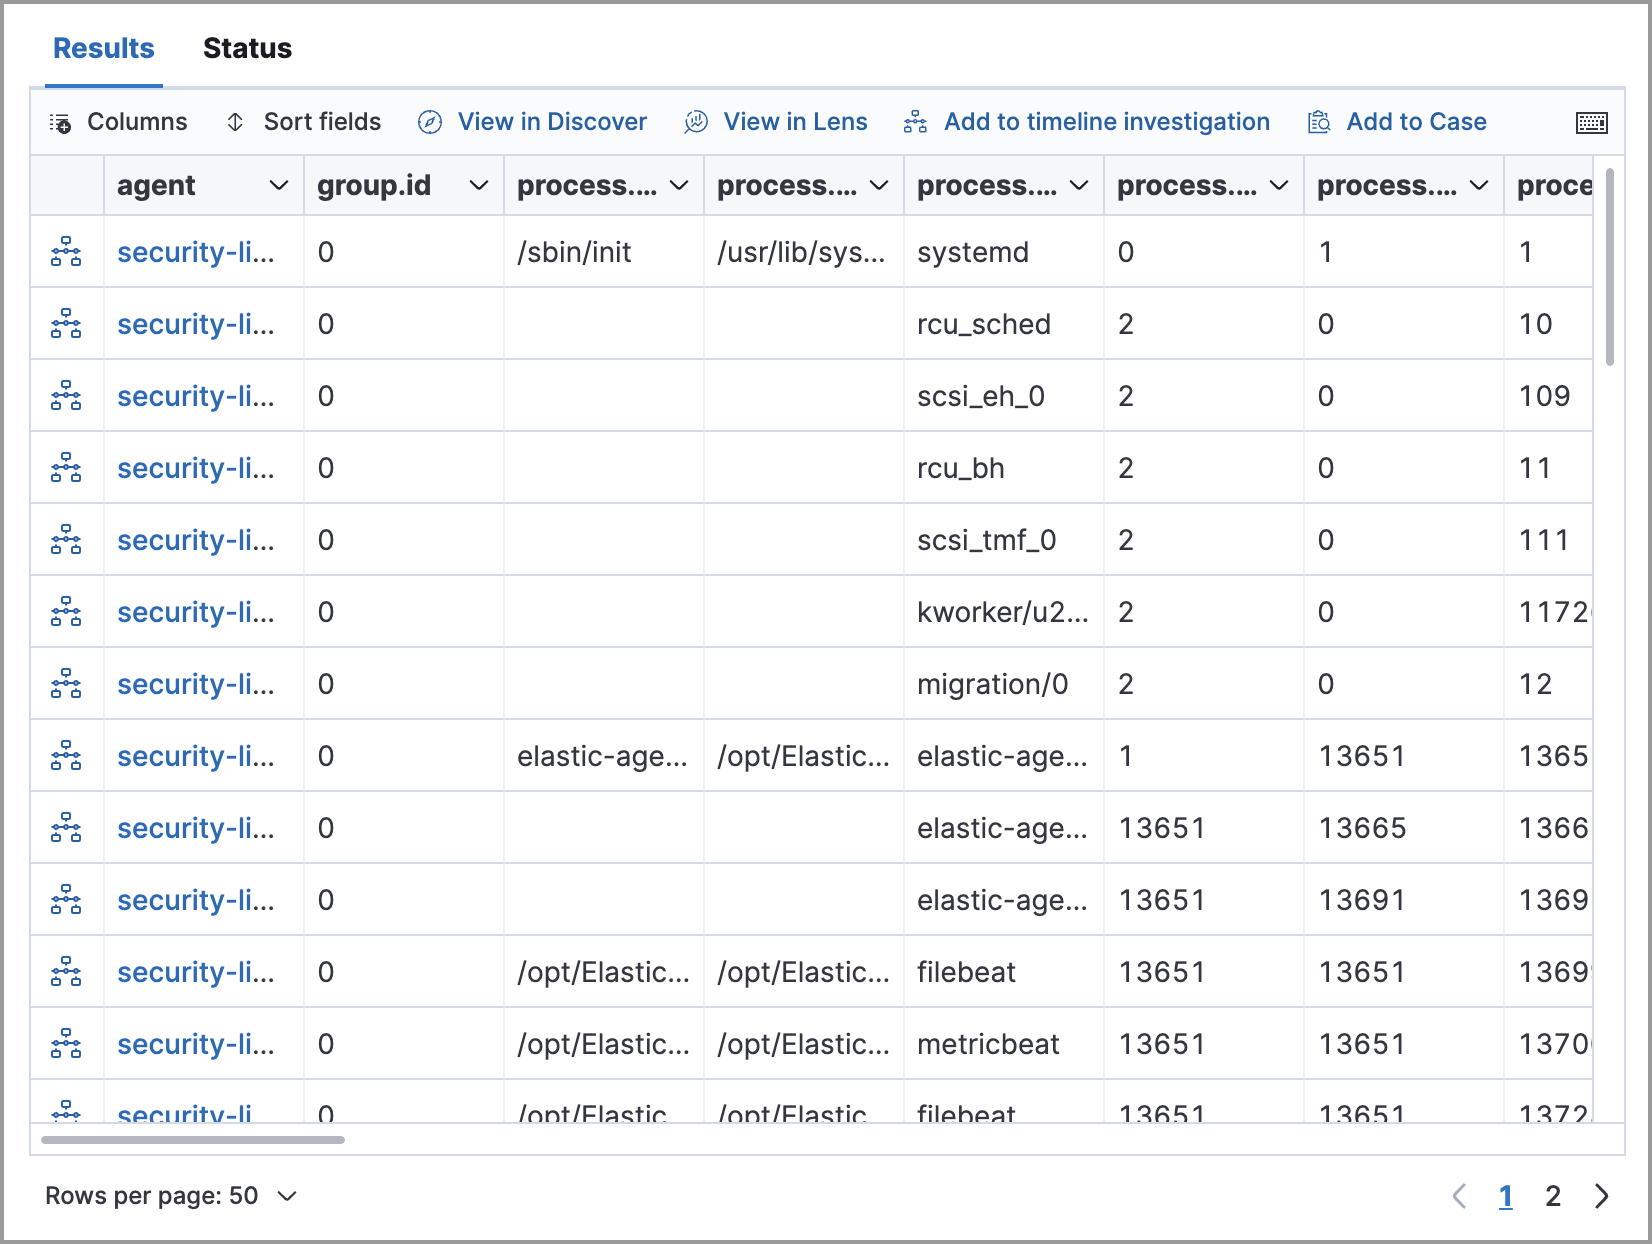
editOsquery provides relevant, timely data that you can use to better understand and monitor your environment. When you run queries, results are indexed and displayed the Results table, which you can filter, sort, and interact with.
Results table
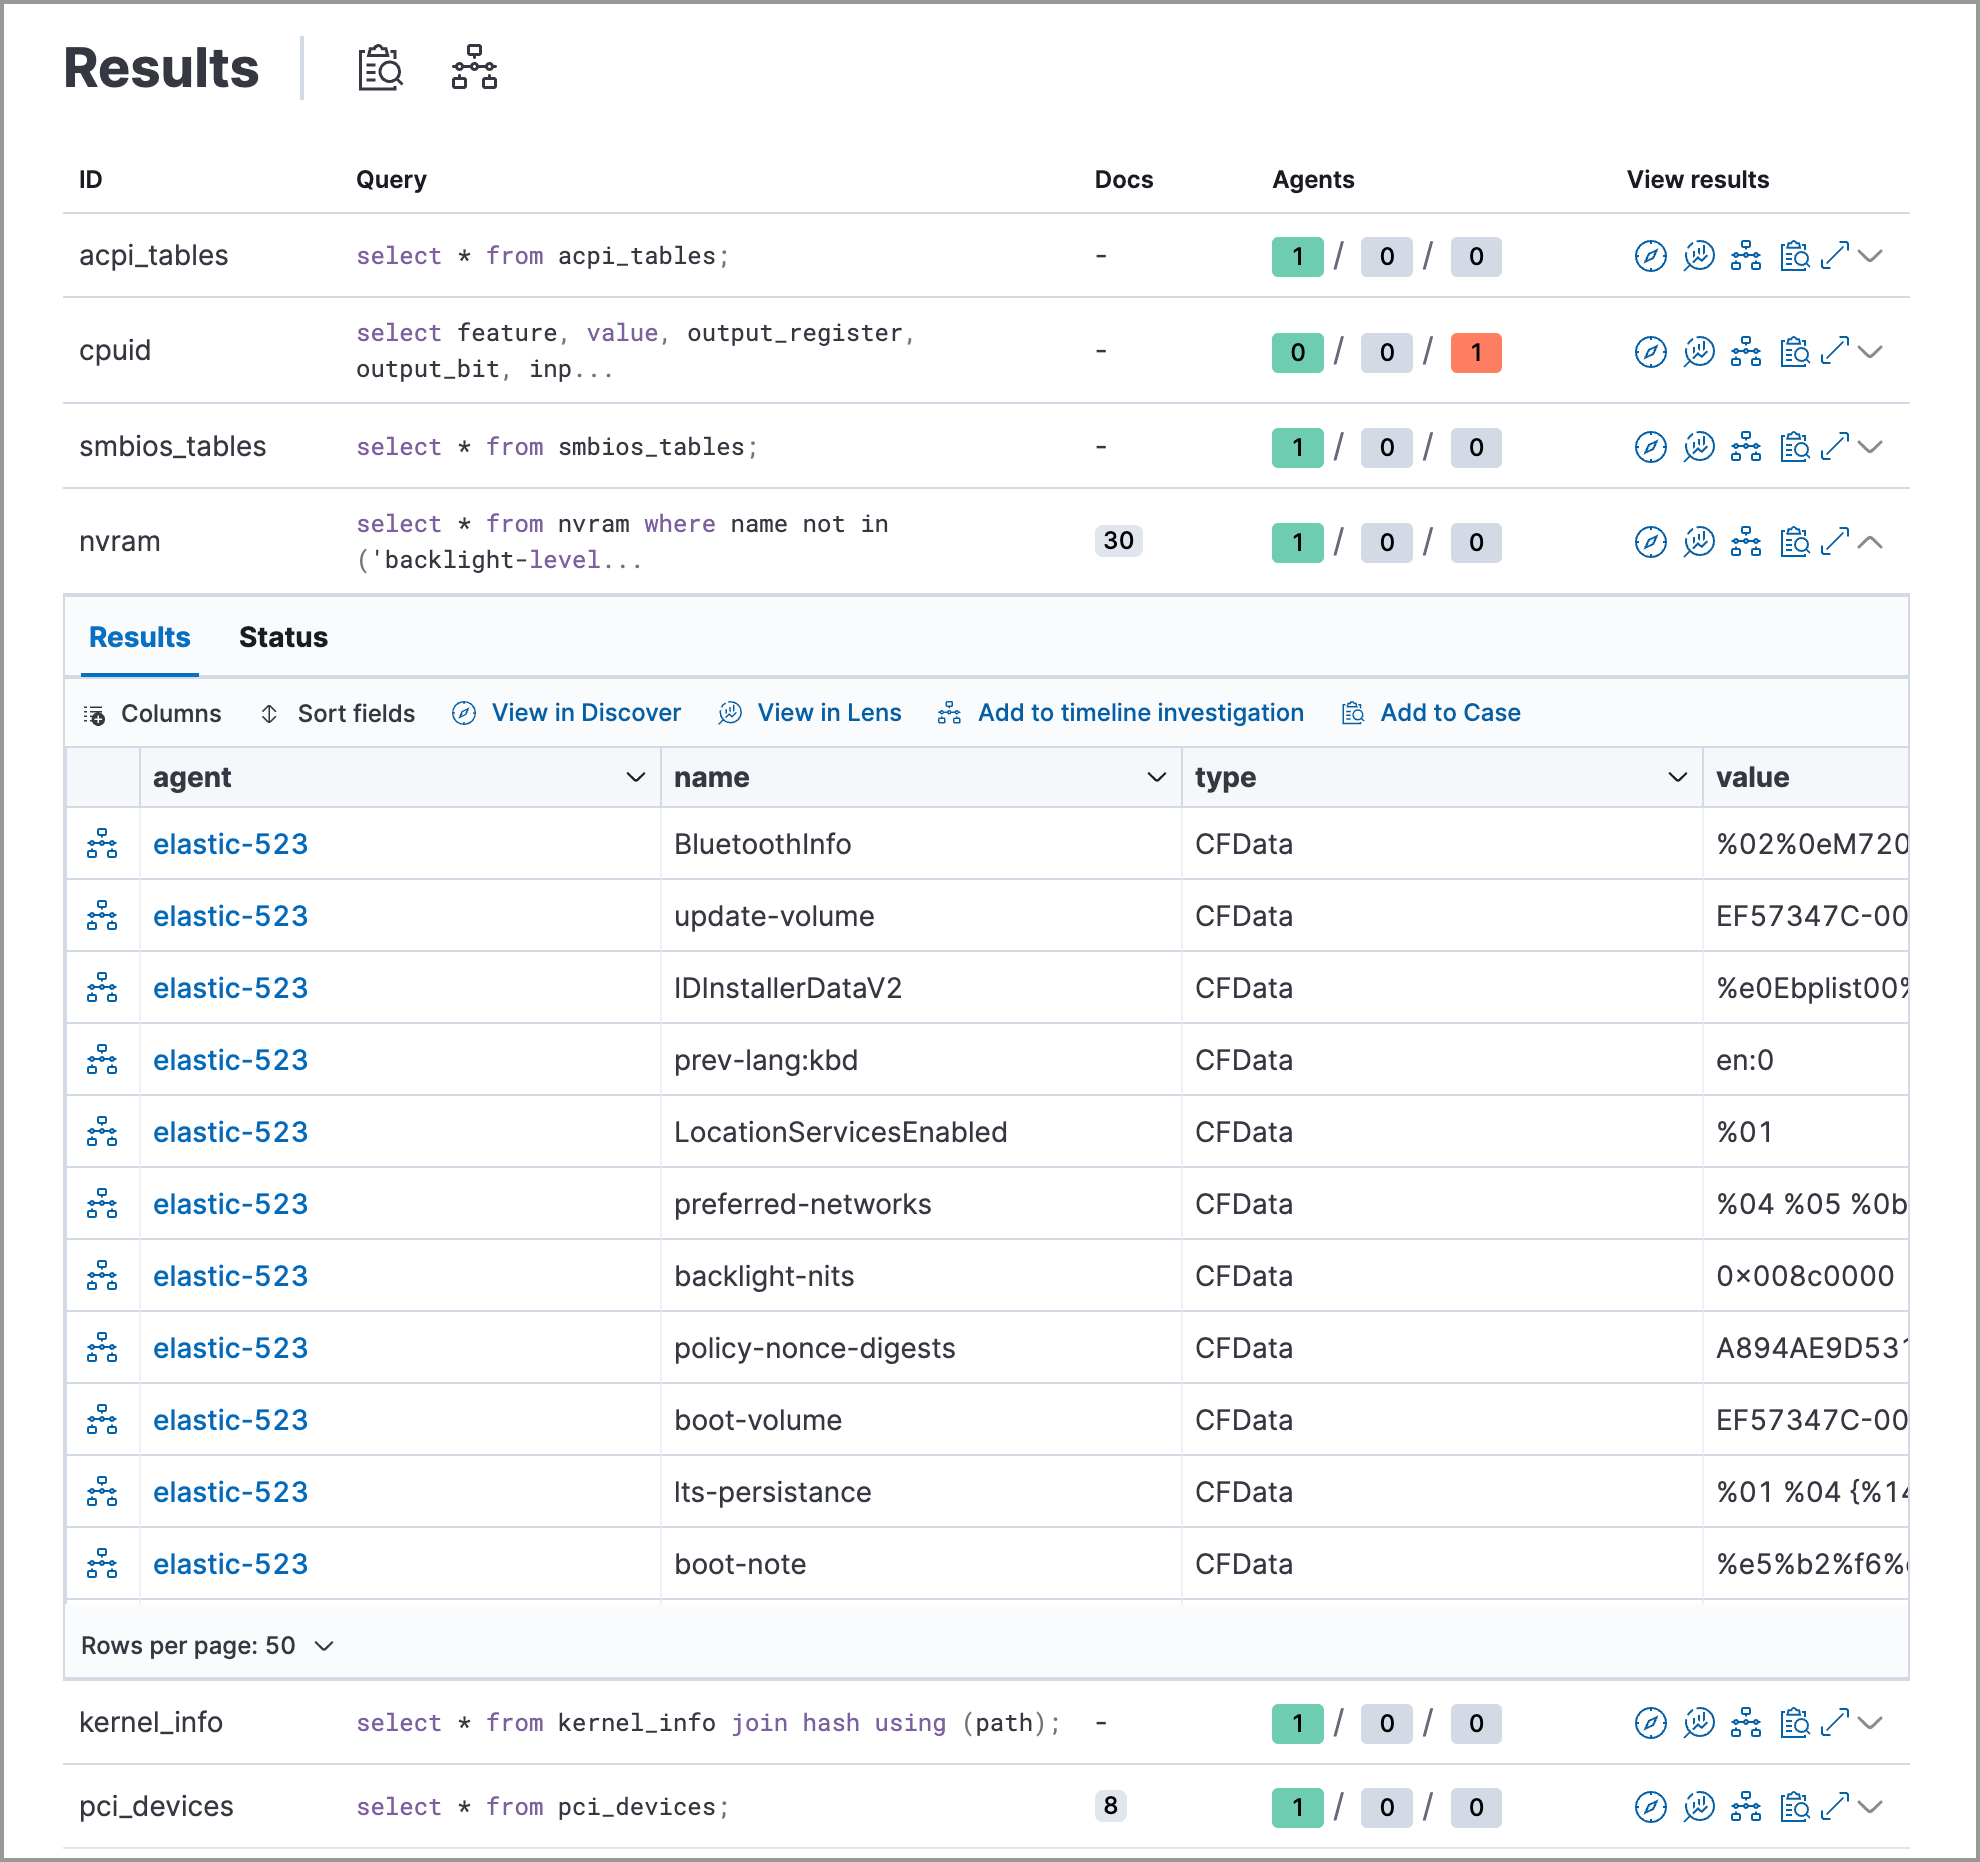
editThe Results table displays results from single queries and query packs.
Single query results
editResults for single queries appear on the Results tab. When you run a query, the number of agents queried and query status temporarily display in a status bar above the results table. Agent responses can be Successful, Not yet responded (pending), and Failed.

Query pack results
editResults for each query in the pack appear in the Results tab. Click the expand icon (![]() ) at the far right of each query row to display query results. The number of agents that were queried and their responses are shown for each query. Agent responses are color-coded. Green is
) at the far right of each query row to display query results. The number of agents that were queried and their responses are shown for each query. Agent responses are color-coded. Green is Successful, Not yet responded (pending) is gray, and Failed is red.

Investigate query results
editFrom the results table, you can:
-
Click View in Discover (
 ) to explore the results in Discover.
-
Click View in Lens (
 ) to navigate to Lens, where you can use the drag-and-drop Lens editor to create visualizations.
-
Click Timeline (
 ) to investigate a single query result in Timeline or Add to timeline investigation to investigate all results. This option is only available for single query results.
When you open all results in Timeline, the events in Timeline are filtered based on the
action_IDgenerated by the Osquery query. -
Click Add to Case (
 ) to add the query results to a new or existing case. If you ran a live query from an alert, the alert and query results are added to the case as comments.
If you add the results to a new case, you are prompted to specify the solution that you want the create the case within. Ensure you select the correct solution. From Elastic Security, you cannot access cases created in Observability or Stack Management.
If you add the results to an existing case, you can select from cases that were created in any solution (Elastic Security, Observability, and Elastic Stack).
-
Click the view details icon (
 ) to examine the query ID and statement.
- View more information about the request, such as failures, by opening the Status tab.