Troubleshoot Elastic Defend
This topic covers common troubleshooting issues when using Elastic Defend's endpoint management tools.
Unhealthy Elastic Agent status
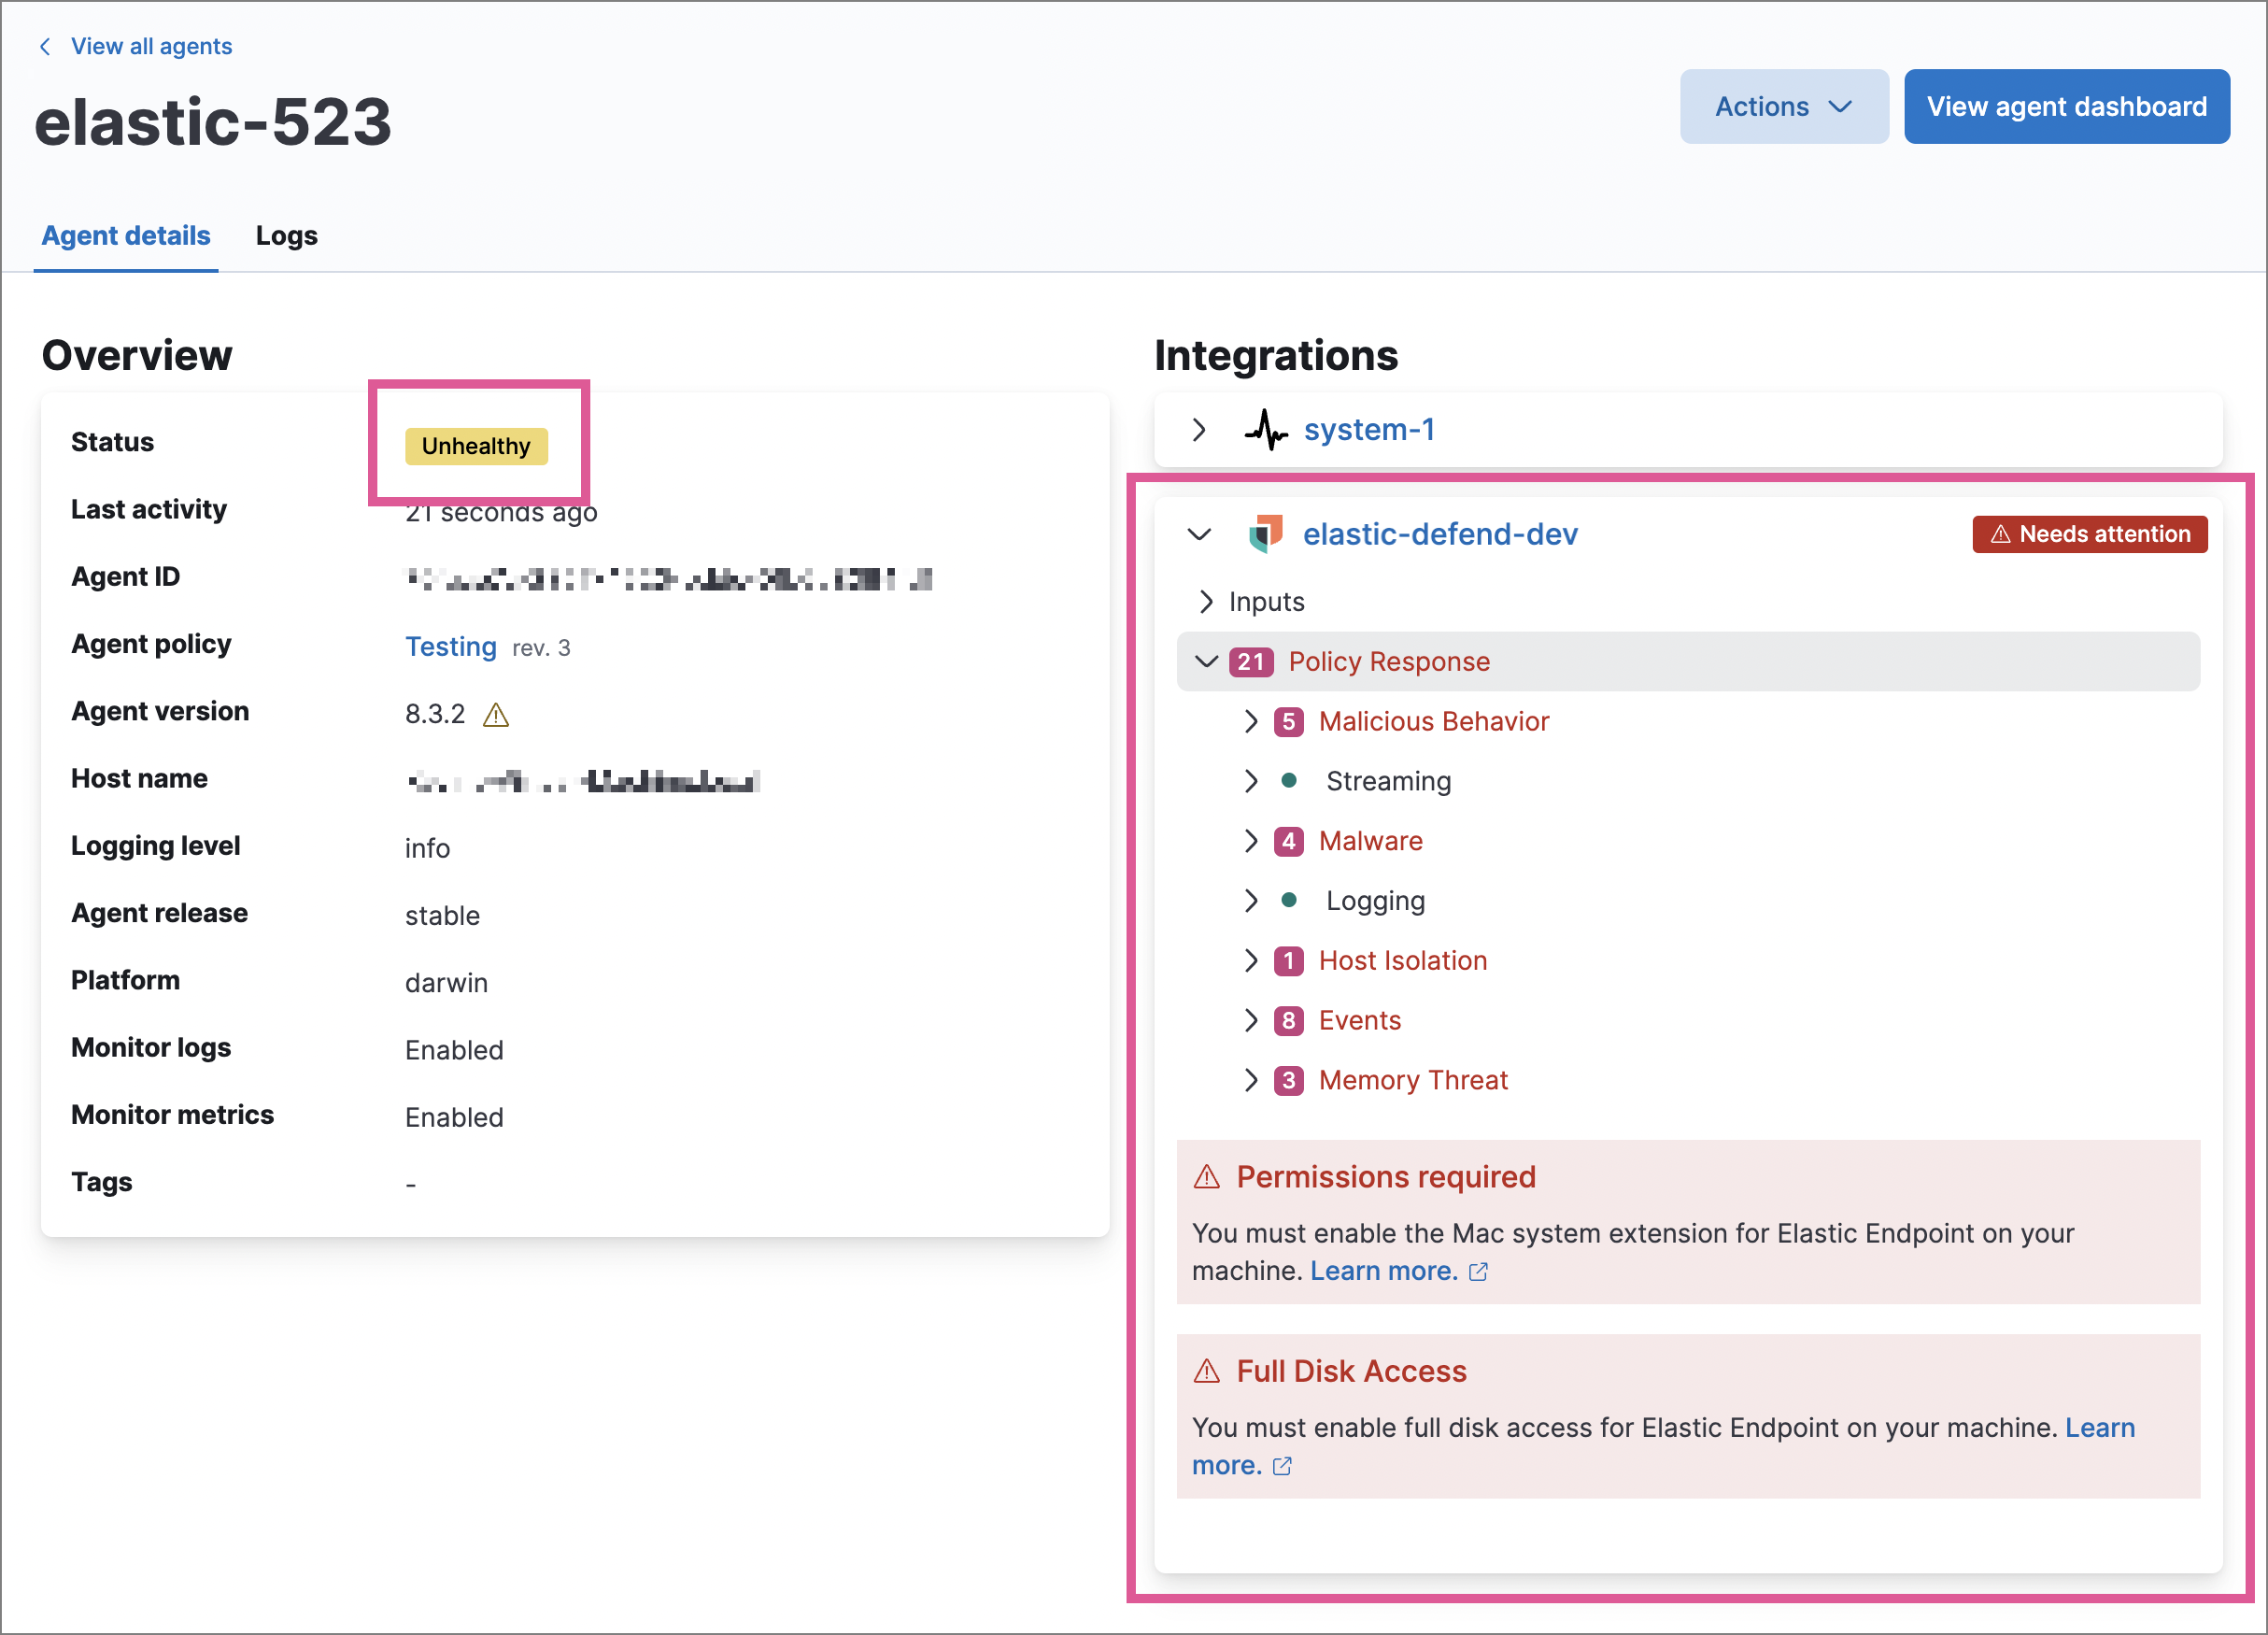
In some cases, an Unhealthy Elastic Agent status may be caused by a failure in the Elastic Defend integration policy. In this situation, the integration and any failing features are flagged on the agent details page in Fleet. Expand each section and subsection to display individual responses from the agent.
Integration policy response information is also available from the Endpoints page in the Elastic Security app (Manage → Endpoints, then click the link in the Policy status column).

Common causes of failure in the Elastic Defend integration policy include missing prerequisites or unexpected system configuration. Consult the following topics to resolve a specific error:
- Approve the system extension for Elastic Endpoint (macOS)
- Enable Full Disk Access for Elastic Endpoint (macOS)
- Resolve a potential system deadlock (Linux)
If the Elastic Defend integration policy is not the cause of the Unhealthy agent status, refer to Common problems with Fleet and Elastic Agent for help with the Elastic Agent.
Disabled to avoid potential system deadlock (Linux)
If you have an Unhealthy Elastic Agent status with the message Disabled due to potential system deadlock, that means malware protection was disabled on the Elastic Defend integration policy due to errors while monitoring a Linux host.
You can resolve the issue by configuring the policy’s advanced settings related to fanotify, a Linux feature that monitors file system events. By default, Elastic Defend works with fanotify to monitor specific file system types that Elastic has tested for compatibility, and ignores other unknown file system types.
If your network includes nonstandard, proprietary, or otherwise unrecognized Linux file systems that cause errors while being monitored, you can configure Elastic Defend to ignore those file systems. This allows Elastic Defend to resume monitoring and protecting the hosts on the integration policy.
Ignoring file systems can create gaps in your security coverage. Use additional security layers for any file systems ignored by Elastic Defend.
To resolve the potential system deadlock error:
Go to Manage → Policies, then click a policy’s name.
Scroll to the bottom of the policy and click Show advanced settings.
In the setting
linux.advanced.fanotify.ignored_filesystems, enter a comma-separated list of file system names to ignore, as they appear in/proc/filesystems(for example:ext4,tmpfs). Refer to Find file system names for more on determining the file system names.Click Save.
Once you save the policy, malware protection is re-enabled.
Required transform failed
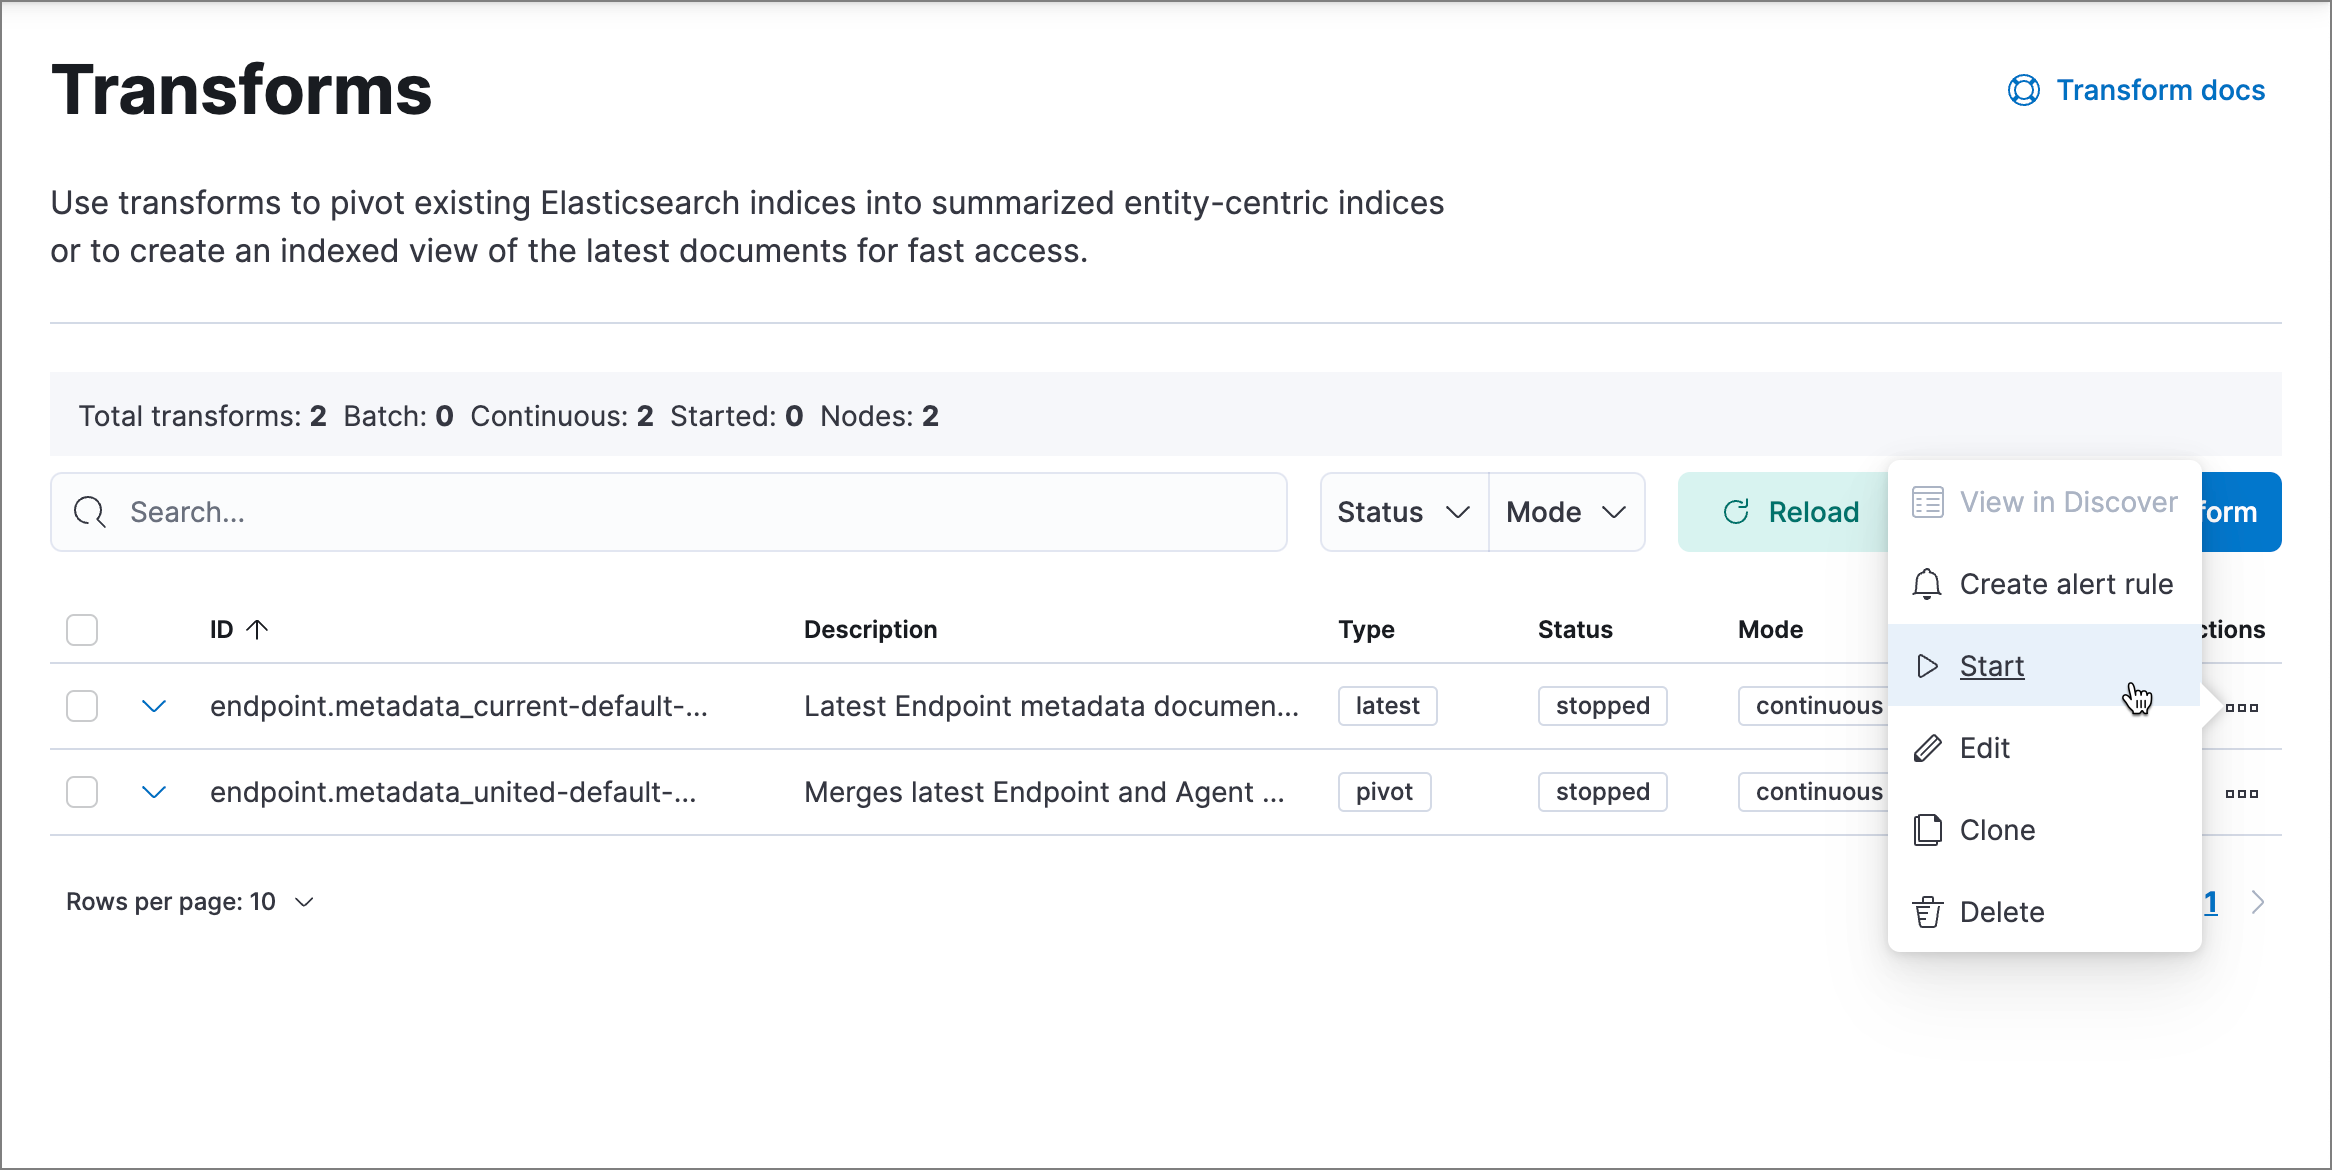
If you encounter a “Required transform failed” notice on the Endpoints page, you can usually resolve the issue by restarting the transform. Refer to Transforming data for more information about transforms.

To restart a transform that’s not running:
Go to Kibana's Transforms management page using the navigation menu or the global search field.
Enter
endpoint.metadatain the search box to find the transforms for Elastic Defend.Click the Actions menu (…) and do one of the following for each transform, depending on the value in the Status column:
- On the confirmation message that displays, click Start to restart the transform.
- The transform’s status changes to
started. If it doesn’t change, refresh the page.
Elastic Agent and Endpoint connection issues
After Elastic Agent installs Endpoint, Endpoint connects to Elastic Agent over a local relay connection to report its health status and receive policy updates and response action requests. If that connection cannot be established, the Elastic Defend integration will cause Elastic Agent to be in an Unhealthy status, and Endpoint won’t operate properly.
You can identify if this issue is happening in the following ways:
Run Elastic Agent's status command:
sudo /opt/Elastic/Agent/elastic-agent status(Linux)sudo /Library/Elastic/Agent/elastic-agent status(macOS)c:\Program Files\Elastic\Agent\elastic-agent.exe status(Windows)
If the status result for
endpoint-securitysays that Endpoint has missed check-ins orlocalhost:6788cannot be bound to, it might indicate this problem is occurring.If the problem starts happening right after installing Endpoint, check the value of
fleet.agent.idin the following file:/opt/Elastic/Endpoint/elastic-endpoint.yaml(Linux)/Library/Elastic/Endpoint/elastic-endpoint.yaml(macOS)c:\Program Files\Elastic\Endpoint\elastic-endpoint.yaml(Windows)
If the value of
fleet.agent.idis00000000-0000-0000-0000-000000000000, this indicates this problem is occurring.NoteIf this problem starts happening after Endpoint has already been installed and working properly, then this value will have changed even though the problem is happening.
If you’ve confirmed that the issue is happening, you can look at Endpoint log messages to identify the cause:
Failed to find connection to validate. Is Agent listening on 127.0.0.1:6788?orFailed to validate connection. Is Agent running as root/admin?means that Endpoint is not able to create an initial connection to Elastic Agent over port6788.Unable to make GRPC connection in deadline(60s). Fetching connection info againmeans that Endpoint’s original connection to Elastic Agent over port6788worked, but the connection over port6789is failing.
To debug and resolve the issue, follow these steps:
Since 8.7.0, Endpoint diagnostics contain a file named
analysis.txtthat contains information about what may cause this issue. As of 8.11.2, Elastic Agent diagnostics automatically include Endpoint diagnostics. For previous versions, you can gather Endpoint diagnostics by running:sudo /opt/Elastic/Endpoint/elastic-endpoint diagnostics(Linux)sudo /Library/Elastic/Endpoint/elastic-endpoint diagnostics(macOS)c:\Program Files\Elastic\Endpoint\elastic-endpoint.exe diagnostics(Windows)
Make sure nothing else on your device is listening on ports
6788or6789by running:sudo netstat -anp --tcp(Linux)sudo netstat -an -f inet(macOS)netstat -an(Windows)
Make sure
localhostcan be resolved to127.0.0.1by running:ping -4 -c 1 localhost(Linux)ping -c 1 localhost(macOS)ping -4 localhost(Windows)
Elastic Defend deployment issues
After deploying Elastic Defend, you might encounter warnings or errors in the endpoint’s Policy status in Fleet if your mobile device management (MDM) is misconfigured or certain permissions for Elastic Endpoint aren’t granted. The following sections explain issues that can cause warnings or failures in the endpoint’s policy status.
This means that the system extension or kernel extension was not approved. Consult the following topics for approving the system extension with or without MDM:
You can validate the system extension is loaded by running:
sudo systemextensionsctl list | grep co.elastic.systemextension
In the command output, the system extension should be marked as "active enabled".
If the system extension is loaded and kernel connection still fails, this means that Full Disk Access was not granted. Elastic Endpoint requires Full Disk Access to subscribe to system events through the Elastic Defend framework, which is one of the primary sources of eventing information used by Elastic Endpoint. Consult the following topics for granting Full Disk Access with or without MDM:
You can validate that Full Disk Access is approved by running
sudo /Library/Elastic/Endpoint/elastic-endpoint test install
If the command output doesn’t contain a message about enabling Full Disk Access, the approval was successful.
This means that the network extension content filtering was not approved. Consult the following topics for approving network content filtering with or without MDM:
You can validate that network content filtering is approved by running
sudo /Library/Elastic/Endpoint/elastic-endpoint test install
If the command output doesn’t contain a message about approving network content filtering, the approval was successful.
This means that Full Disk Access was not granted for one or all Elastic Endpoint components. Consult the following topics for granting Full Disk Access with or without MDM:
You can validate that Full Disk Access is approved by running
sudo /Library/Elastic/Endpoint/elastic-endpoint test install
If the command output doesn’t contain a message about enabling Full Disk Access, the approval was successful.
Disable Elastic Defend's self-healing feature on Windows
Elastic Defend's self-healing feature rolls back recent filesystem changes when a prevention alert is triggered. This feature uses the Windows Volume Snapshot Service. Although it’s uncommon for this to cause issues, you can turn off this Elastic Defend feature if needed.
If issues occur and the self-healing feature is enabled, you can turn it off by setting windows.advanced.alerts.rollback.self_healing.enabled to false in the integration policy advanced settings. Refer to Configure self-healing rollback for Windows endpoints for more information.
Elastic Defend may also use the Volume Snapshot Service to ensure the feature works properly even when it’s turned off. To opt out of this, set windows.advanced.diagnostic.rollback_telemetry_enabled to false in the same settings.
There are some known compatibility issues between Elastic Defend's self-healing feature and filesystem replication features, including DFS Replication and Veeam Replication. This may manifest as DFSR Event ID 1102:
The DFS Replication service has temporarily stopped replication because another application is performing a backup or restore operation. Replication will resume after the backup or restore operation has finished.
There are no known workarounds for this issue other than to turn off the self-healing feature.
