WARNING: Version 6.2 of the Elastic Stack has passed its EOL date.
This documentation is no longer being maintained and may be removed. If you are running this version, we strongly advise you to upgrade. For the latest information, see the current release documentation.
Monitoring in a Production Environment
editMonitoring in a Production Environment
editBy default, X-Pack monitoring agents on Elasticsearch index data into the cluster where they’re running. In production, you should send data to a separate monitoring cluster so that historical monitoring data is available even if the nodes you are monitoring are not. Using a dedicated monitoring cluster also enables you to monitor multiple clusters from a central location.
To store monitoring data in a separate cluster:
-
Set up the Elasticsearch cluster you want to use for monitoring, install X-Pack, and start Elasticsearch. For example, you might set up a two host cluster with the nodes
es-mon-1andes-mon-2.To monitor an Elasticsearch 6.x cluster, you must run the same or a later version of Elasticsearch 6.x on the monitoring cluster. While installing X-Pack on the monitoring cluster is not absolutely required, it is strongly recommended.
-
Install X-Pack and configure X-Pack monitoring in Kibana.
Kibana makes requests to the monitoring cluster as the logged in user. The username and password credentials must therefore be valid on both the Kibana server and the monitoring cluster.
-
Create a user on the monitoring cluster that has the
remote_monitoring_agentrole. These credentials will be used when data is shipped from the Elasticsearch cluster you are monitoring to your dedicated monitoring cluster. For example, the following request creates aremote_monitoruser that has theremote_monitoring_agentrole:POST /_xpack/security/user/remote_monitor { "password" : "changeme", "roles" : [ "remote_monitoring_agent"], "full_name" : "Internal Agent For Remote Monitoring" } - Install X-Pack on the Elasticsearch nodes in your production cluster.
-
Configure each Elasticsearch node in the cluster you are monitoring to send metrics to your monitoring cluster by configuring an HTTP exporter in the
xpack.monitoring.exporterssettings inelasticsearch.yml. -
If SSL/TLS is enabled on the monitoring cluster, specify the trusted CA certificate(s) that will be used to verify the identity of the nodes in the monitoring cluster.
To add a CA certificate to an Elasticsearch node’s trusted certificates, you can specify the location of the PEM encoded certificate with the
certificate_authoritiessetting:xpack.monitoring.exporters: id1: type: http host: ["https://es-mon1:9200", "https://es-mon2:9200"] auth: username: agent-user password: password ssl: certificate_authorities: [ "/path/to/ca.crt" ]Alternatively, you can configure trusted certificates using a truststore (a Java Keystore file that contains the certificates):
xpack.monitoring.exporters: id1: type: http host: ["https://es-mon1:9200", "https://es-mon2:9200"] auth: username: remote_monitor password: changeme ssl: truststore.path: /path/to/file truststore.password: password -
Restart Elasticsearch on the nodes in your production cluster.
You may want to temporarily disable shard allocation before you restart your nodes to avoid unnecessary shard reallocation during the install process.
-
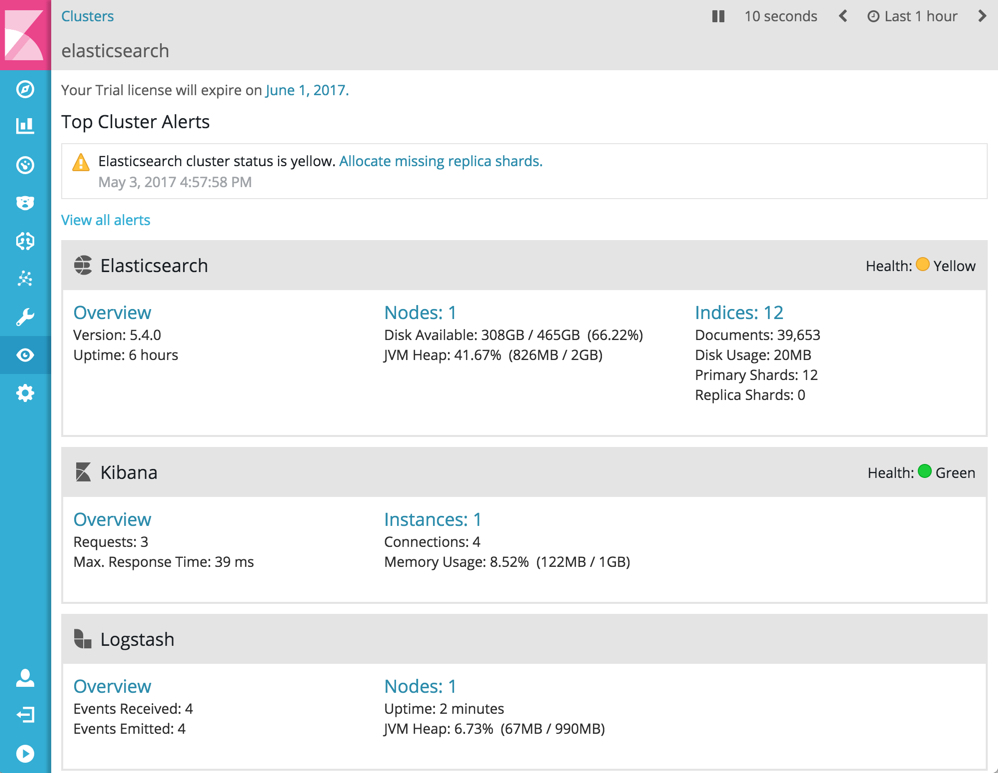
To verify your X-Pack monitoring installation, point your web browser at your Kibana host, and select Monitoring from the side navigation. When security is enabled, to view the monitoring dashboards you must log in to Kibana as a user who has both the
kibana_userandmonitoring_userroles. For example:POST /_xpack/security/user/stack-monitor { "password" : "changeme", "roles" : [ "kibana_user", "monitoring_user" ] }
