Detect data exfiltration activity with Kibana’s new integration


 Share on Twitter
Share on Twitter

 Share on LinkedIn
Share on LinkedIn

 Share on Facebook
Share on Facebook

 Share by Email
Share by Email

 Print this page
Print
Does your organization’s data include sensitive information, like intellectual property or personally identifiable information (PII)? Do you want to protect your data from being stolen and sent (i.e., exfiltrated) to external web services? If the answer to these questions is yes, then Elastic’s Data Exfiltration Detection package can help you identify when critical enterprise data is being stolen and exfiltrated.
What is data exfiltration?
Data exfiltration is the unauthorized transfer of data from a device or network. In simple terms, it is a type of data loss — and to enterprises, it may also mean risk exposure. Data exfiltration can be conducted by outsiders of an organization who compromise the network to steal company secrets or credentials. Another way data exfiltration can occur is by employees of an organization who may accidentally (by using their personal email or cloud storage account) or intentionally move data outside the organization's security boundaries.
A common data exfiltration technique seen across breaches is exfiltration via legitimate external web services, such as code repositories (e.g., GitHub or GitLab), ephemeral websites like pastebin, and cloud storage services (e.g., Google Workspace or Dropbox).
The Data Exfiltration Detection package detects abnormal volumes of data transfer to uncommonly used locations or IP addresses, among other network metadata abnormalities. It can then trigger alerts to notify you when your organization’s sensitive data has been exfiltrated to popular external web services.
The package is now available in the Integrations app in Kibana. We’ll walk through the installation steps below.
Getting started
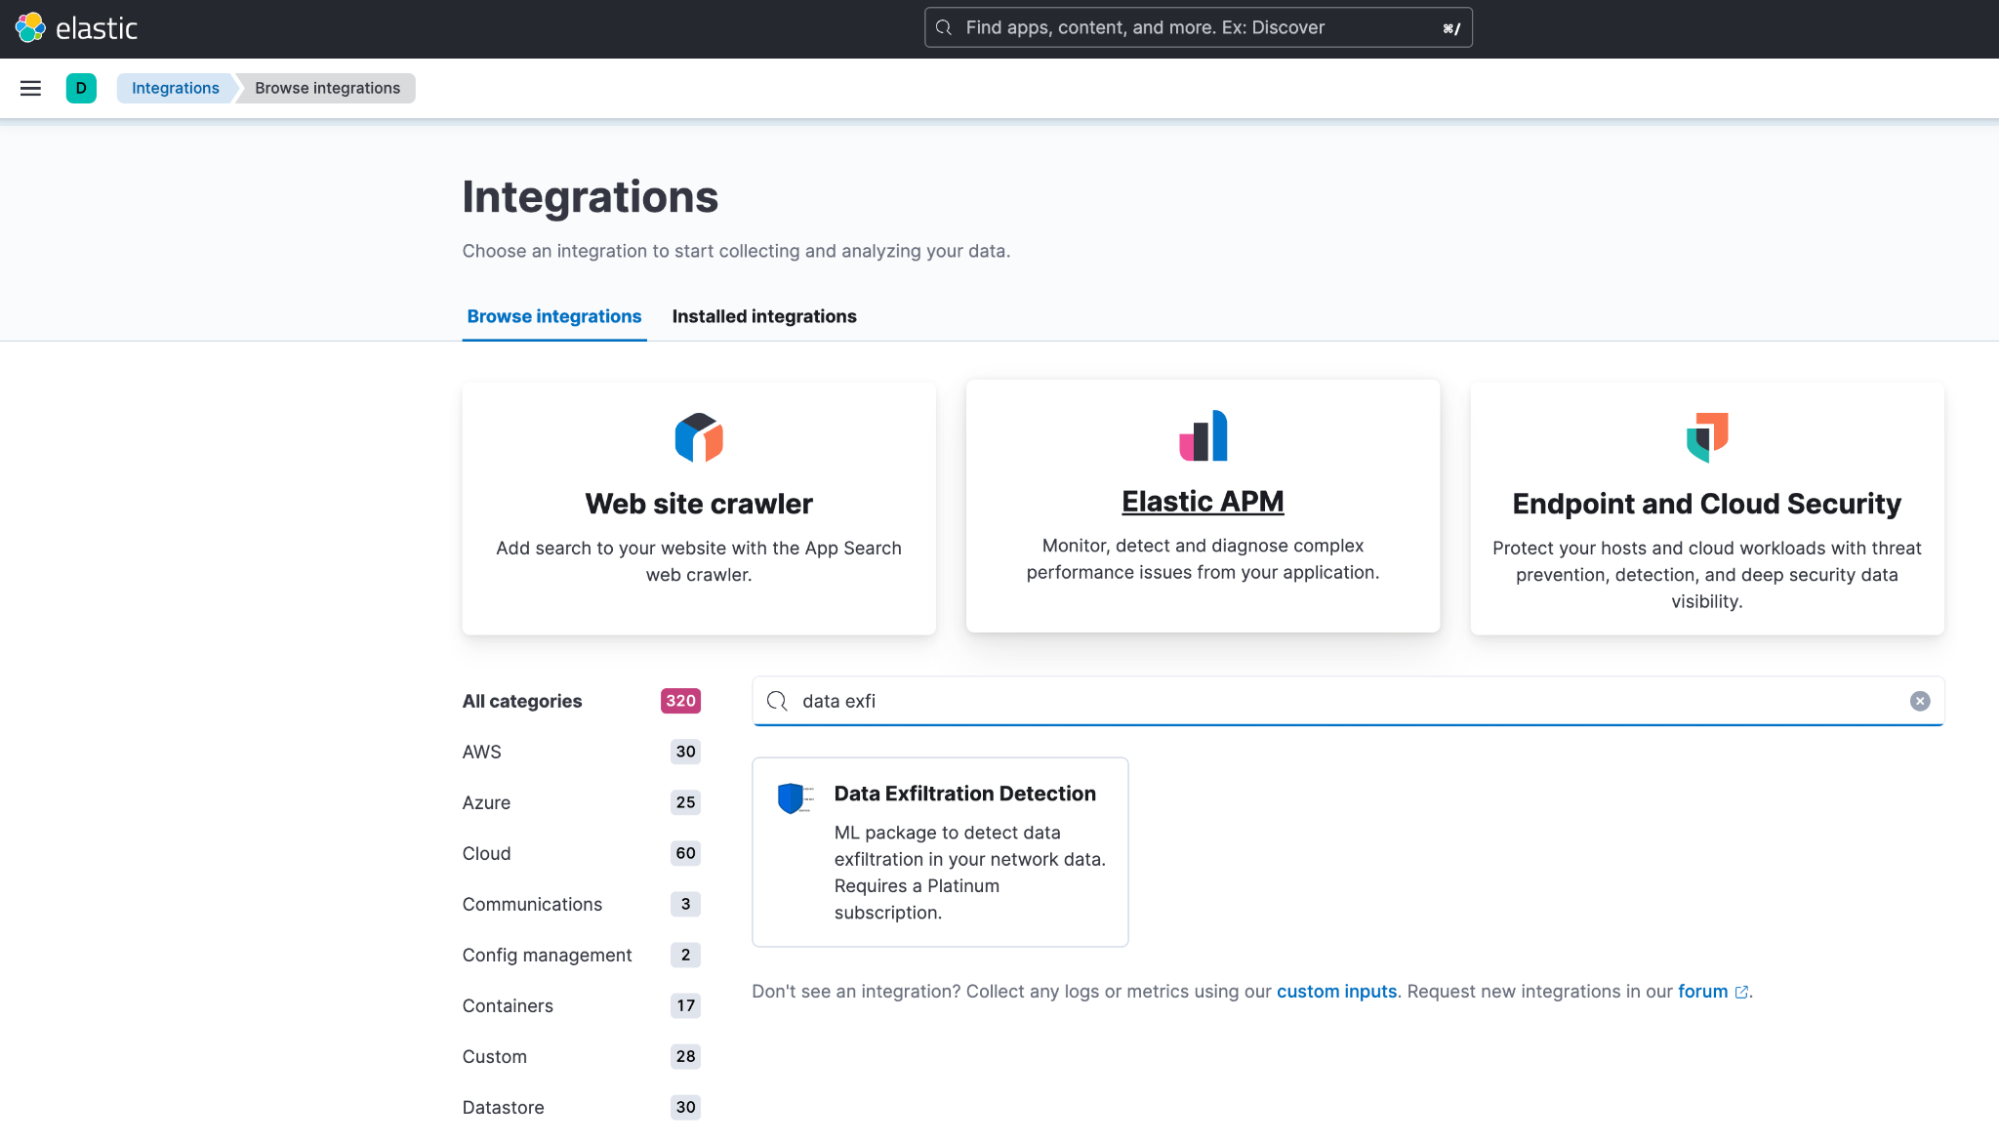
As of Elastic 8.6, users can install the Data Exfiltration Detection package, which includes new anomaly detection jobs and rules, from the Integrations app in Kibana.
If you don’t have an Elastic Cloud cluster but would like to start experimenting with the package, you can start a free 14-day trial of Elastic Cloud.
We will explain the steps to get this package up and running in your environment in a matter of minutes — it’s that easy.
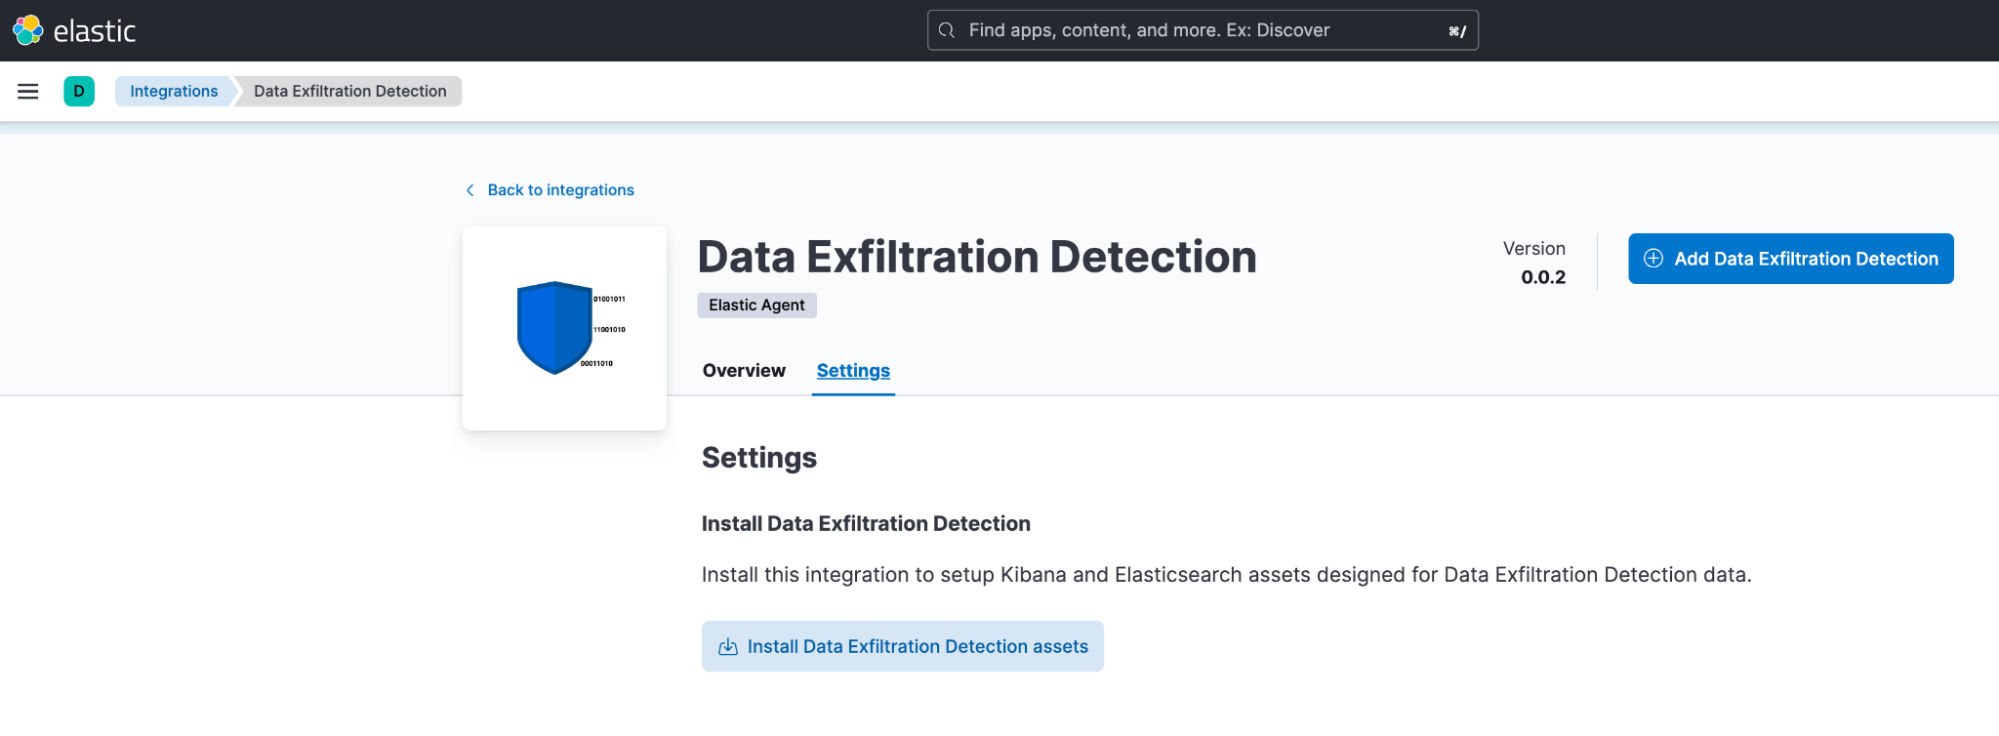
Step 1: Installing the package assets
In Kibana, the Integrations app now includes the Data Exfiltration Detection package. To install the assets, click the Install Data Exfiltration assets button under the Settings tab. This will install all of the artifacts necessary to generate alerts when data exfiltration activity is detected in your network data.
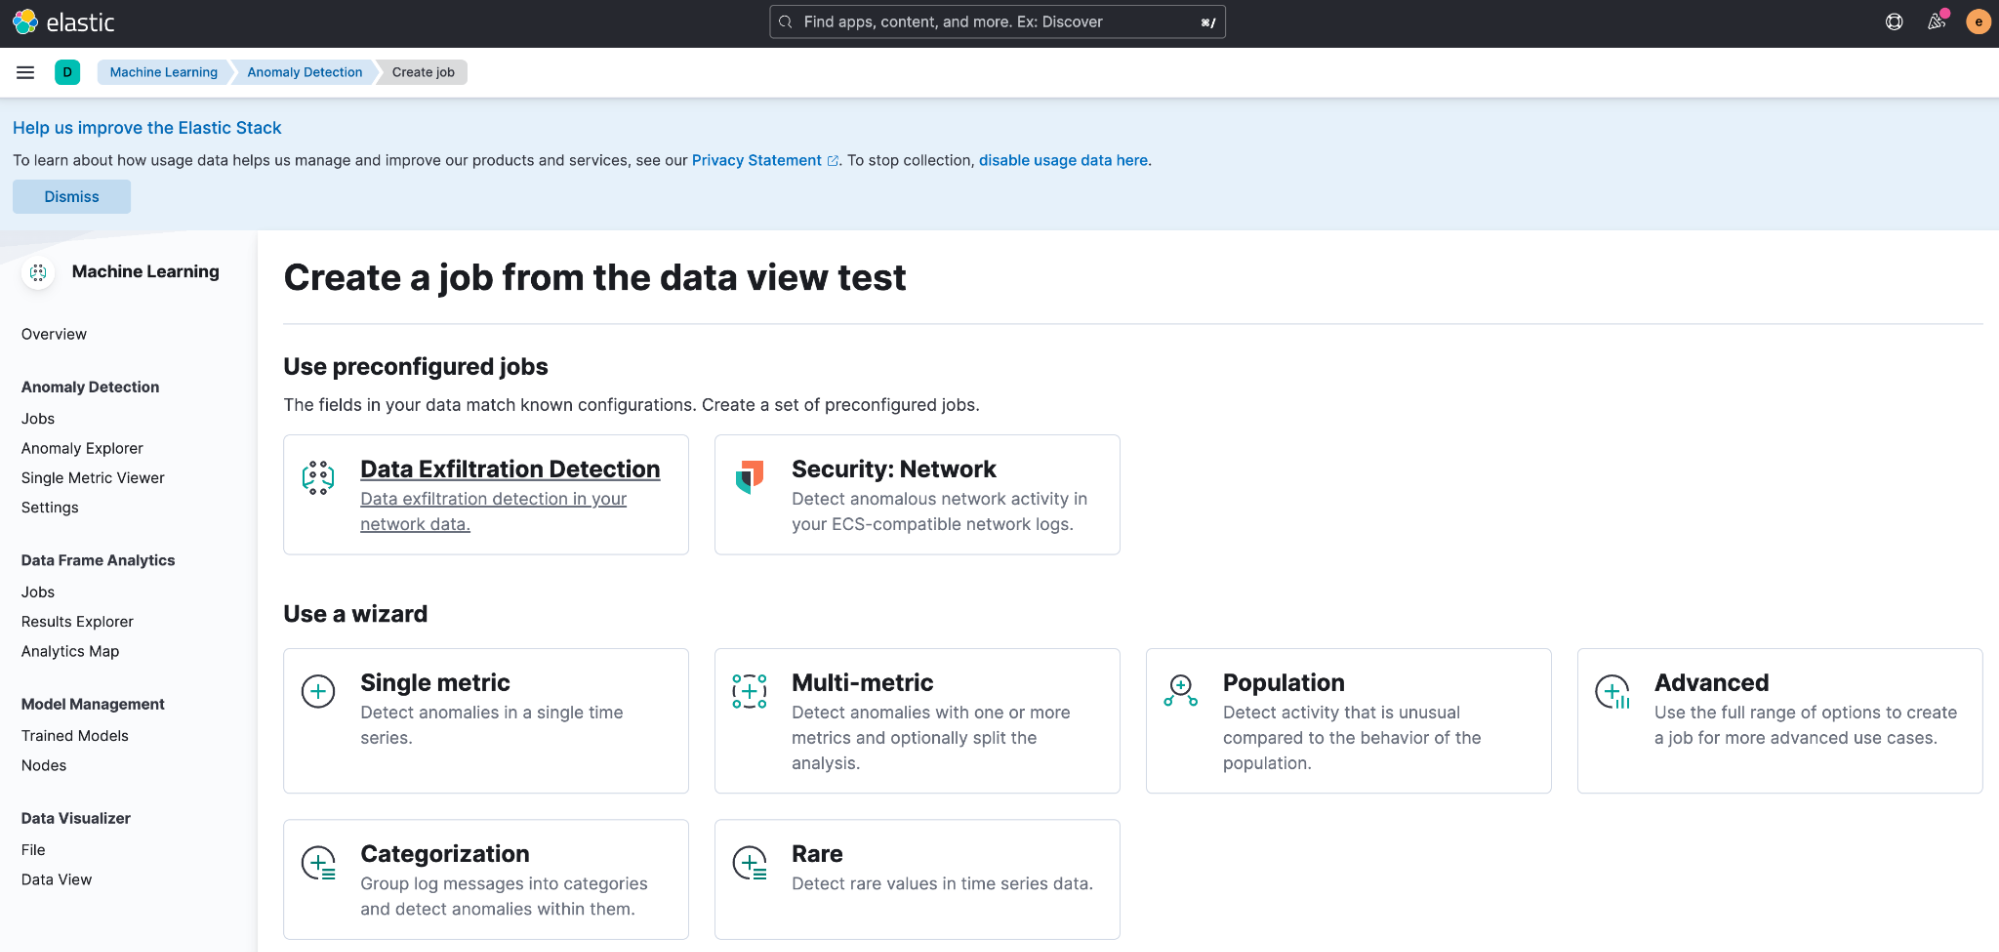
Step 2: Running anomaly detection
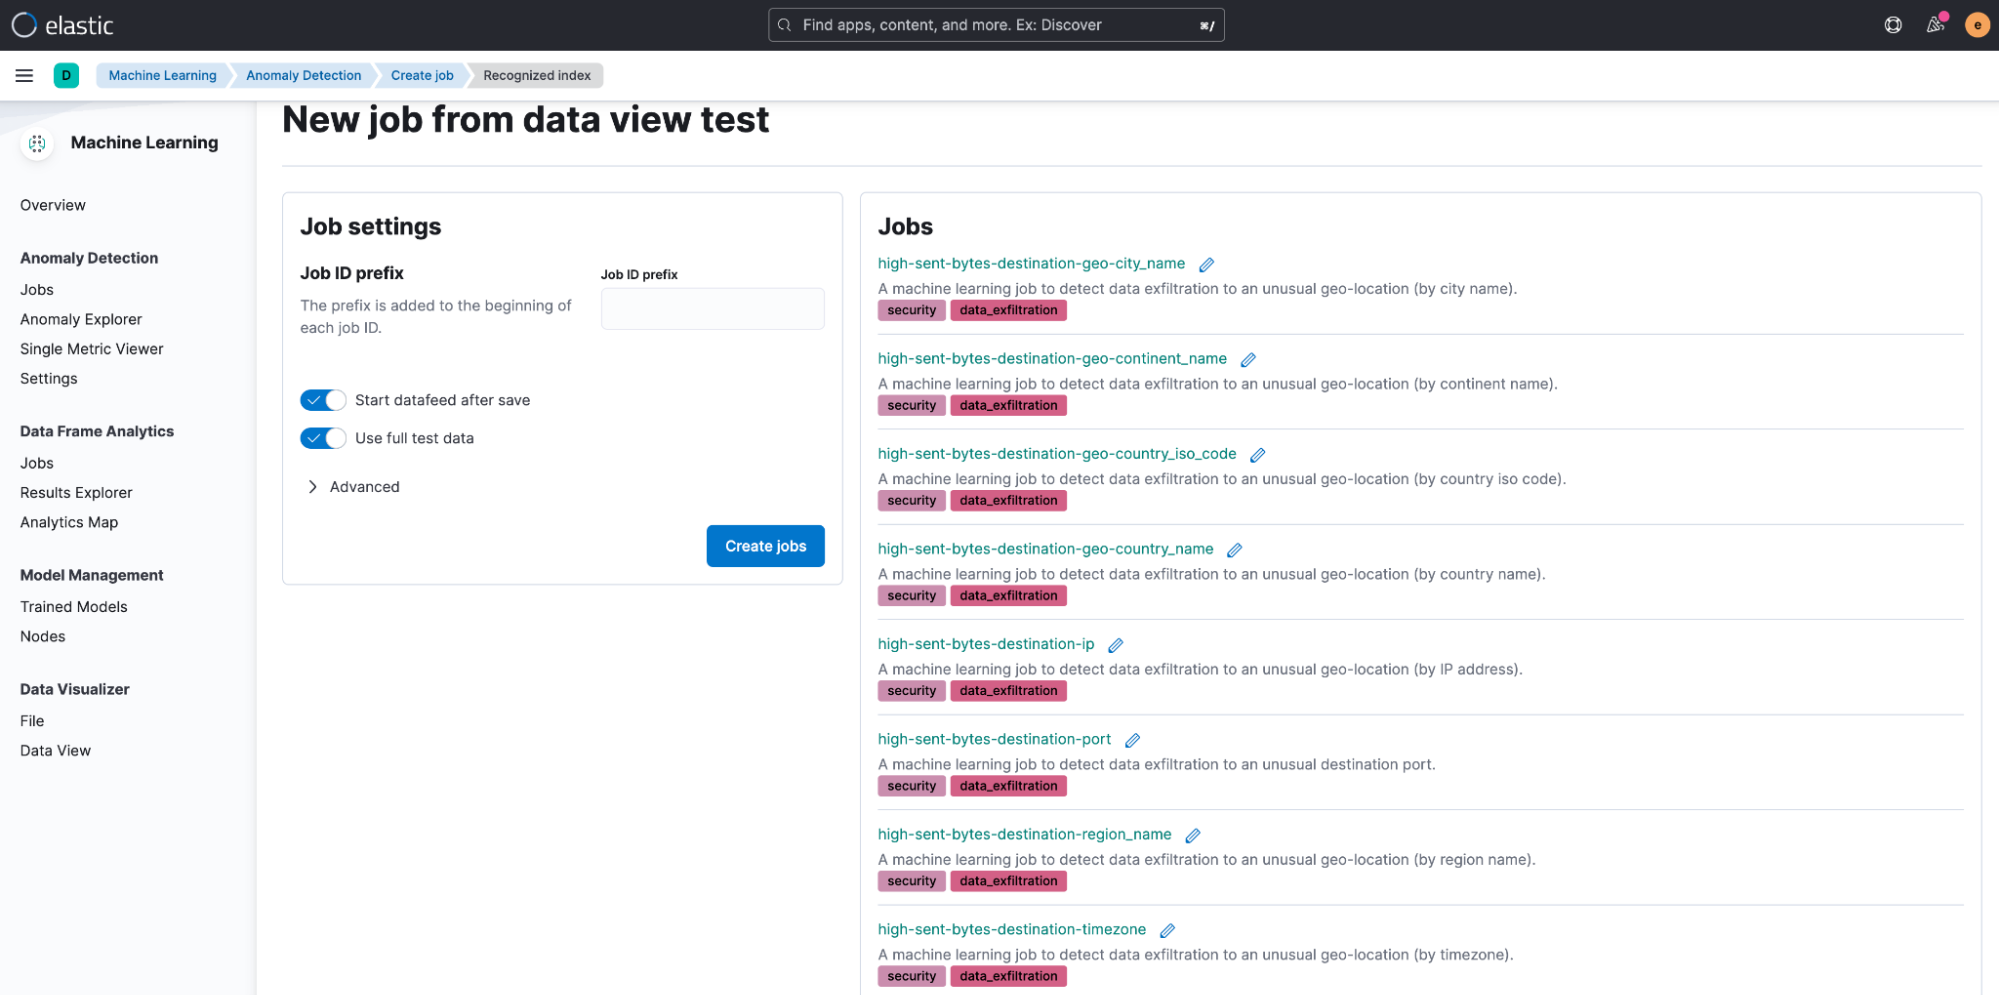
The package includes several preconfigured anomaly detection jobs. These jobs enable you to find the transmission of suspicious volumes of traffic to specific geo-locations, IP addresses, and ports.
To run these jobs on your network data, go to Machine Learning > Anomaly Detection. When you create a job using the job wizard, you should see an option to Use preconfigured jobs with a card for Data Exfiltration Detection.
After selecting the card, you will see several preconfigured anomaly detection jobs that can be run.
Step 3: Enabling the rules
Now that you’ve enabled the jobs, you may want to generate alerts for data exfiltration activity in your environment. To generate alerts, you will have to enable the installed detection rules. The rules are triggered when anomalies with scores above a certain threshold are identified by the anomaly detection jobs you set up in Step 2. The complete list of installed rules can be found on the Overview page of the package itself.
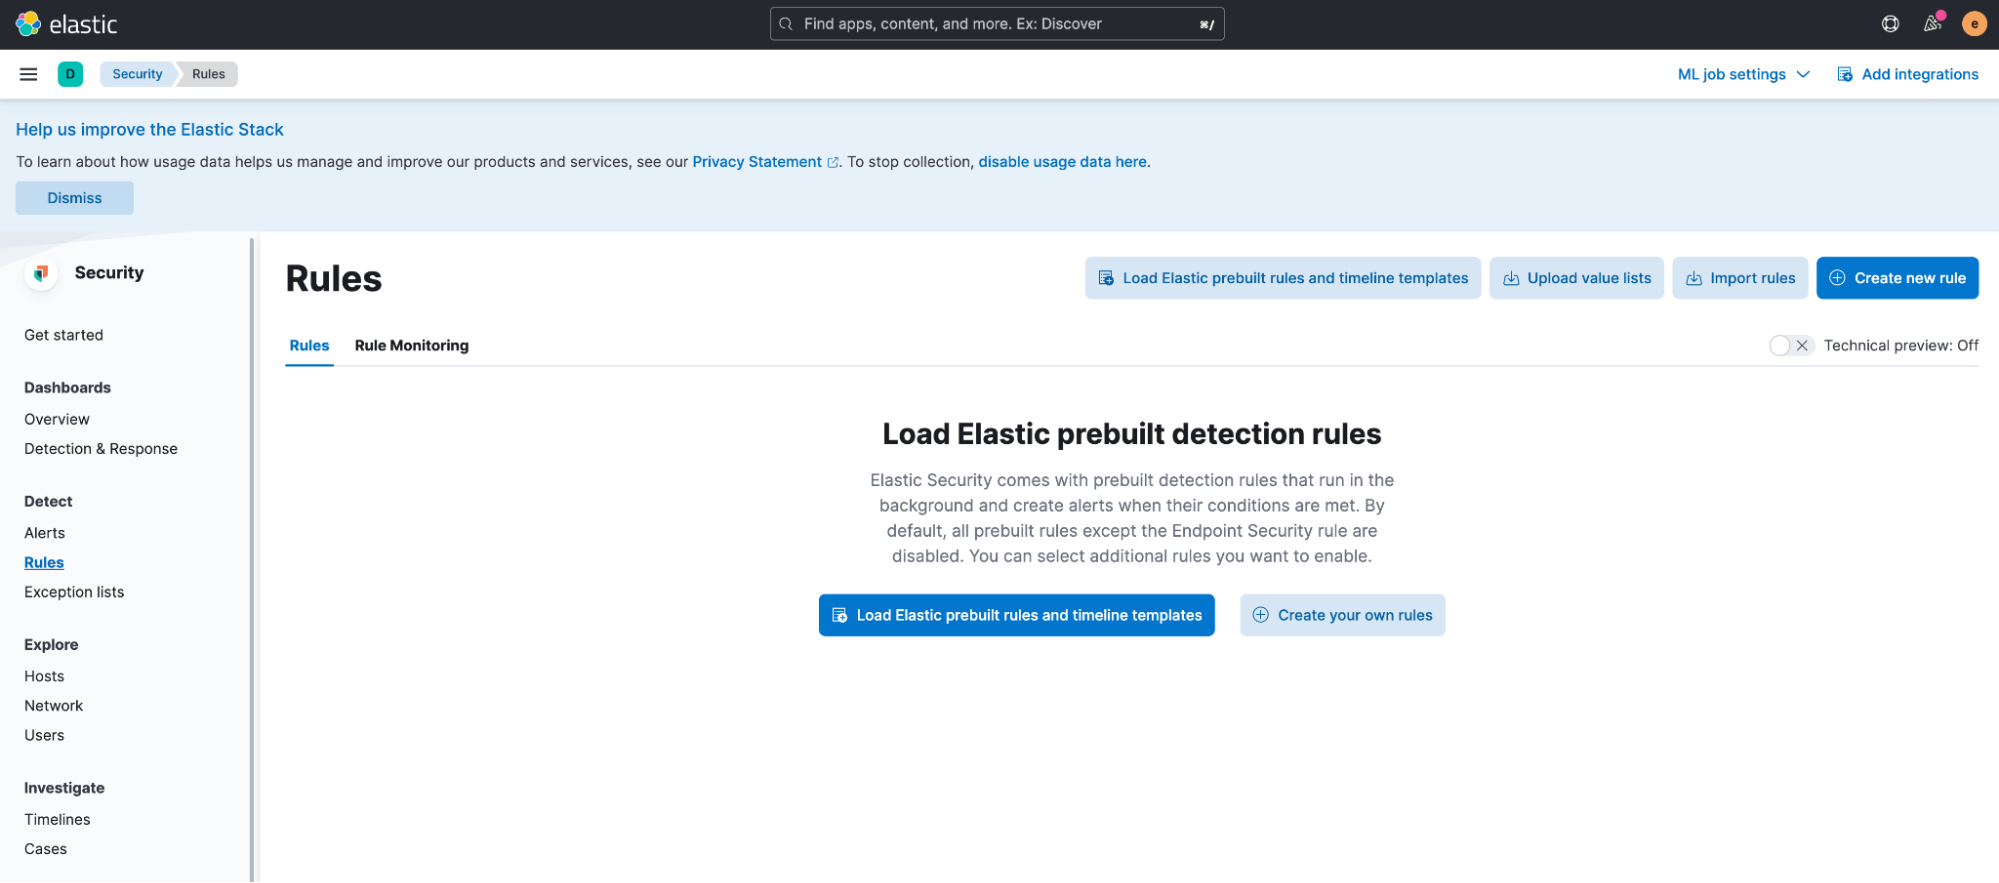
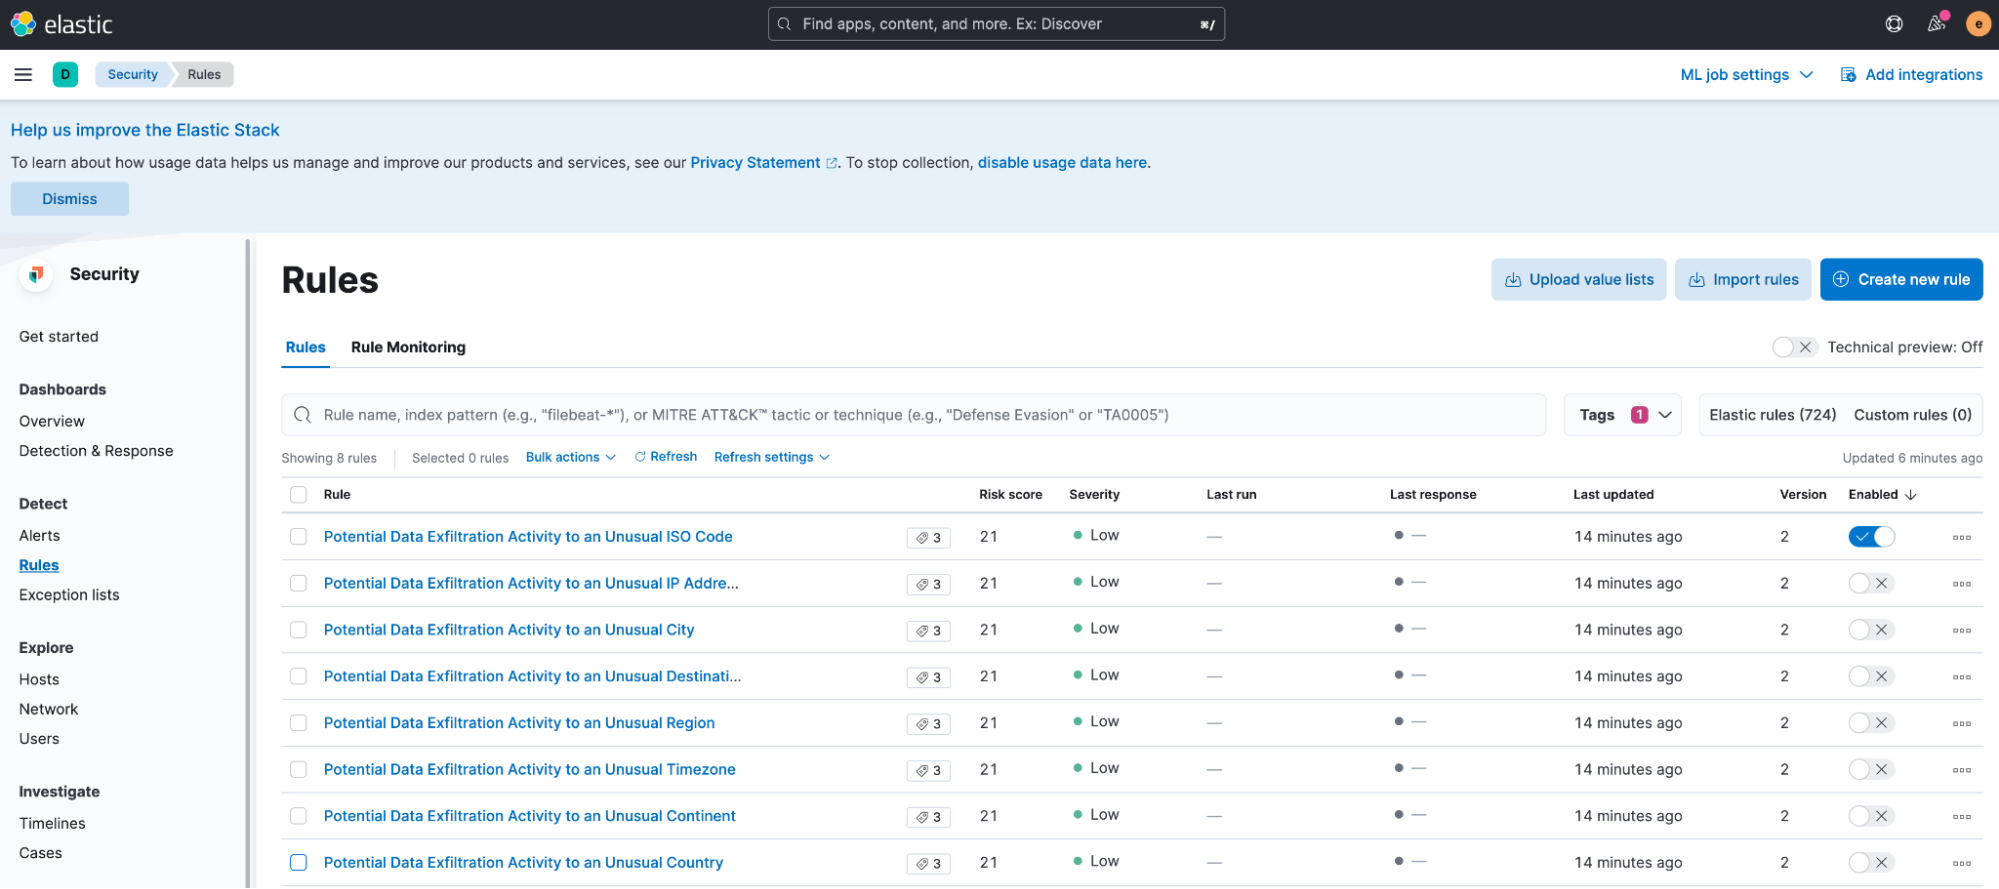
To enable and use the installed rules, navigate to Security > Rules (under the Detect subheading) and select Load Elastic prebuild rules and timeline templates. If you’re running in Elastic Cloud, this step is done automatically.
You can find the rules corresponding to Data Exfiltration Detection by filtering on the Data Exfiltration tag. To enable specific rules, switch on the Enabled toggle corresponding to the rule.
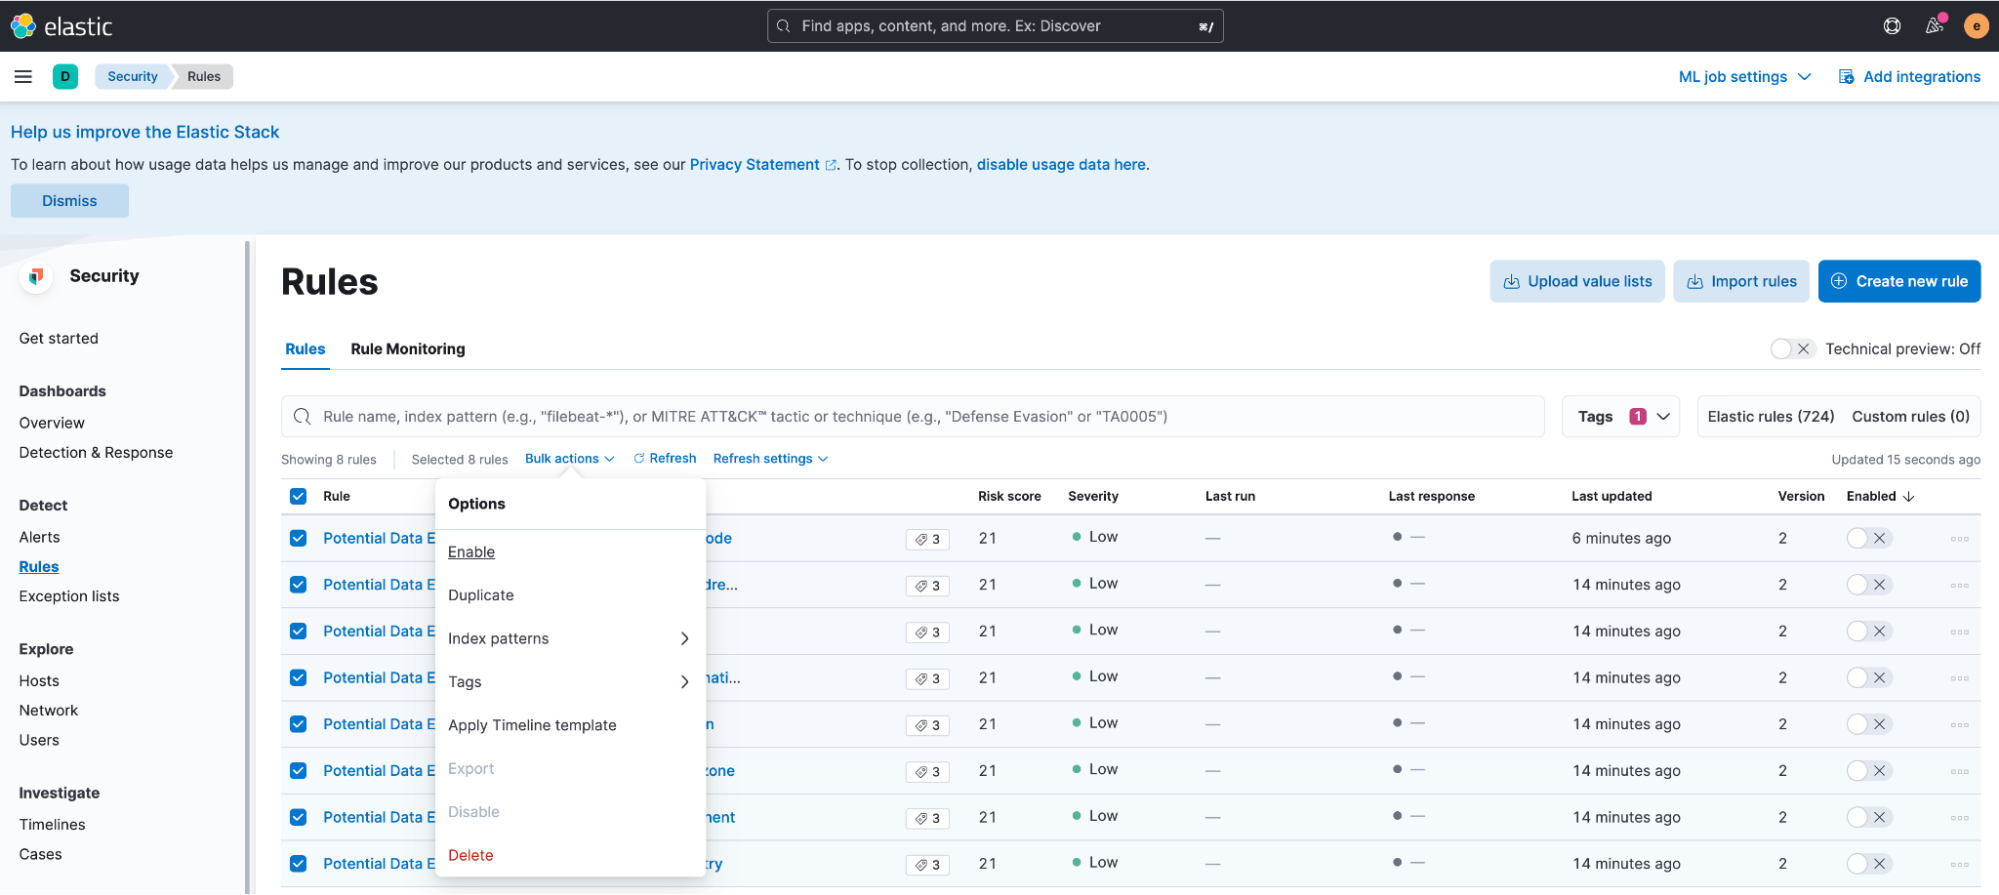
To enable all the rules at once, select all the rules you want to modify, then select Enable from the Bulk actions menu.
Responding to data exfiltration events
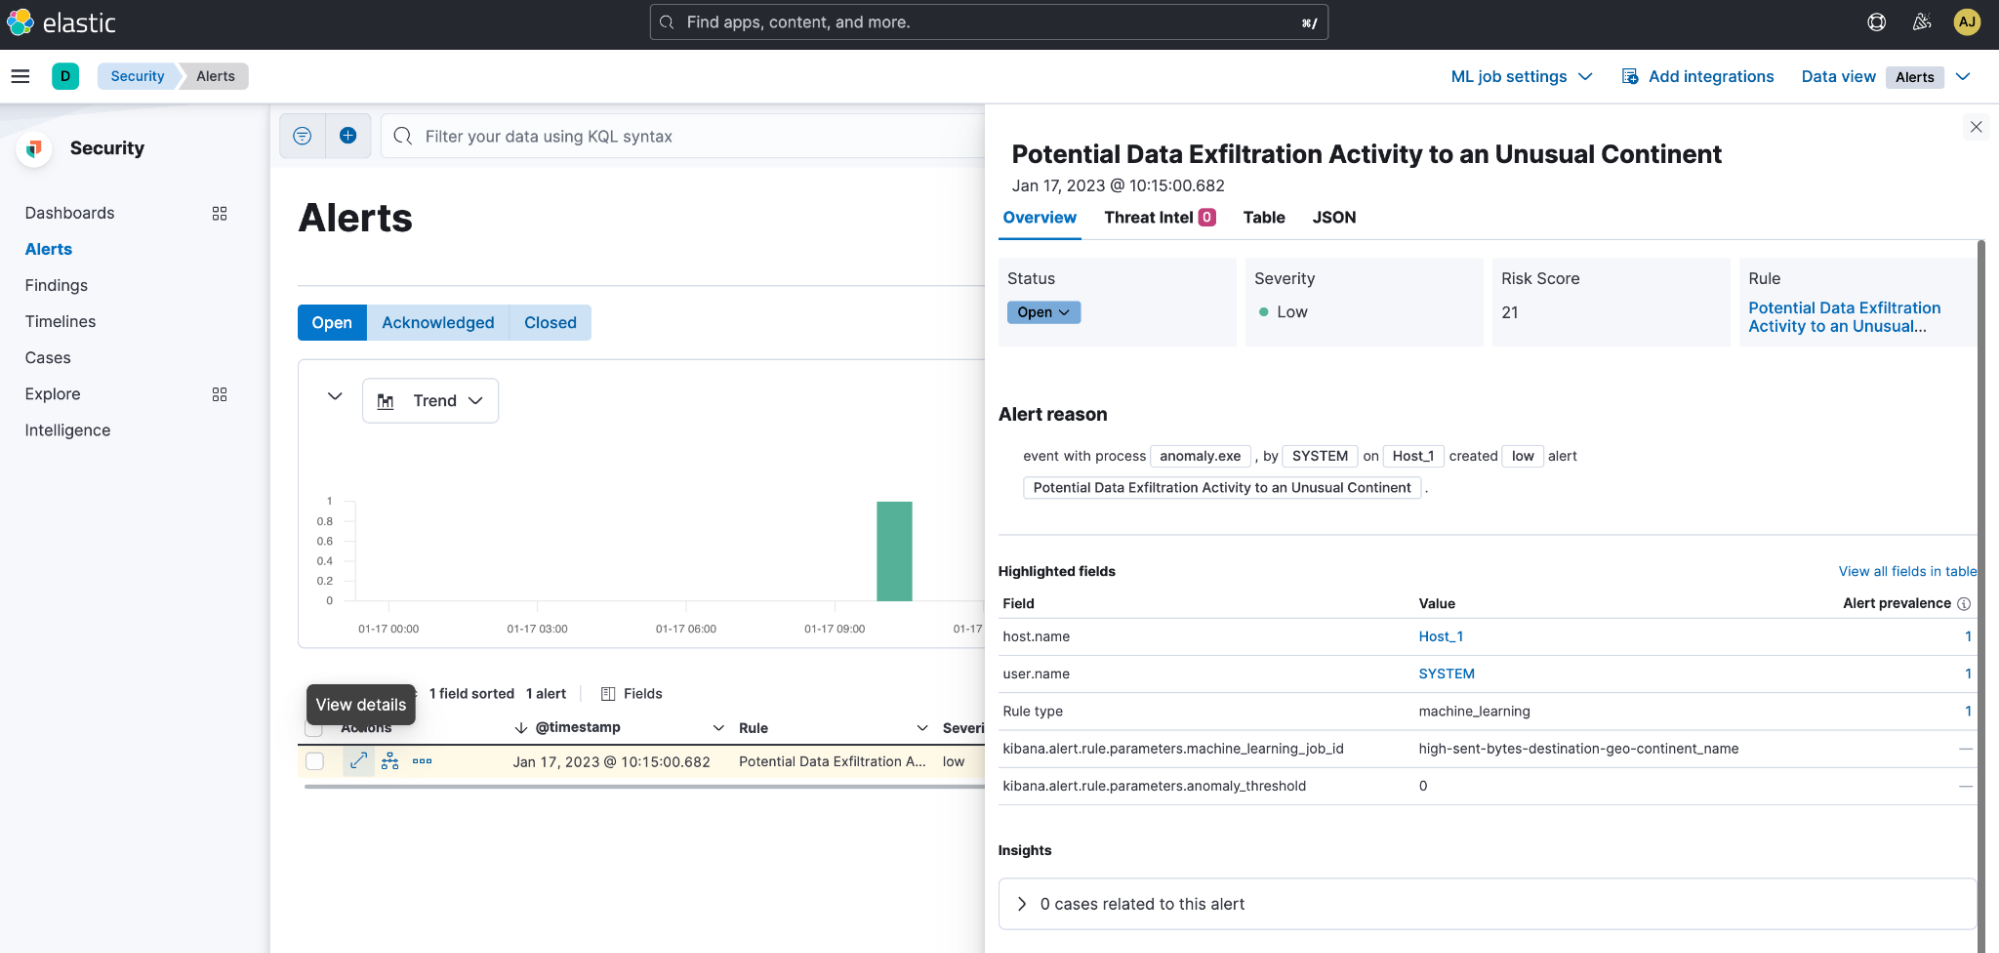
Alerts generated by the rules enabled in Step 3 can be viewed on the Alerts page:
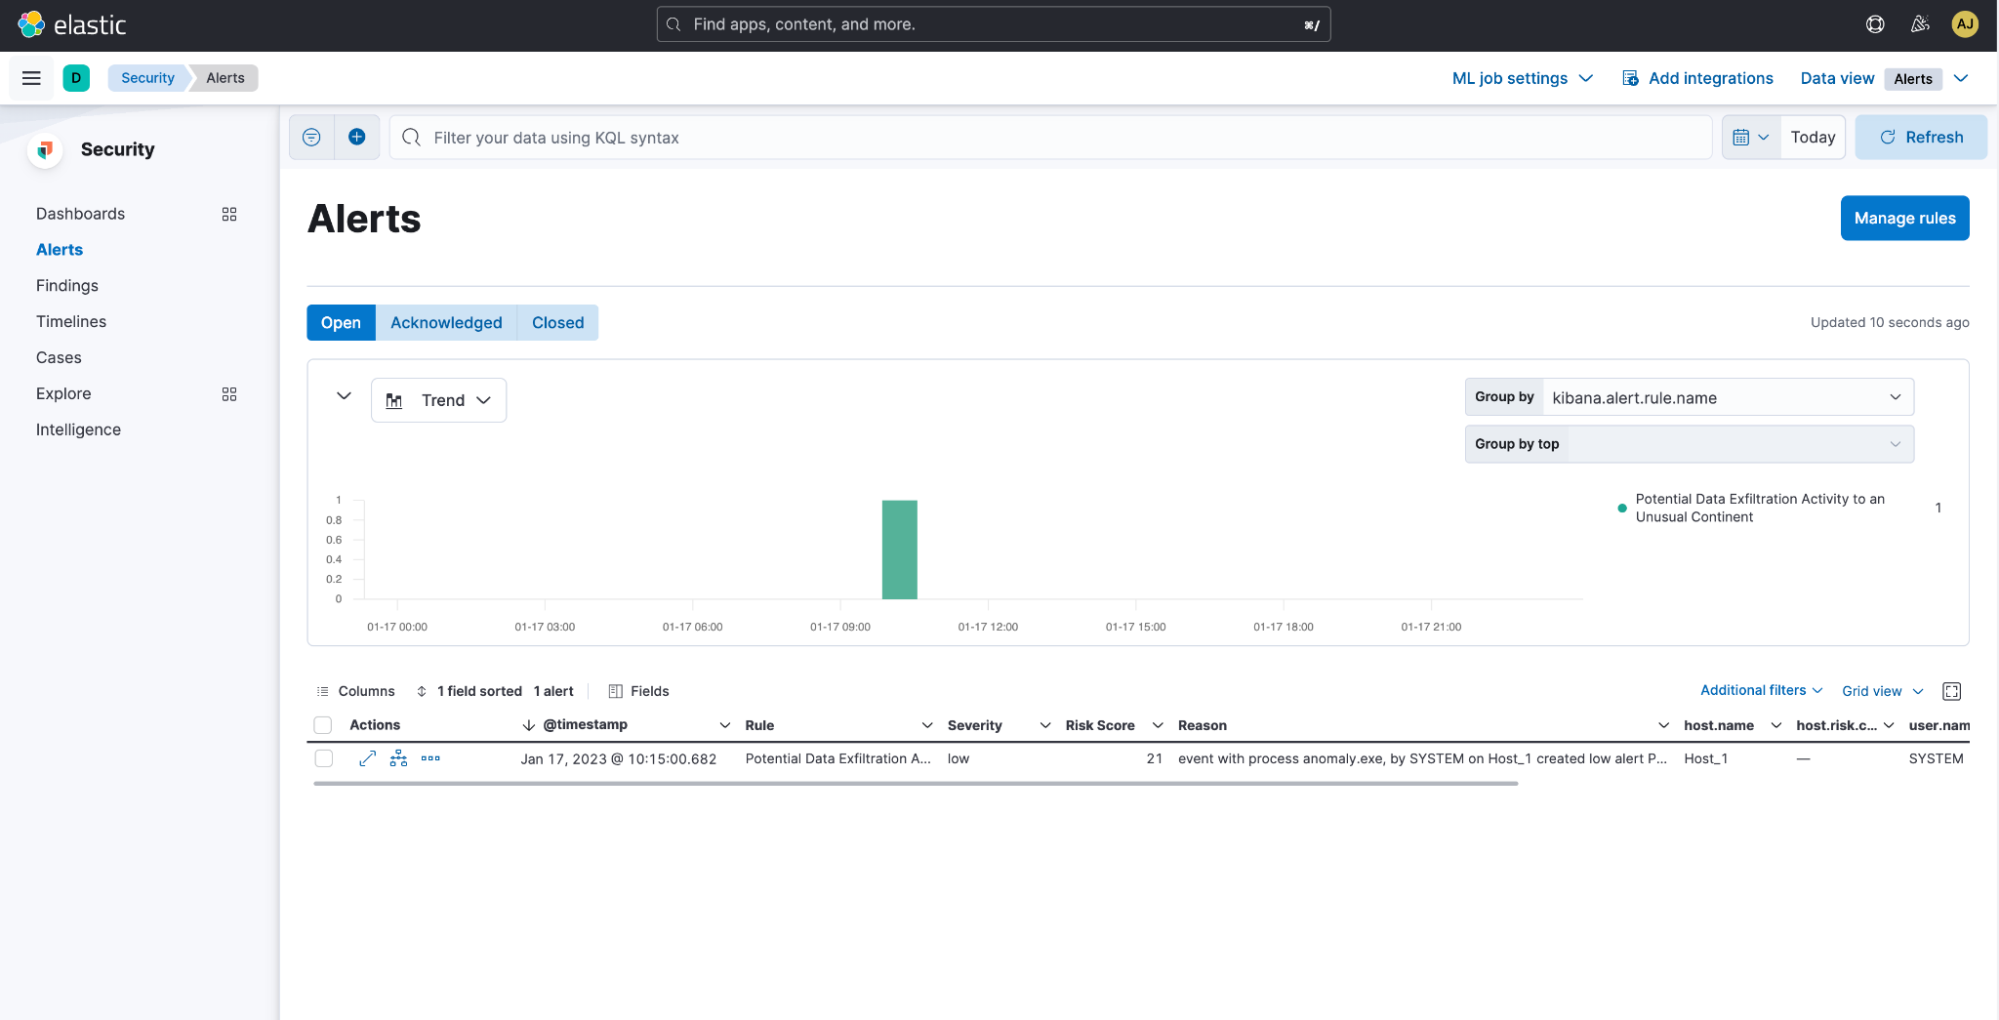
The Alerts flyout further shows useful details about the alert, such as the alert reasons, prevalence, etc., which can serve as pointers for further investigation.
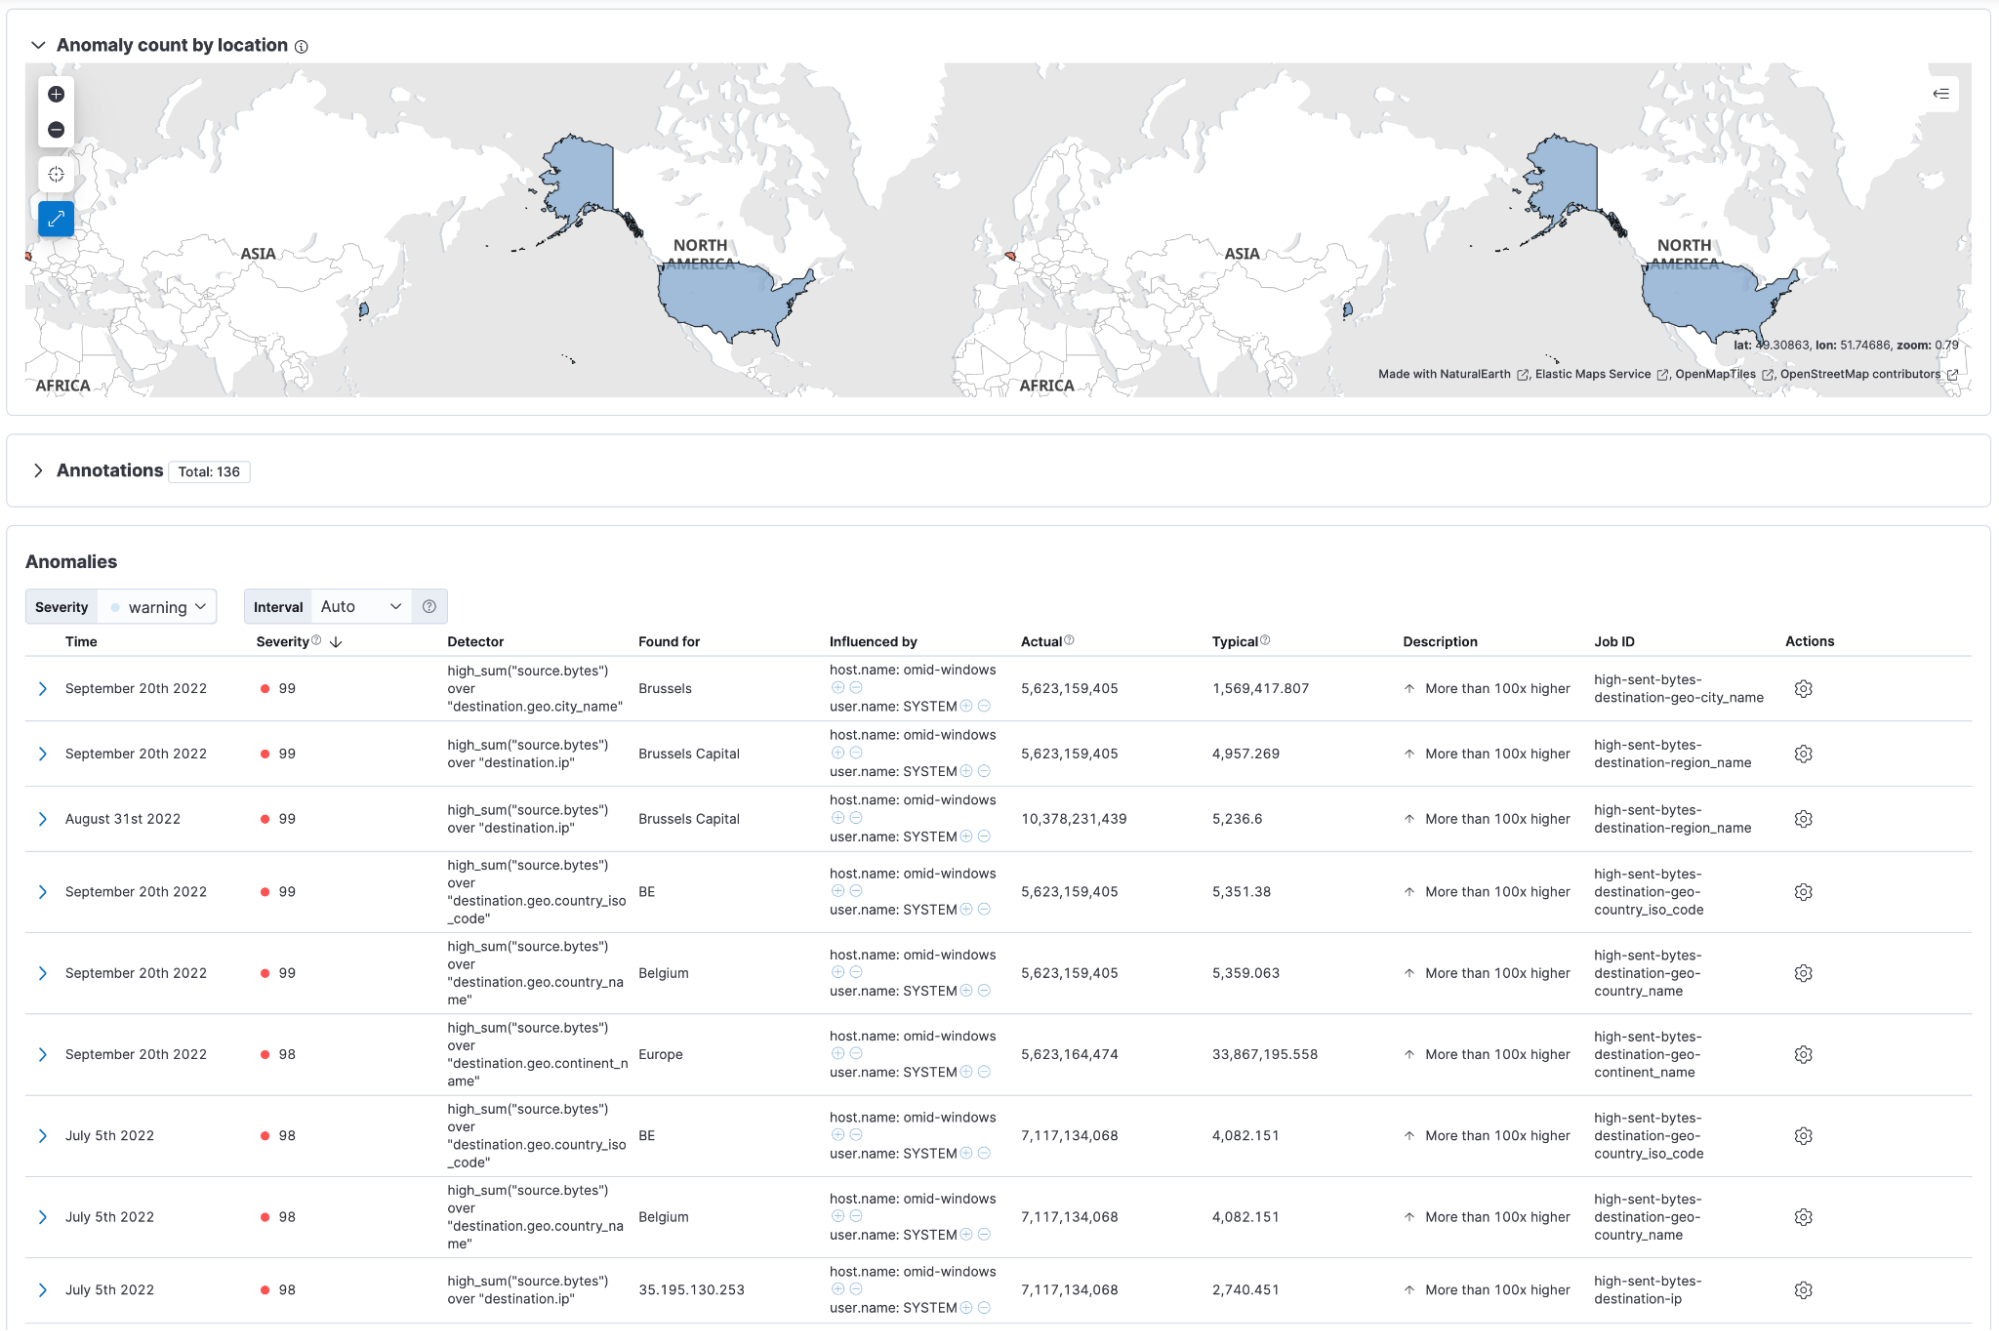
Furthermore, to visualize all the anomalies related to data exfiltration, navigate to Machine Learning > Anomaly Detection > Anomaly Explorer. Here, you can view a list of anomalies, severity, the job that the anomaly was detected by, and influencers, which are factors that the anomaly was influenced by.
Get in touch
We’d love for you to try out the Data Exfiltration Detection package and give us feedback as we work on adding new capabilities to it. If you run into any issues during the process, please reach out to us on our community Slack channel, discussion forums, or our open detections repository.
Share
- Share on Twitter
Share on Twitter
- Share on LinkedIn
Share on LinkedIn
- Share on Facebook
Share on Facebook
- Share by Email
Share by Email
- Print this page
Print