Elastic Uptime Monitoring 7.6.0 released
We are pleased to announce the release of Elastic Uptime Monitoring 7.6.0 — available on the Elasticsearch Service, or as part of the default distribution of the Elastic Stack. This release brings a whole new way to visualize your Heartbeat monitors in multiple geographic locations, a quick and simple way to view the latest test runs per monitor by geographic location, as well as support for filtering monitors by tags within Uptime.
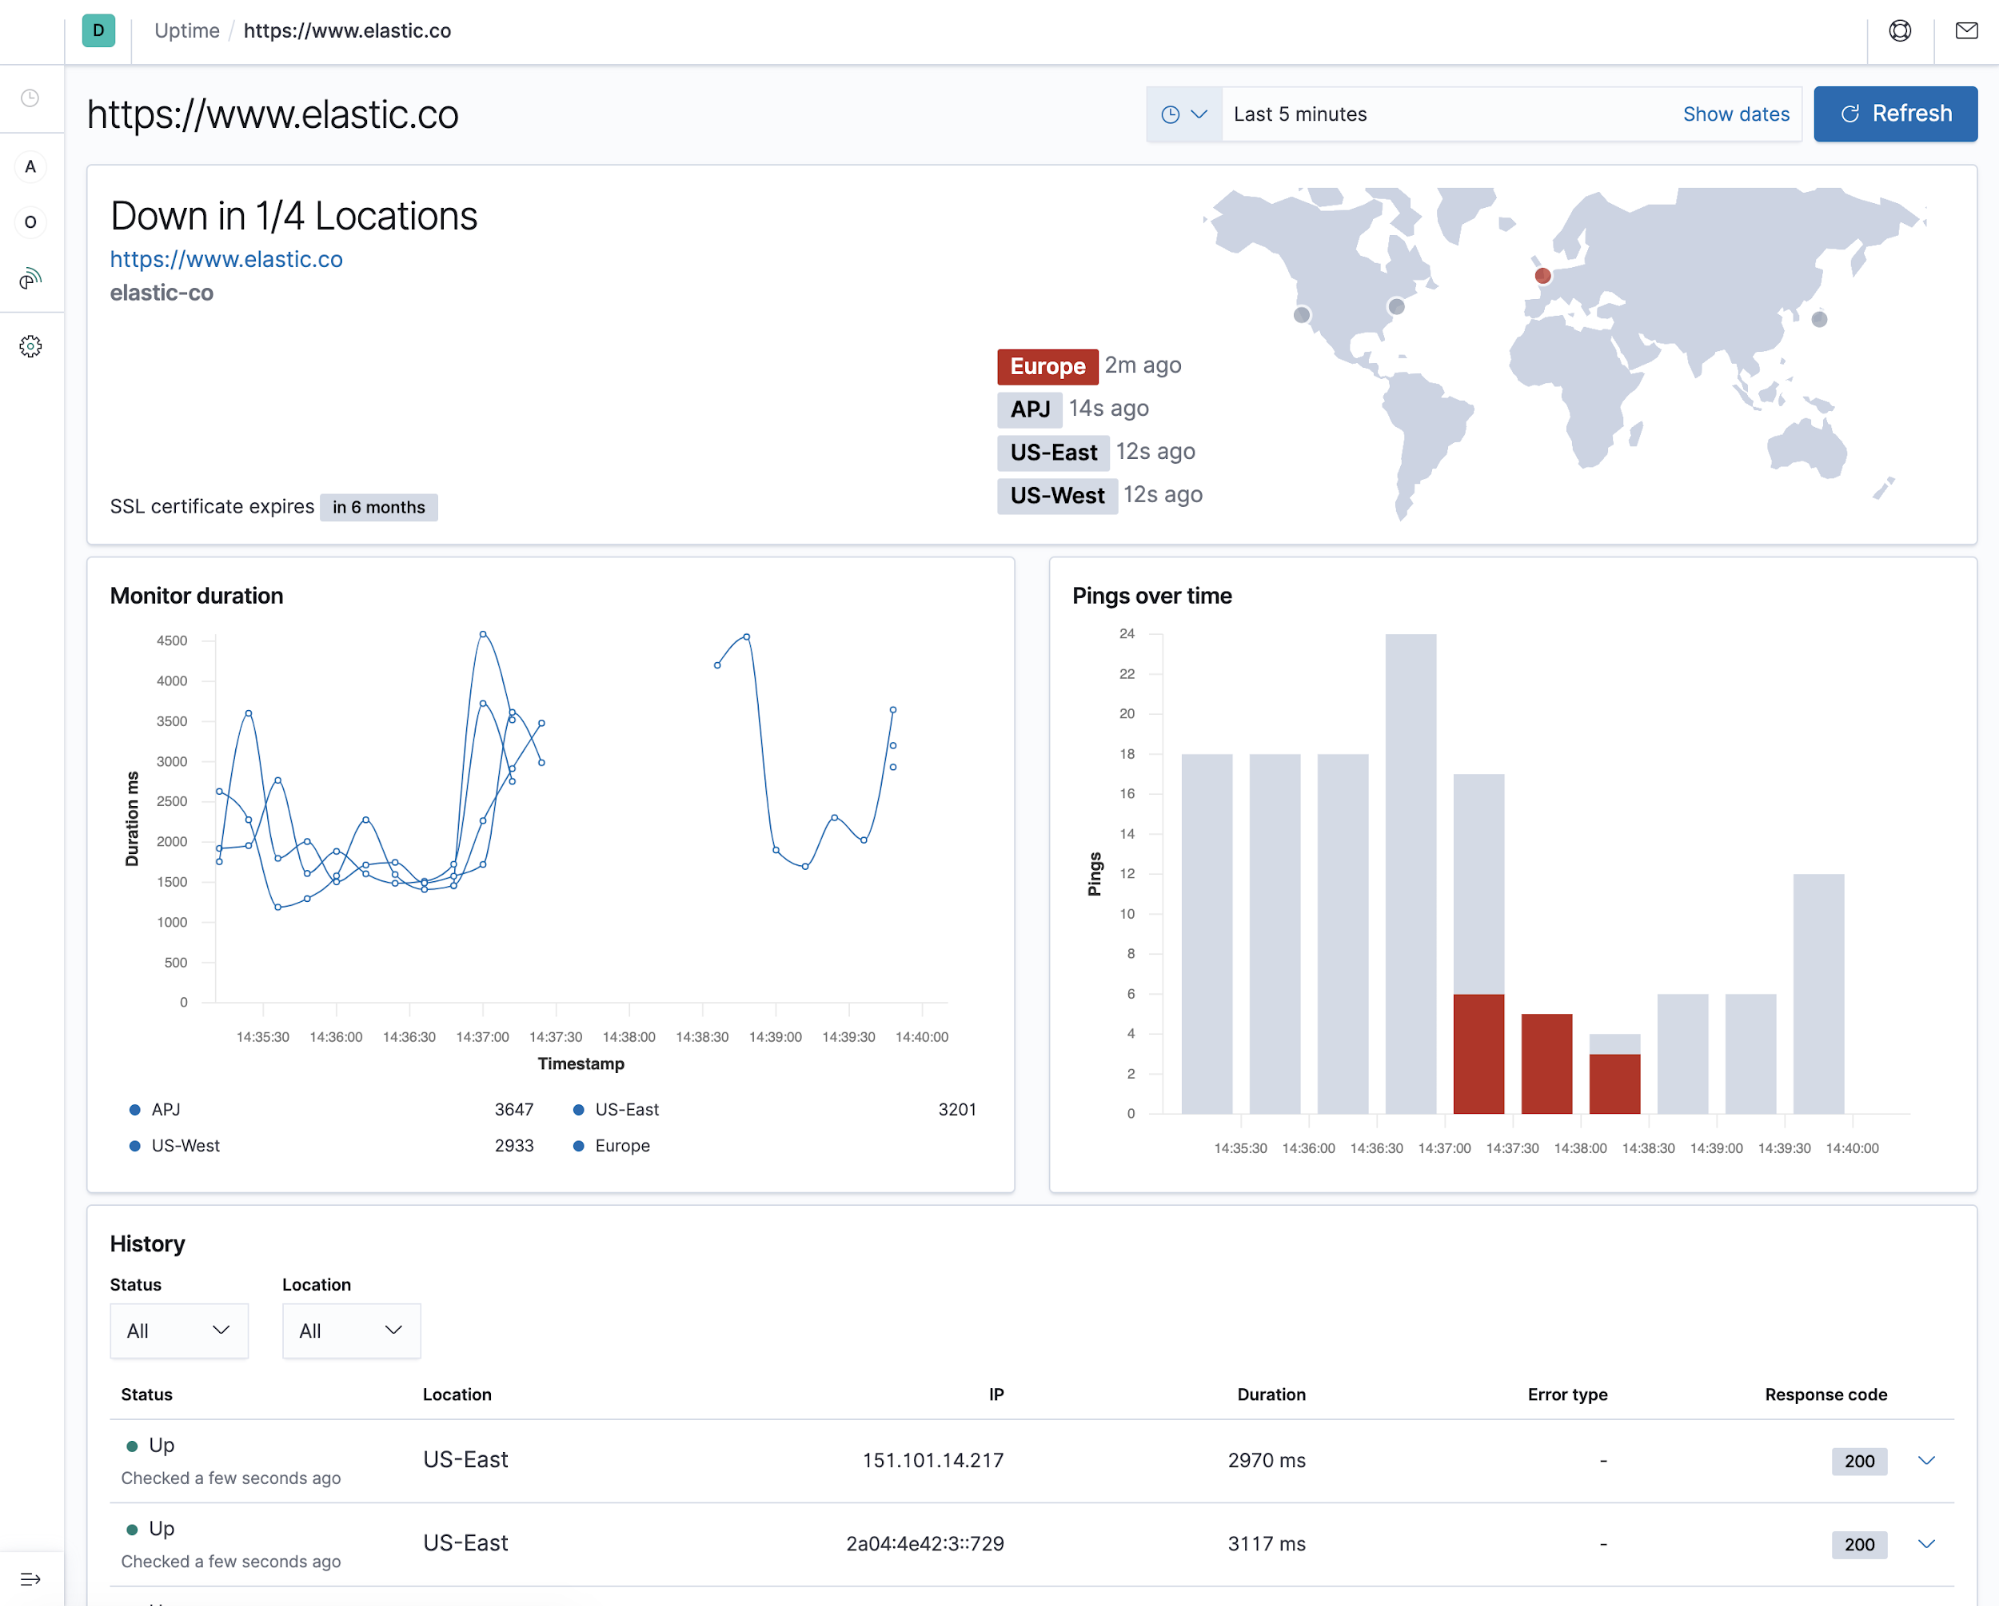
Details status panel and world map
This is a big improvement to Elastic Uptime and will be especially welcome to all of our users with Heartbeat monitors running from different geographic locations. Our new world map allows an “at-a-glance” way to see the status of your monitors without having to dig into individual test results.

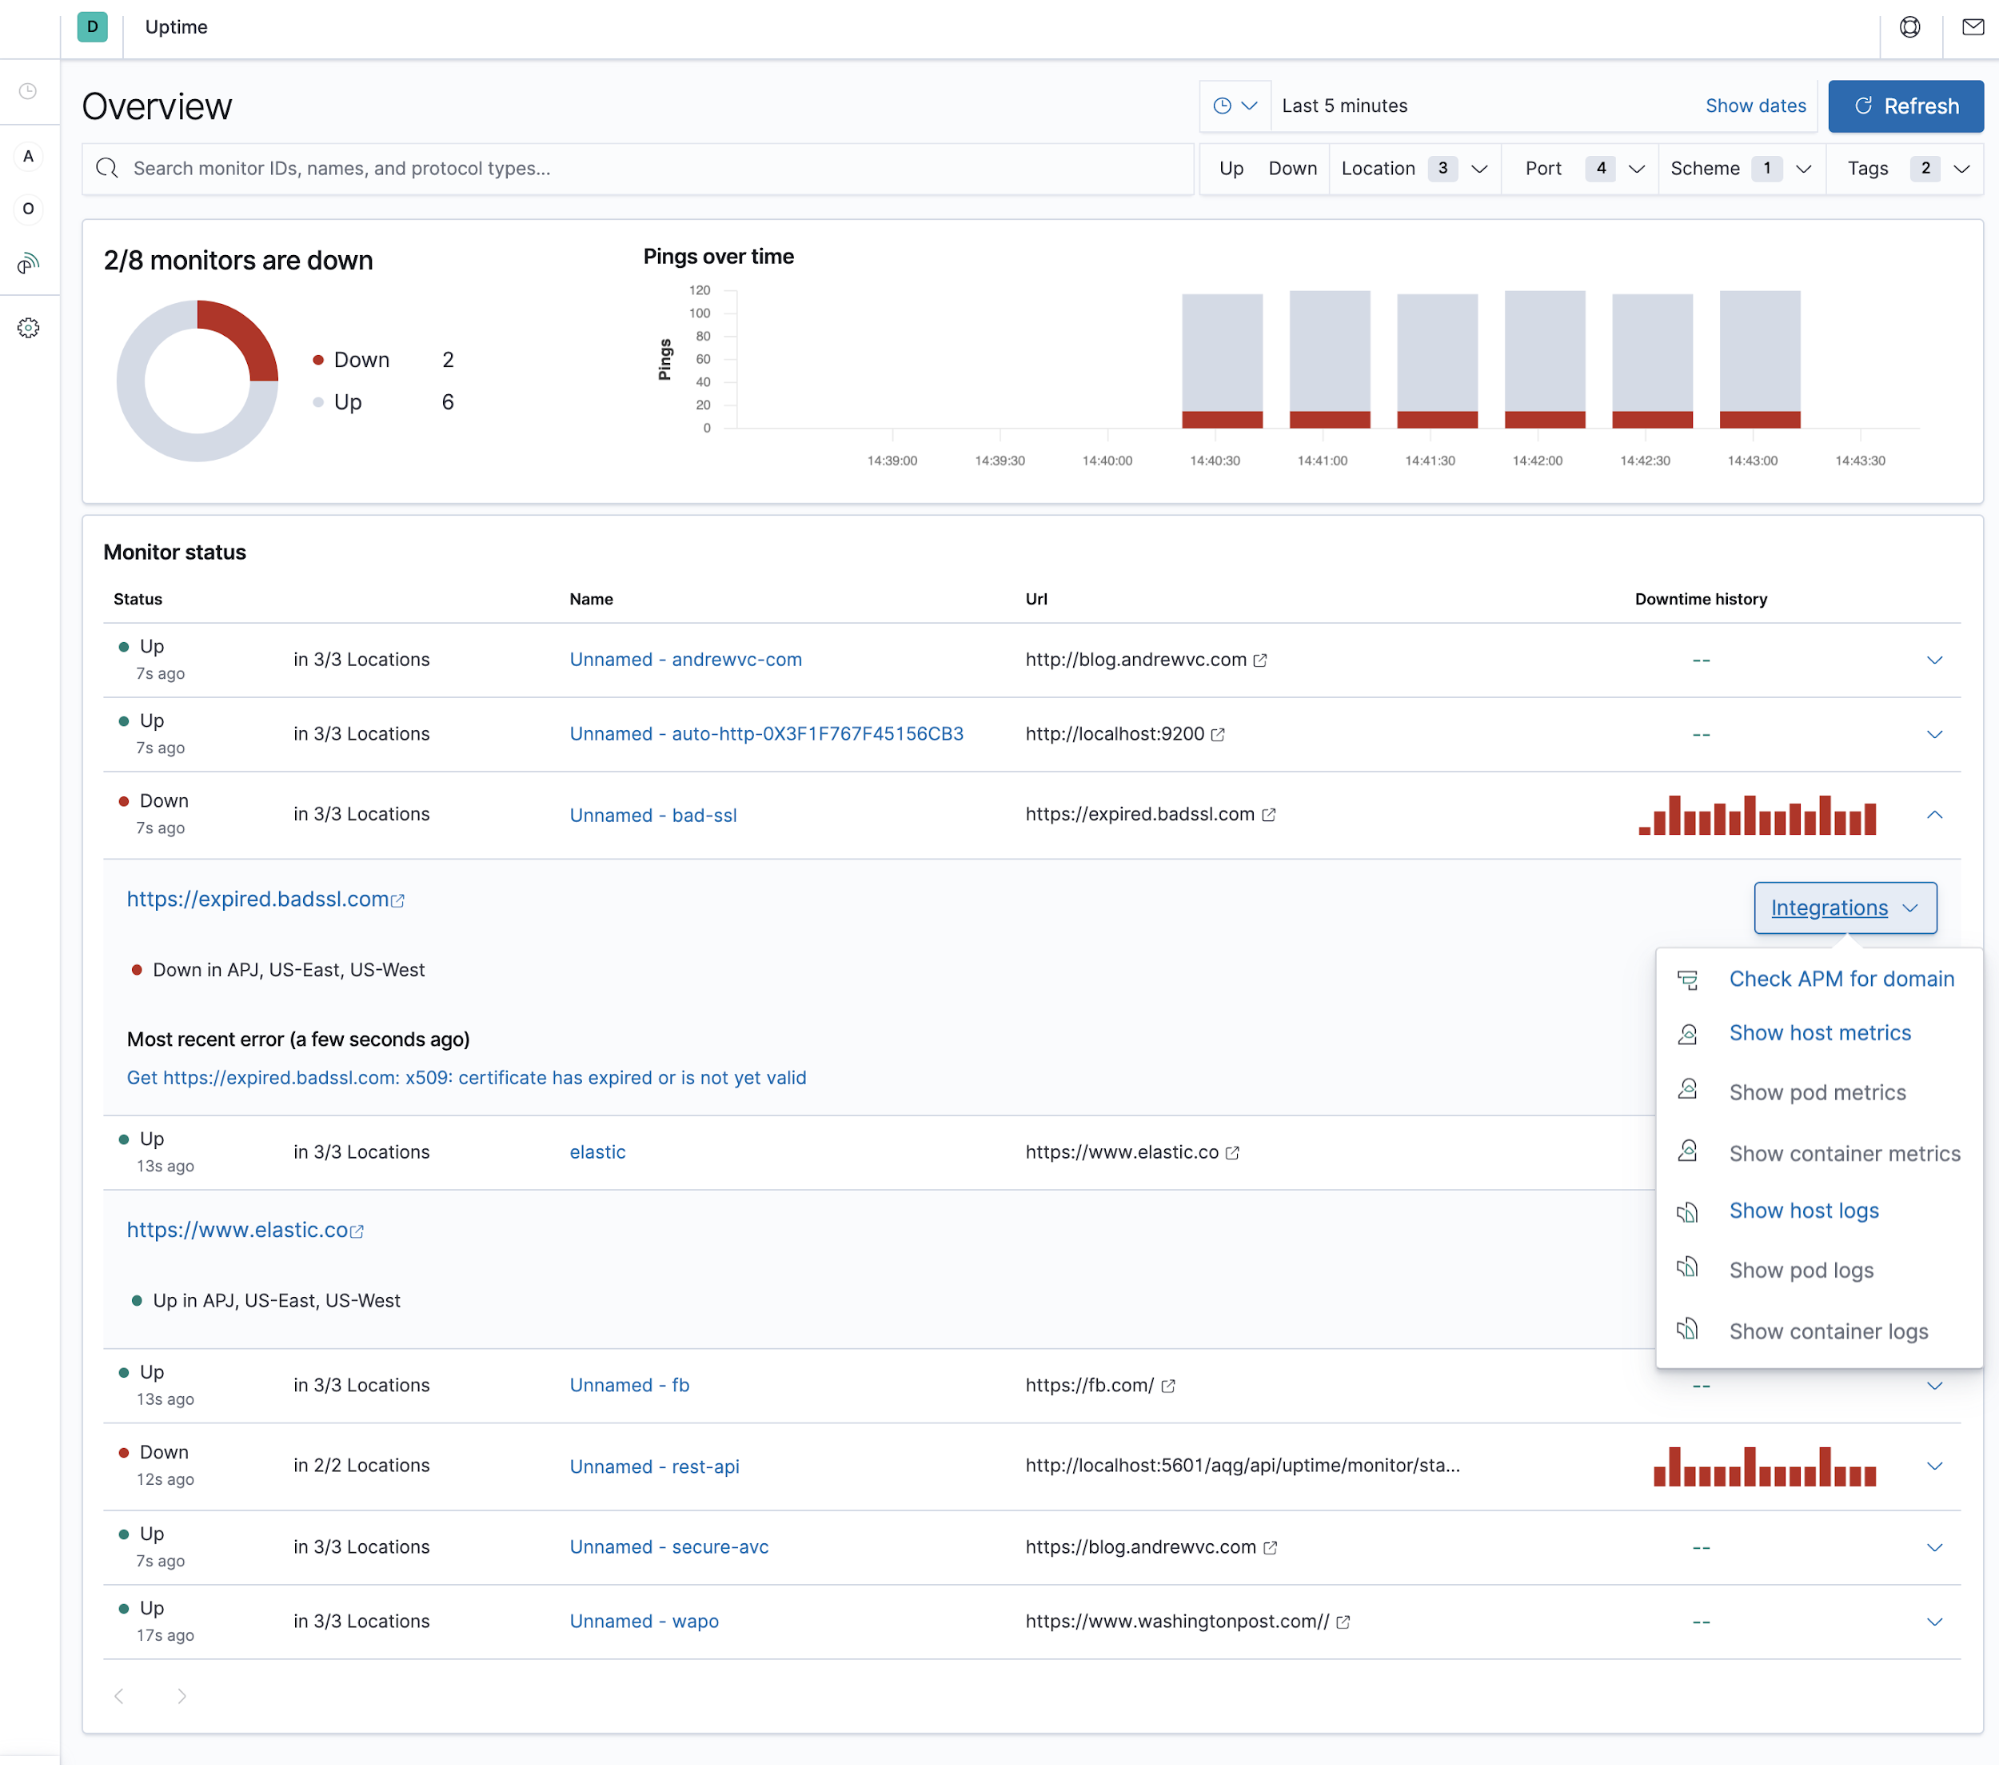
Monitor list expanded view
It is now possible to click on a monitor from the Monitor Overview page and see the most recent status by location. This condensed view helps you quickly and succinctly understand the performance of a given monitor from wherever you have Heartbeat configured.

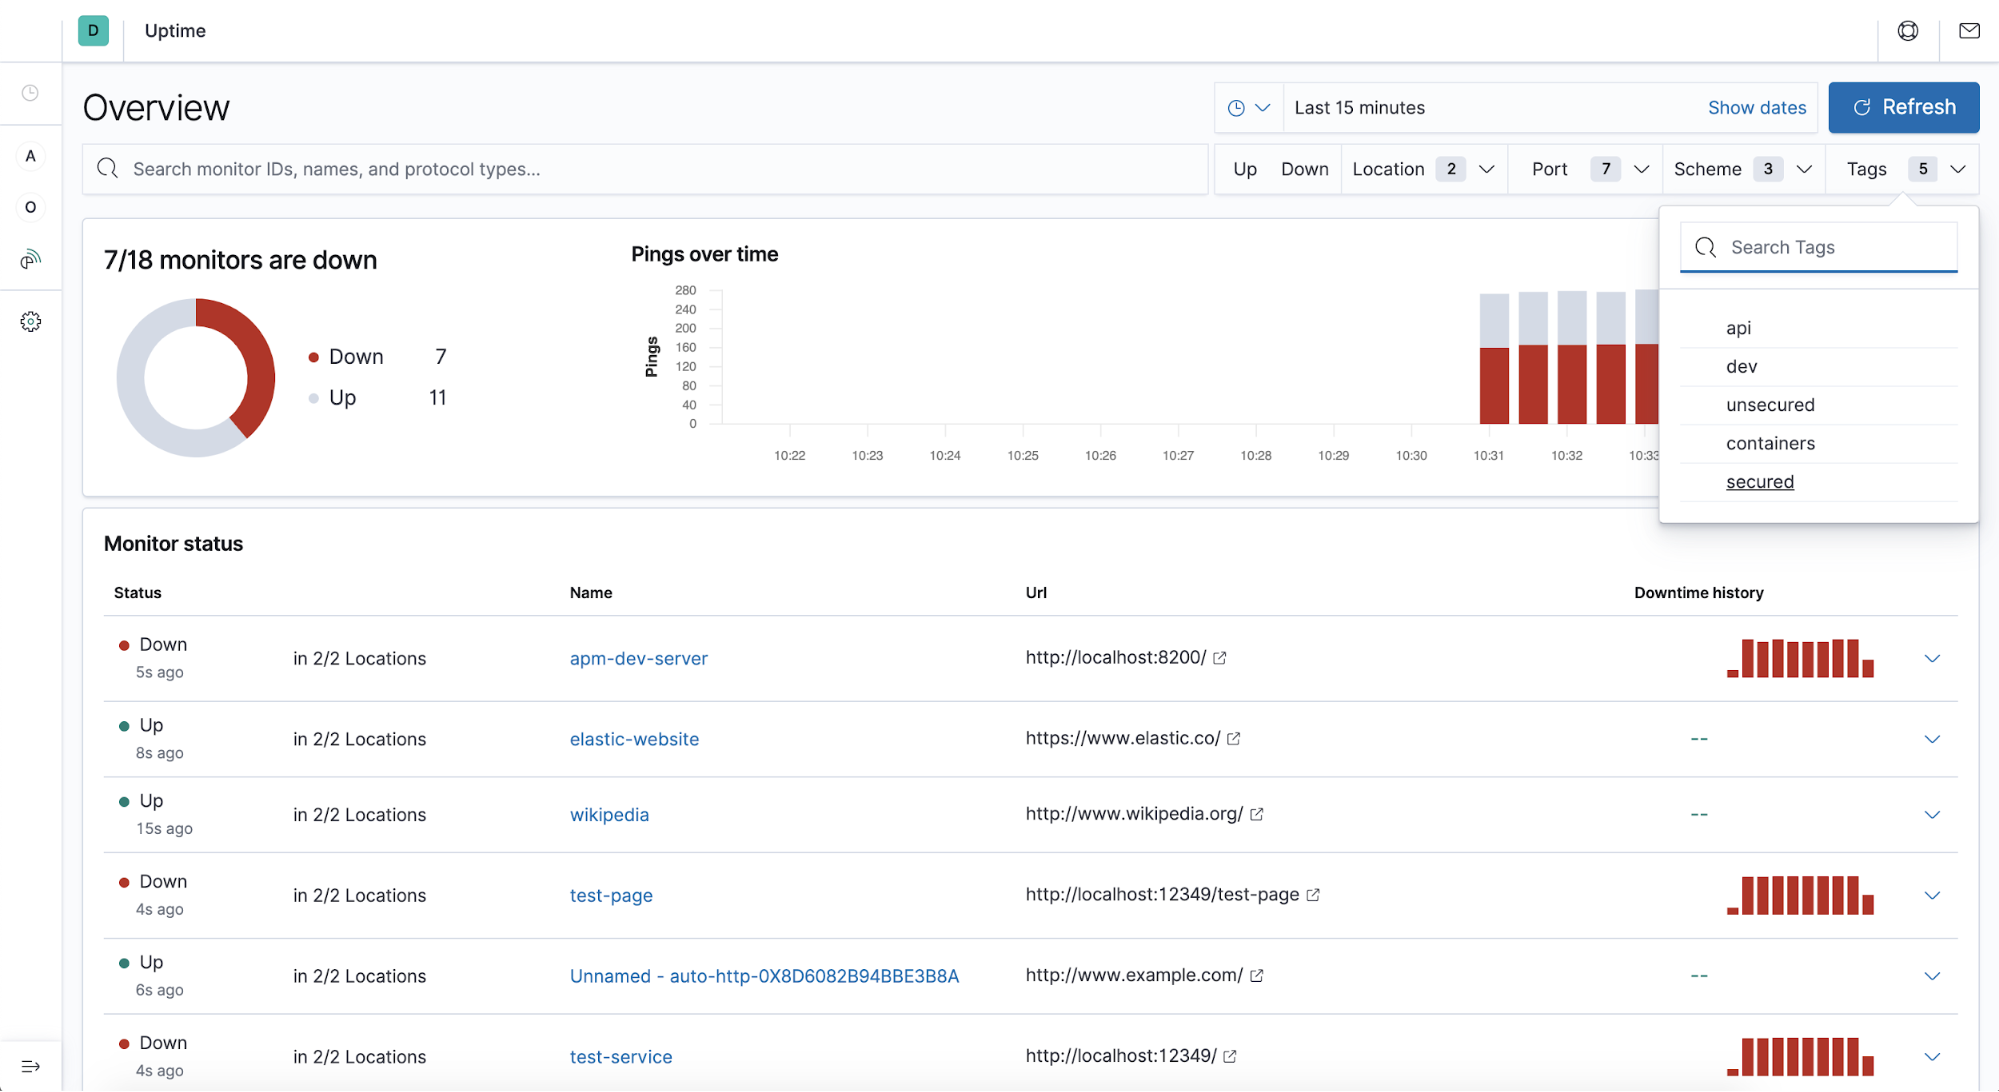
Support for tags and tag filters
With this release, you are able to filter the test results in Uptime by tags. This is especially useful for users with large Heartbeat deployments. Use tags to focus on what you need, when you need it.

Want to see it in action?
You can access the latest version of the Elastic Uptime application on the Elasticsearch Service on Elastic Cloud, or you can download it as part of the default distribution of the Elastic Stack. Download Heartbeat, follow the instructions on how to set it up, and start monitoring your applications and services today.