Tuning Go Apps with Metricbeat
The Elastic Stack can be easily leveraged to monitor Go applications. It allows to do things like analyzing memory usage (memory leaks anyone?), performing long-term monitoring, tuning and capturing diagnostics. Beats in particular, the lightweight data shippers in the Stack, are designed to sit alongside the applications and are a natural fit for this kind of monitoring.
Metricbeat is a Beat specialized in shipping service and/or server metrics, but also happens to be written in Go. It ships in a relatively small package (only about 10MB), and does not bring any additional dependencies with it. While its CPU overhead and memory footprint are also very light, it ships with modules for a variety of services such as:
- Apache
- Couchbase
- Docker
- HAProxy
- Kafka
- MongoDB
- MySQL
- Nginx
- PostgreSQL
- Prometheus
- Redis
- System
- ZooKeeper
If the service you’re looking for is not listed, don’t worry: Metricbeat is extensible and you can easily implement a module (and this post is proof of that!). We’d like to introduce you to the Golang Module for Metricbeat. It has merged into the master branch of elastic/beats, and is expected to be released in version 6.0.
Sneak preview
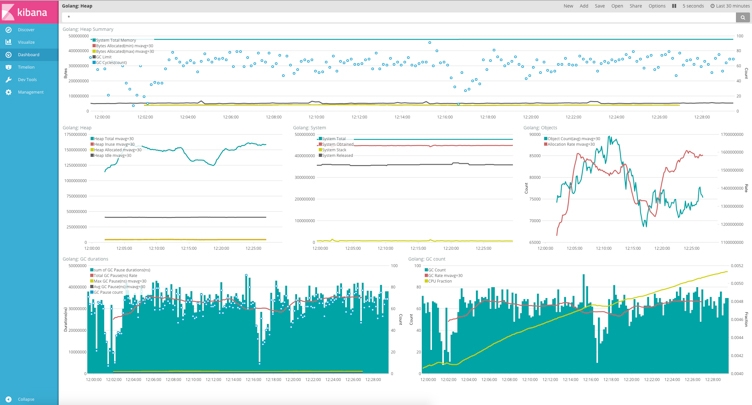
Here’s a Kibana Dashboard that captures the potential of the Golang Module for Metricbeat:

The top panel shows a summary of the heap usage, which gives us a general idea of
- System Total Memory: the total number of bytes obtained from the system
- Bytes allocated: overall bytes allocated, including memory that has since been freed
- GC cycles: the number of garbage collections (GC) that occurred
- GC limit: when heap memory allocation reaches this limit, the garbage collector is started. This can be different in each GC
The middle panel has three charts in it with a breakdown of:
- heap memory
- system memory
- object statistics
Heap Allocated represents both memory in use and not yet reclaimed, while Heap Inuse is obviously the size of objects that are active. Heap Idle accounts for objects that have been allocated but can be reclaimed as free memory.
The two charts in the bottom panel are the GC time and GC count statistics. CPU Fraction represents the percentage of CPU time spent on GC. The greater the value, the more frequently GC occurs, in other words more time wasted on GC. The trend seems upward and pretty steep, but the range of values is between 0.41% and 0.52% so not too worrisome. Normally the GC ratio warns an optimization in the code when it goes into the single digits.
Memory leaks
With this information we will be able to know in much detail about Go's memory usage, distribution and GC implementation. For instance if we wanted to analyze whether there is a memory leak, we could check if the memory usage and heap memory allocation are somewhat stable. If for example GC Limit and Byte Allocation are clearly rising, it could be due to a memory leak.
Historical information gives us great granularity in analyzing memory usage and GC patterns across different versions, or even commits!
Great, now how do I get it?
expvar
First things first, we need to enable Go's expvar service. expvar is a package in Go's standard library that exposes internal variables or statistics. Its usage is very simple, it's basically just a matter of importing the package in the application. It will automatically detect and register to an existing HTTP server:
If no HTTP server is available, the code below allows us to start one on port 6060:
The path registered by default is /debug/vars, we can access it at http://localhost:6060/debug/vars. It will expose data in JSON format, by default provides Go's runtime.Memstats but of course we can also register our own variables.
Go Metricbeat!
Now that we have an application with expvar, we can use Metricbeat to get this information into Elasticsearch. The installation of Metricbeat is very simple, it's just a matter of downloading a package. Before starting Metricbeat we just need modify the configuration file (metricbeat.yml) to enable the golang module:
The above configuration enables the Go monitoring module to poll for data every 10 seconds from heap.path. The other info that matters in the configuration file is the output:
Now assuming Elasticsearch is already running, we can finally start Metricbeat:
Now we are in business! Elasticsearch should have data, we can now start Kibana and customize the visualization for our needs. For this type of analysis Timelion is a particulary good fit, and to get started quickly we can leverage the existing sample Kibana Dashobards for Metricbeat.
More than memory
In addition to monitoring the existing memory information, through expvar we can expose some additional internal information. For example we could do something like:
It's also possible to expose Metricbeat's internal stats, so it can basically can monitor itself. It can be done via the -httpprof option:
Now we can navigate to http://127.0.0.1:6060/debug/vars and see statistics about the Elasticsearch output such as output.elasticsearch.events.acked, which represents the message sent to Elasticsearch for which Metricbeat received an ACK:
We Metricbeat exposing its own metrics, we can modify its configuration to use both sets of metrics. We can do so by adding a new expvar type:
As you can see we also used the namespace parameter and set it to metricbeat. We can now restart Metricbeat and we should start seeing the new metric.
Timelion
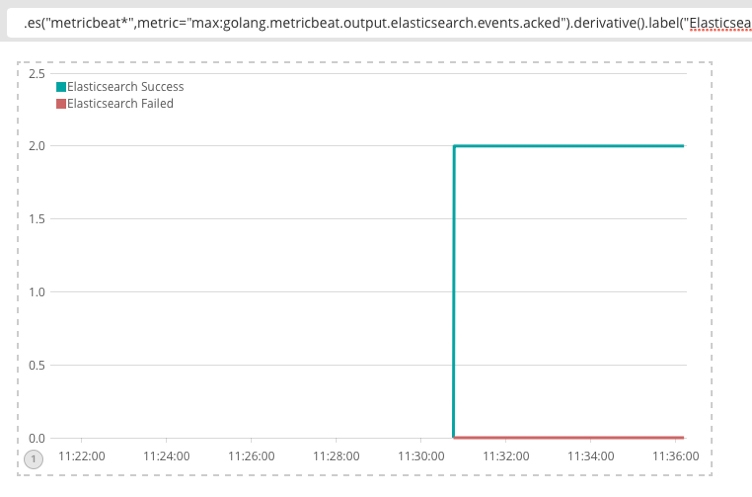
We can take the output.elasticsearch.events.acked and output.elasticsearch.events.not_acked fields and use a simple Timelion expression to plot successes and failures in messages from Metricbeat to Elasticsearch:
Here's the result in Kibana:

From the chart the channel between Metricbeat and Elasticsearch appears to be stable and no messages were lost.
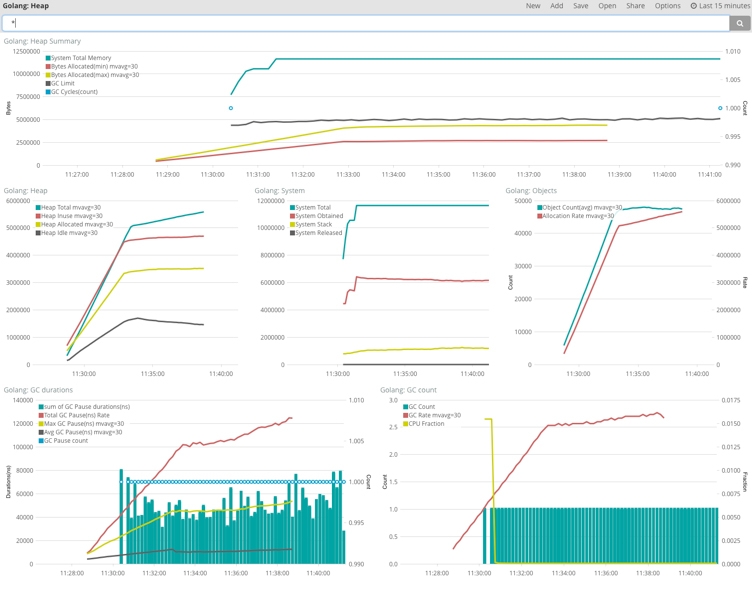
Finally, we can also compare the Metricbeat memory stats around the same time on the dashboard:

Coming up in Beats 6
This module will be released with Beats 6.0, but you can start using it right now by cloning (or forking ;) the Beats repo on GitHub and building the binary yourself.
Banner image credit: golang.org