What’s new in Kibana 7.14: Formulas and time shifts for richer ad hoc analysis
Kibana 7.14 introduces more capabilities for ad hoc analytics to enable users to cut through the noise and discover insights faster and more easily.
These new features include custom formulas and time-shifted metrics in Kibana Lens and a time slider in Elastic Maps–all without compromising speed. In addition:
- Time-shifted metrics and a time slider in Kibana Lens and Elastic Maps allow users to compare data from different time periods at a glance.
- Custom formulas in Kibana Lens and edit tools in Elastic Maps give users the creative freedom to author metrics and add to geo indices.
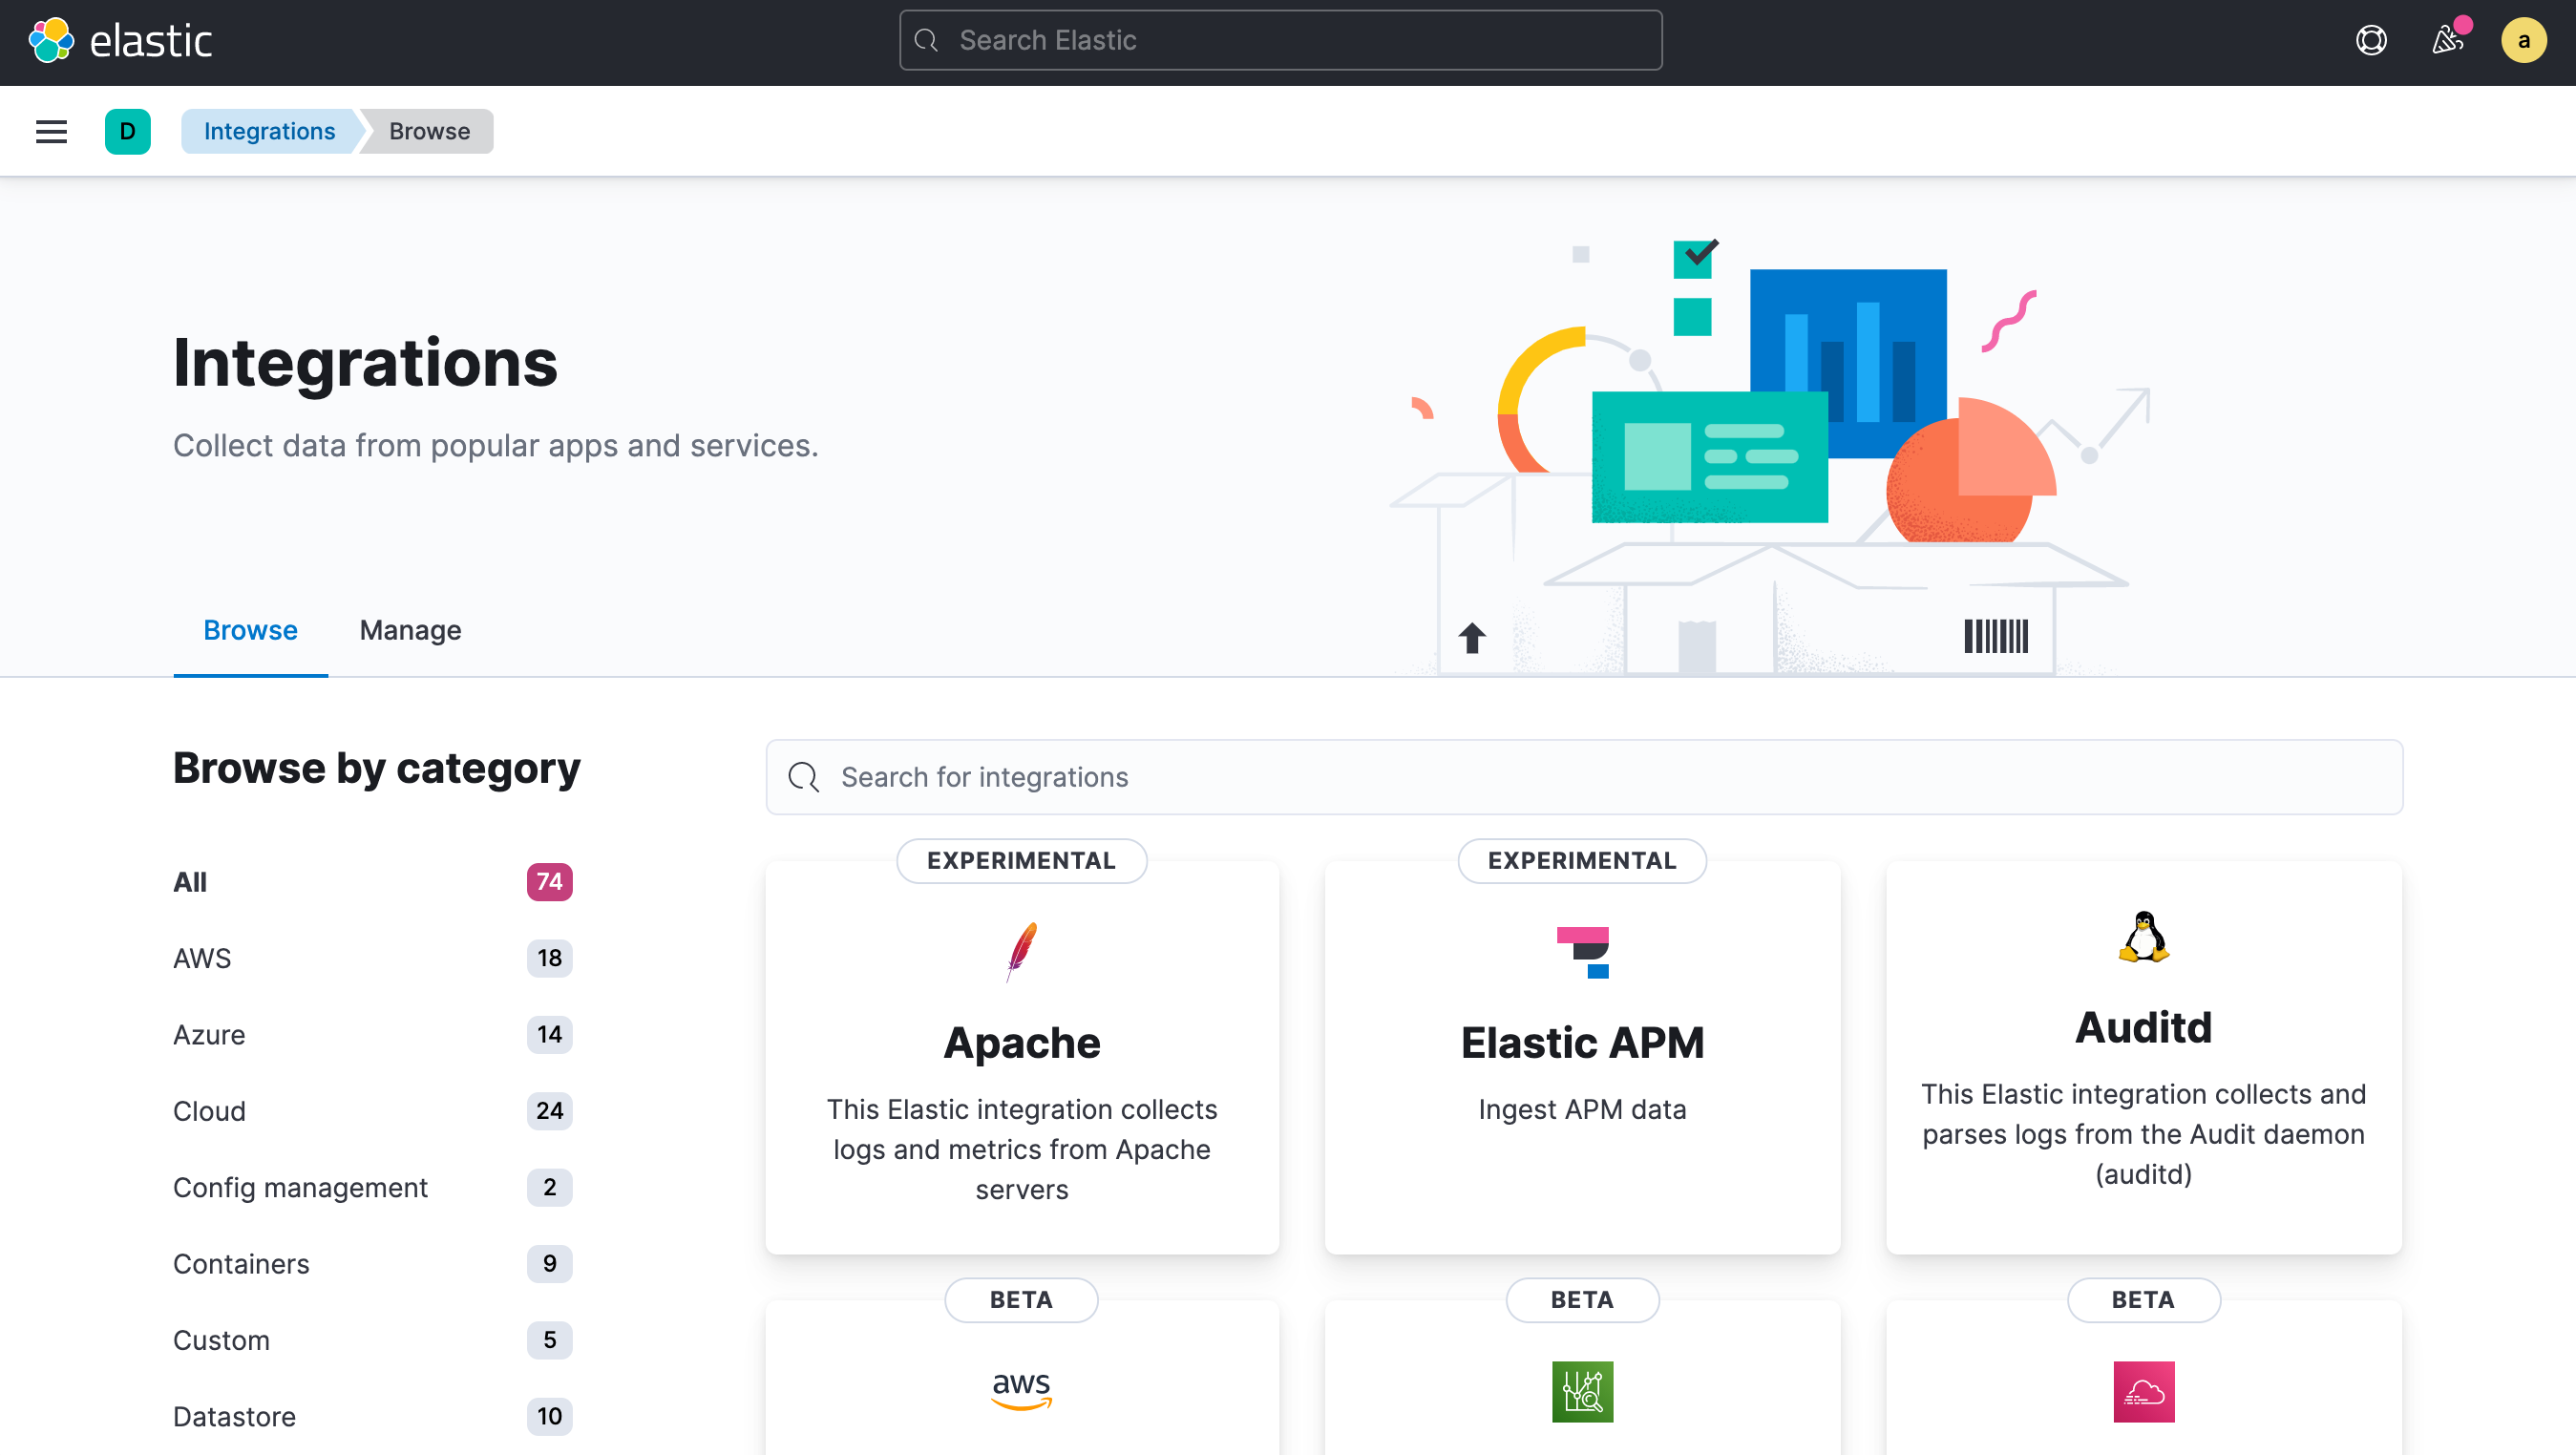
- Elastic Agent, a unified agent for collecting data from multiple sources and protecting your data and hosts, is generally available. Users can choose from 100+ out-of-the-box integrations that are pre-loaded with Kibana assets like dashboards, visualizations, and maps for a faster data-to-dashboard experience.
Kibana 7.14 is available now on Elastic Cloud — the only hosted Elasticsearch offering to include all of the new features in this latest release. You can also download the Elastic Stack and our cloud orchestration products, Elastic Cloud Enterprise and Elastic Cloud for Kubernetes, for a self-managed experience.
Navigate swiftly through time, space, and beyond with time-shifted metrics and the time slider
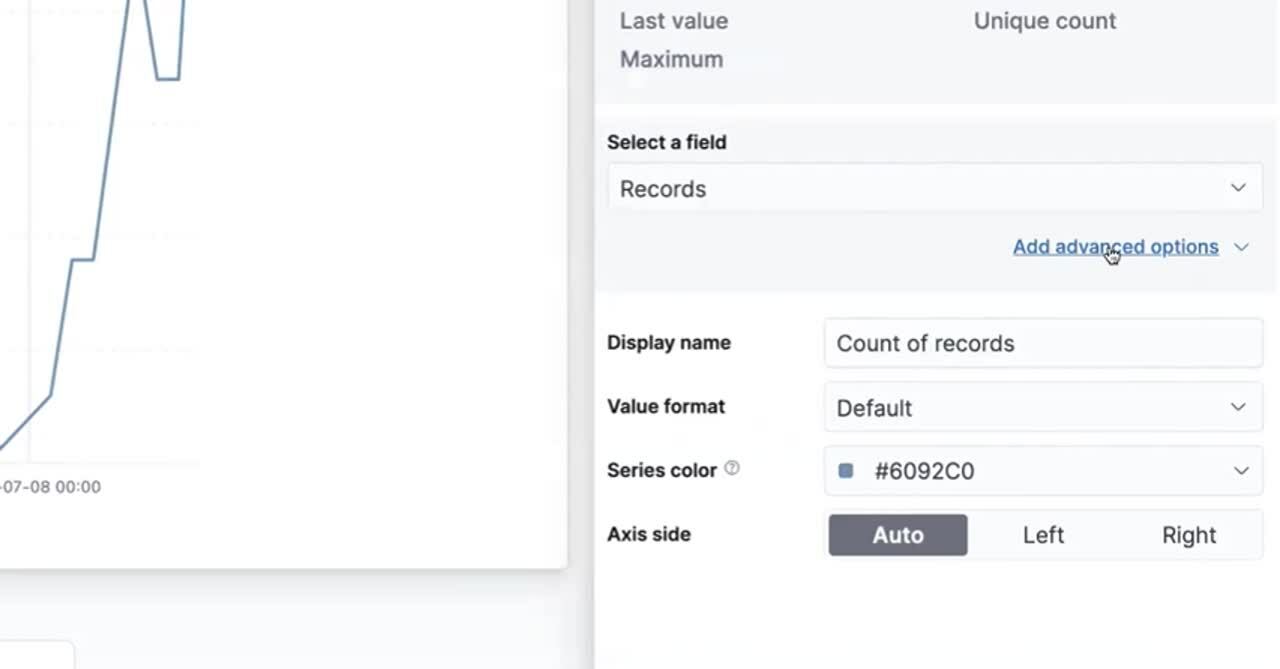
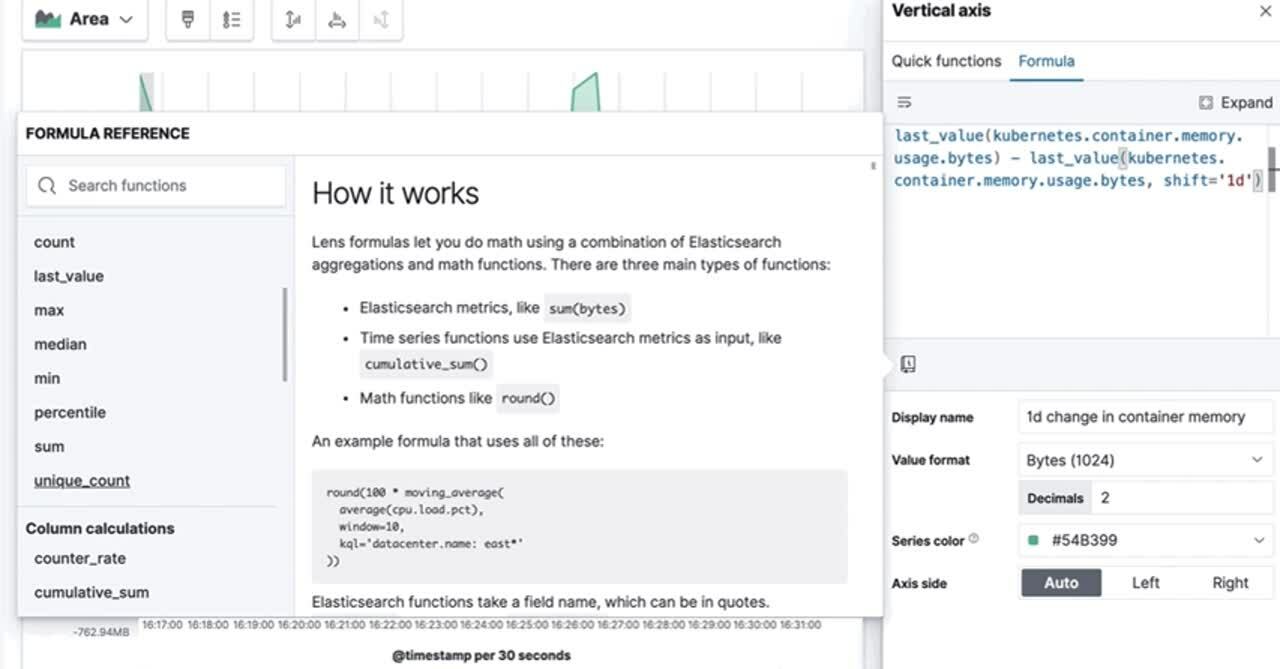
When you spot a data discrepancy on your dashboard or a point-of-interest on your map, you kick off your journey to figure out the why. From your dashboard, jump into a visualization in Kibana Lens and start to lay the groundwork for digging through data and uncovering insights. Comparing time series data like webpage statuses from one month to the next? Use the new time-shifted metrics to easily compare two different time periods and spot trends quickly. Looking for extremes or outliers in a table? Use the color-by-value setting to apply colors to percent or number values to identify the most relevant data or customize your color palette to tell a better data story on your dashboard.
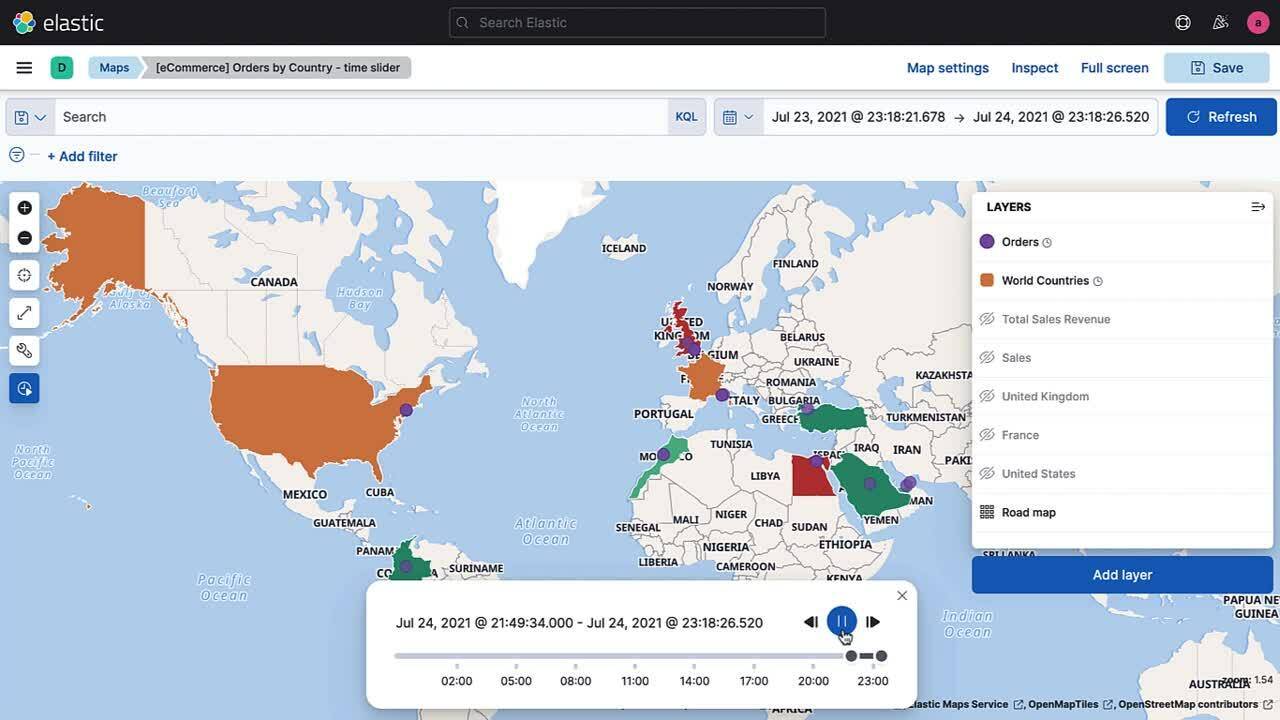
Help your dashboard users choose-their-own-adventure by making any map an interactive filter for the rest of your dashboard. You can zoom in on any point-of-interest and filter the rest of your dashboard updates, helping explore any curious observations. From there, dive into Elastic Maps and start using your new comparison feature, the time slider, to play through, rewind, or fast-forward through subsets of time on your map. You can quickly spot shifts in your geospatial data over time and pause the time slider to analyze points-of-interests further.
If you find your answer here, keep looking — the best thing about this ad hoc analysis exploration is that you can start from any visualization and pivot rapidly to explore another one. Our 7.14 visualization features do the heavy lifting when you sift through data, so that you have more bandwidth to focus on the critical questions.
Forge your own path to insights by authoring metrics with formulas and editing maps
No data analysis is complete without a moment of “Wow, I wish I had x so that I could see y.” Sometimes, you need a specific calculation to answer your questions. You now have the ability to define custom formulas in Kibana Lens to easily combine math and metrics to tell a richer data story. Using simple math and aggregated fields in an intuitive editor with autocompleting capabilities, you can build ratios, week-over-week comparisons, and percent-of-total calculations. You can also use any supported Elasticsearch aggregation and other column calculations like differences. Trying out different formulas over time in a line visualization or as a new column in a table allows you to create new avenues for exploring and presenting your data.
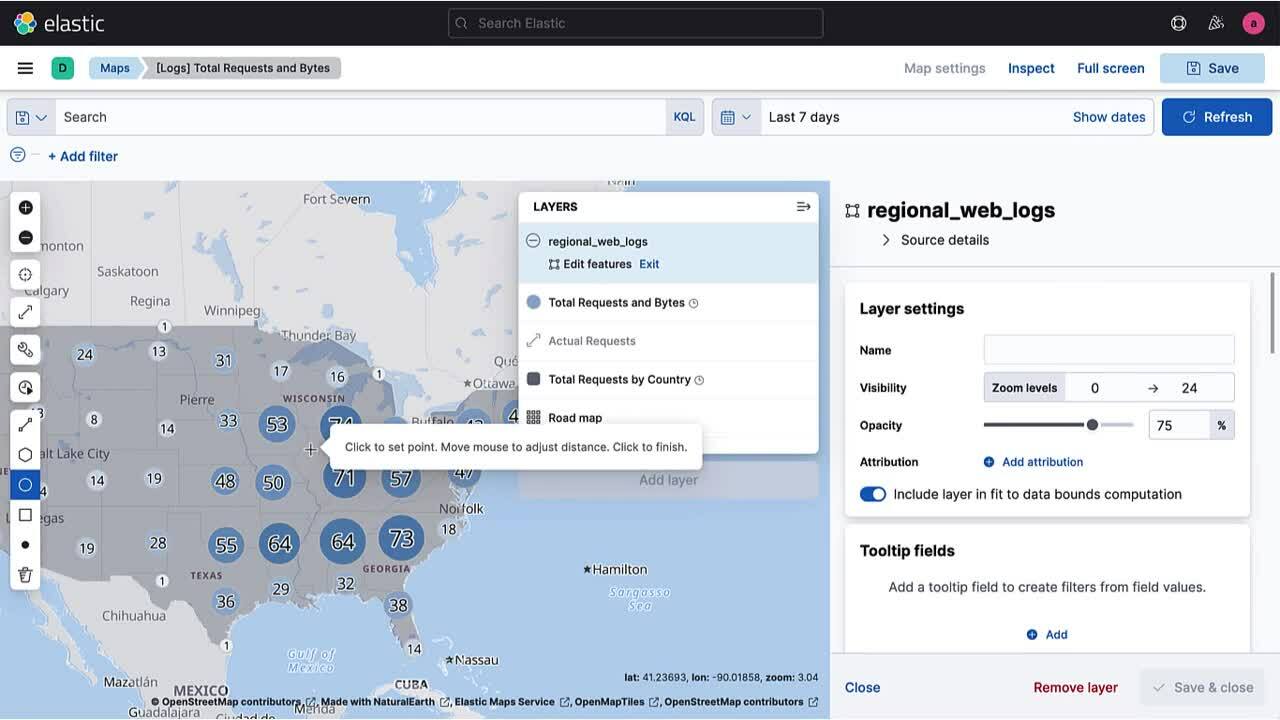
Looking for a way to ensure that “x” (or perhaps a point) marks the spot on your maps? The new edit tools (beta) in Elastic Maps can help you note your points-of-interest by creating or editing an index and drawing elements on your map. You can easily use points, lines, and shapes, including circles with the added bonus of measuring radial distance (also available for spatial filters). Being able to update your geodata as you go gives you the freedom and speed to explore more without the added step of ingesting external data.
Continuing the capabilities released in 7.13 with the runtime fields editor, the authoring and editing capabilities in 7.14 give you the ability to shape your data for whatever data adventure you choose to embark on.
Hunt and gather all the data you need to ingest with Elastic Agent, Fleet, and more integrations
Your data is at the heart of the ad hoc analysis adventure that you’re on, and the terrain has shifted so that it’s all downhill from here with ingesting the data you need. Elastic Agent, the one agent to collect logs, metrics, traces, and more, makes it easier to install, configure, and deploy agents while protecting your hosts and data at the same time. Onboarding new data sources will be faster and time to analyze, visualize, and achieve insights will be even shorter.
If you request a new data source and your team prepares to implement this, instead of going through the additional setup and configuration of files, your team has a Kibana app, Fleet, that provides an intuitive UI to configure and deploy new Elastic agents. Want to try out one of the many out-of-the-box integrations that cover data sources from Azure to Cisco? Take them for a spin and select the pre-built Kibana components like dashboards and visualizations that you can use right away or update to fit your team’s needs.
Kibana has always been the window to your data in the Elastic Stack, and now, it also serves as the one-stop solution for managing the agents and integrations that gather data for your analyses and workflows. Learn more about Elastic Agent and Fleet in the Elastic Observability 7.14 blog and the Elastic Agent and Fleet technical blog.
Try it out
Existing Elastic Cloud customers can access many of these features directly from the Elastic Cloud console. If you’re new to Elastic Cloud, take a look at our Quick Start guides (bite-sized training videos to get you started quickly) or our free fundamentals training courses. You can always get started for free with a free 14-day trial of Elastic Cloud. Or download the self-managed version of the Elastic Stack for free.
Read about these capabilities and more in the Kibana 7.14 release notes, and other Elastic Stack highlights in the Elastic 7.14 announcement post.
The release and timing of any features or functionality described in this post remain at Elastic's sole discretion. Any features or functionality not currently available may not be delivered on time or at all.