Configure flows to monitor network traffic
editConfigure flows to monitor network traffic
editYou can configure Packetbeat to collect and report statistics on network flows. A flow is a group of packets sent over the same time period that share common properties, such as the same source and destination address and protocol. You can use this feature to analyze network traffic over specific protocols on your network.
For each flow, Packetbeat reports the number of packets and the total number of bytes sent from the source to the destination. Each flow event also contains information about the source and destination hosts, such as their IP address. For bi-directional flows, Packetbeat reports statistics for the reverse flow.
Packetbeat collects and reports statistics up to and including the transport layer. See Flow Event fields for more info about the exported data.
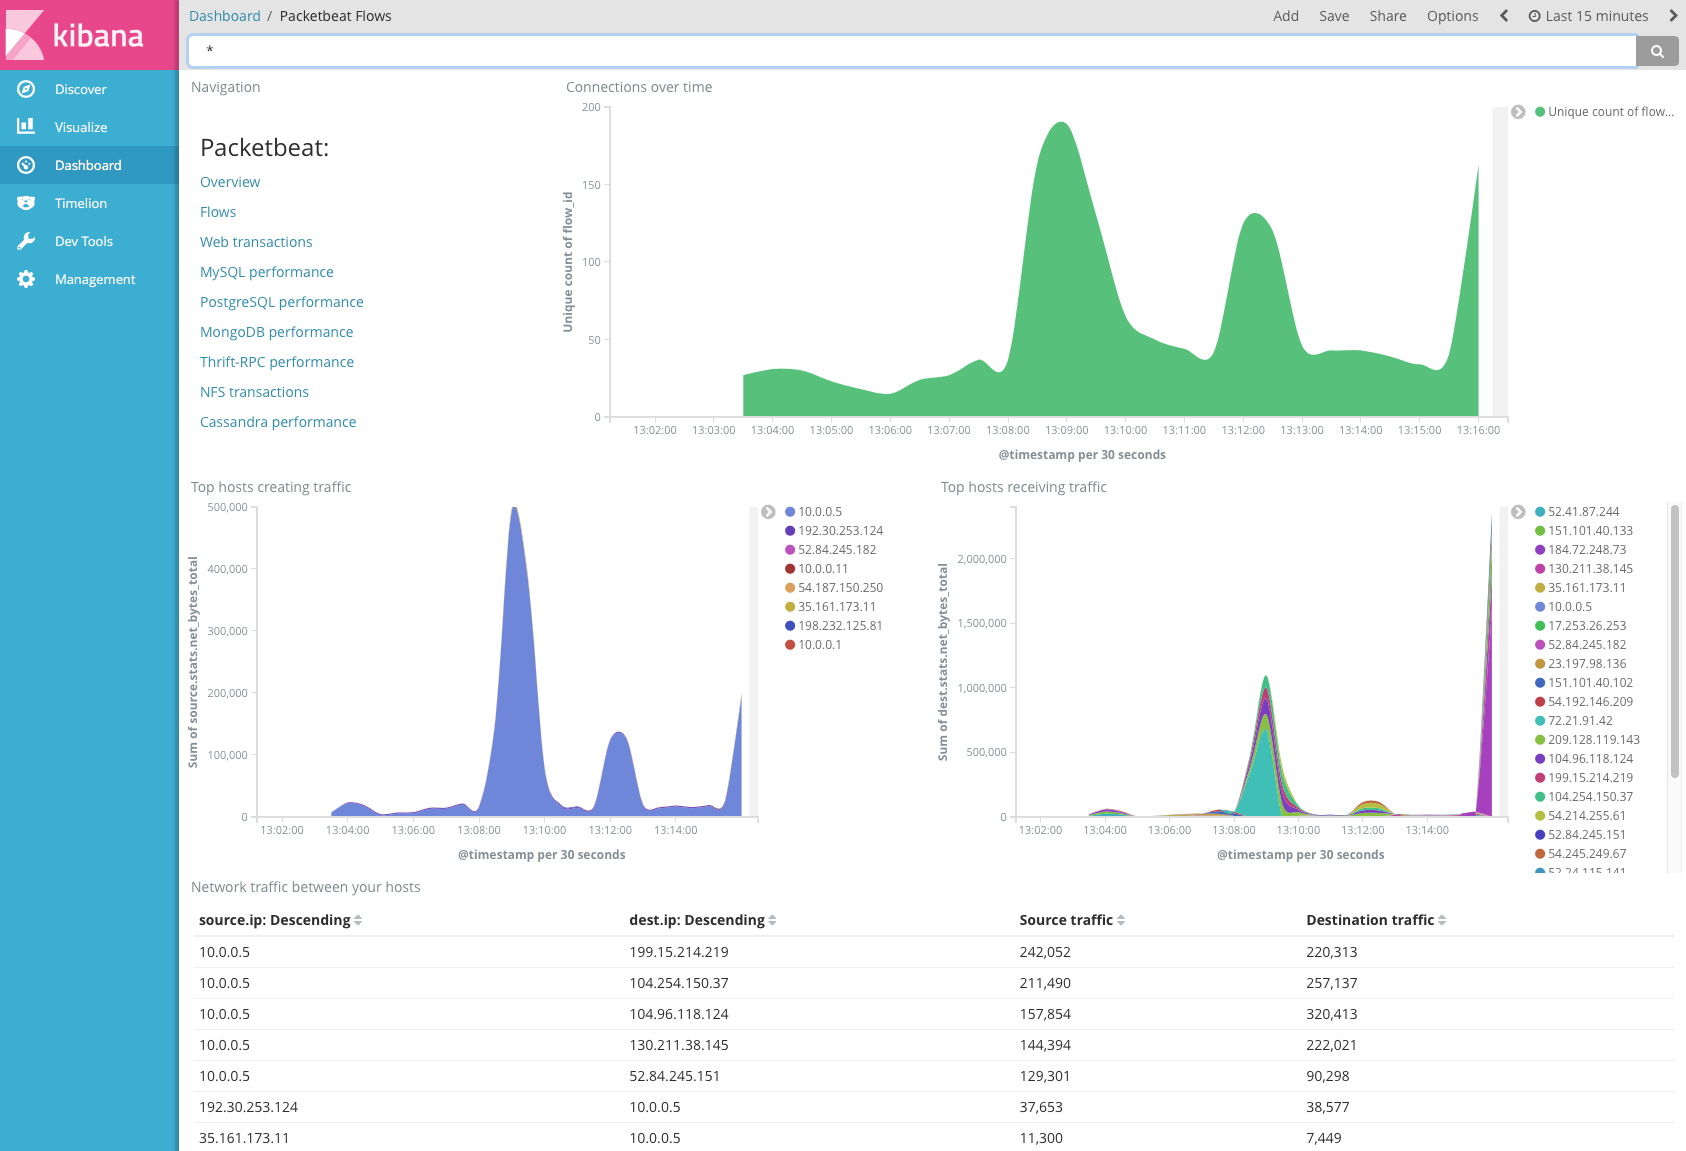
Here’s an example of flow events visualized in the Flows dashboard:

To configure flows, use the packetbeat.flows option in the packetbeat.yml
config file. Flows are enabled by default. If this section is missing
from the configuration file, network flows are disabled.
packetbeat.flows:
  timeout: 30s
  period: 10s
Here’s an example of a flow information sent by Packetbeat. See Flow Event fields for a description of each field.
{
  "@timestamp": "2018-11-15T14:41:24.000Z",
  "agent": {
    "hostname": "host.example.com",
    "name": "host.example.com",
    "version": "7.8.1"
  },
  "destination": {
    "bytes": 460,
    "ip": "198.51.100.2",
    "mac": "06:05:04:03:02:01",
    "packets": 2,
    "port": 80
  },
  "event": {
    "dataset": "flow",
    "duration": 3000000000,
    "end": "2018-11-15T14:41:24.000Z",
    "start": "2018-11-15T14:41:21.000Z"
  },
  "flow": {
    "final": true,
    "id": "FQQA/wz/Dv//////Fv8BAQEBAgMEBQYGBQQDAgGrAMsAcQPGM2QC9ZdQAA",
    "vlan": 171
  },
  "network": {
    "bytes": 470,
    "community_id": "1:t9T66/2c66NQyftAEsr4aMZv4Hc=",
    "packets": 3,
    "transport": "tcp",
    "type": "ipv4"
  },
  "source": {
    "bytes": 10,
    "ip": "203.0.113.3",
    "mac": "01:02:03:04:05:06",
    "packets": 1,
    "port": 38901
  }
}
|
Packetbeat sets the |
Configuration options
editYou can specify the following options in the packetbeat.flows section of
the packetbeat.yml config file:
enabled
editEnables flows support if set to true. Set to false to disable network flows support without having to delete or comment out the flows section. The default value is true.
timeout
editTimeout configures the lifetime of a flow. If no packets have been received for a flow within the timeout time window, the flow is killed and reported. The default value is 30s.
period
editConfigure the reporting interval. All flows are reported at the very same point in time. Periodical reporting can be disabled by setting the value to -1. If disabled, flows are still reported once being timed out. The default value is 10s.
fields
editOptional fields that you can specify to add additional information to the
output. For example, you might add fields that you can use for filtering log
data. Fields can be scalar values, arrays, dictionaries, or any nested
combination of these. By default, the fields that you specify here will be
grouped under a fields sub-dictionary in the output document. To store the
custom fields as top-level fields, set the fields_under_root option to true.
If a duplicate field is declared in the general configuration, then its value
will be overwritten by the value declared here.
fields_under_root
editIf this option is set to true, the custom fields
are stored as top-level fields in the output document instead of being grouped
under a fields sub-dictionary. If the custom field names conflict with other
field names added by Packetbeat, then the custom fields overwrite the other
fields.
tags
editA list of tags that will be sent with the protocol event. This setting is optional.
processors
editA list of processors to apply to the data generated by the protocol.
See Processors for information about specifying processors in your config.
keep_null
editIf this option is set to true, fields with null values will be published in
the output document. By default, keep_null is set to false.