Kibana highlights
editKibana highlights
editThis list summarizes the most important enhancements in Kibana 7.10.
New home and landing page
editWith so many exciting additions to Kibana, it can be challenging to choose a path forward. As a result, we have a renewed focus on the initial user experience, beginning with a new home page. The new version focuses on core solutions and use cases.
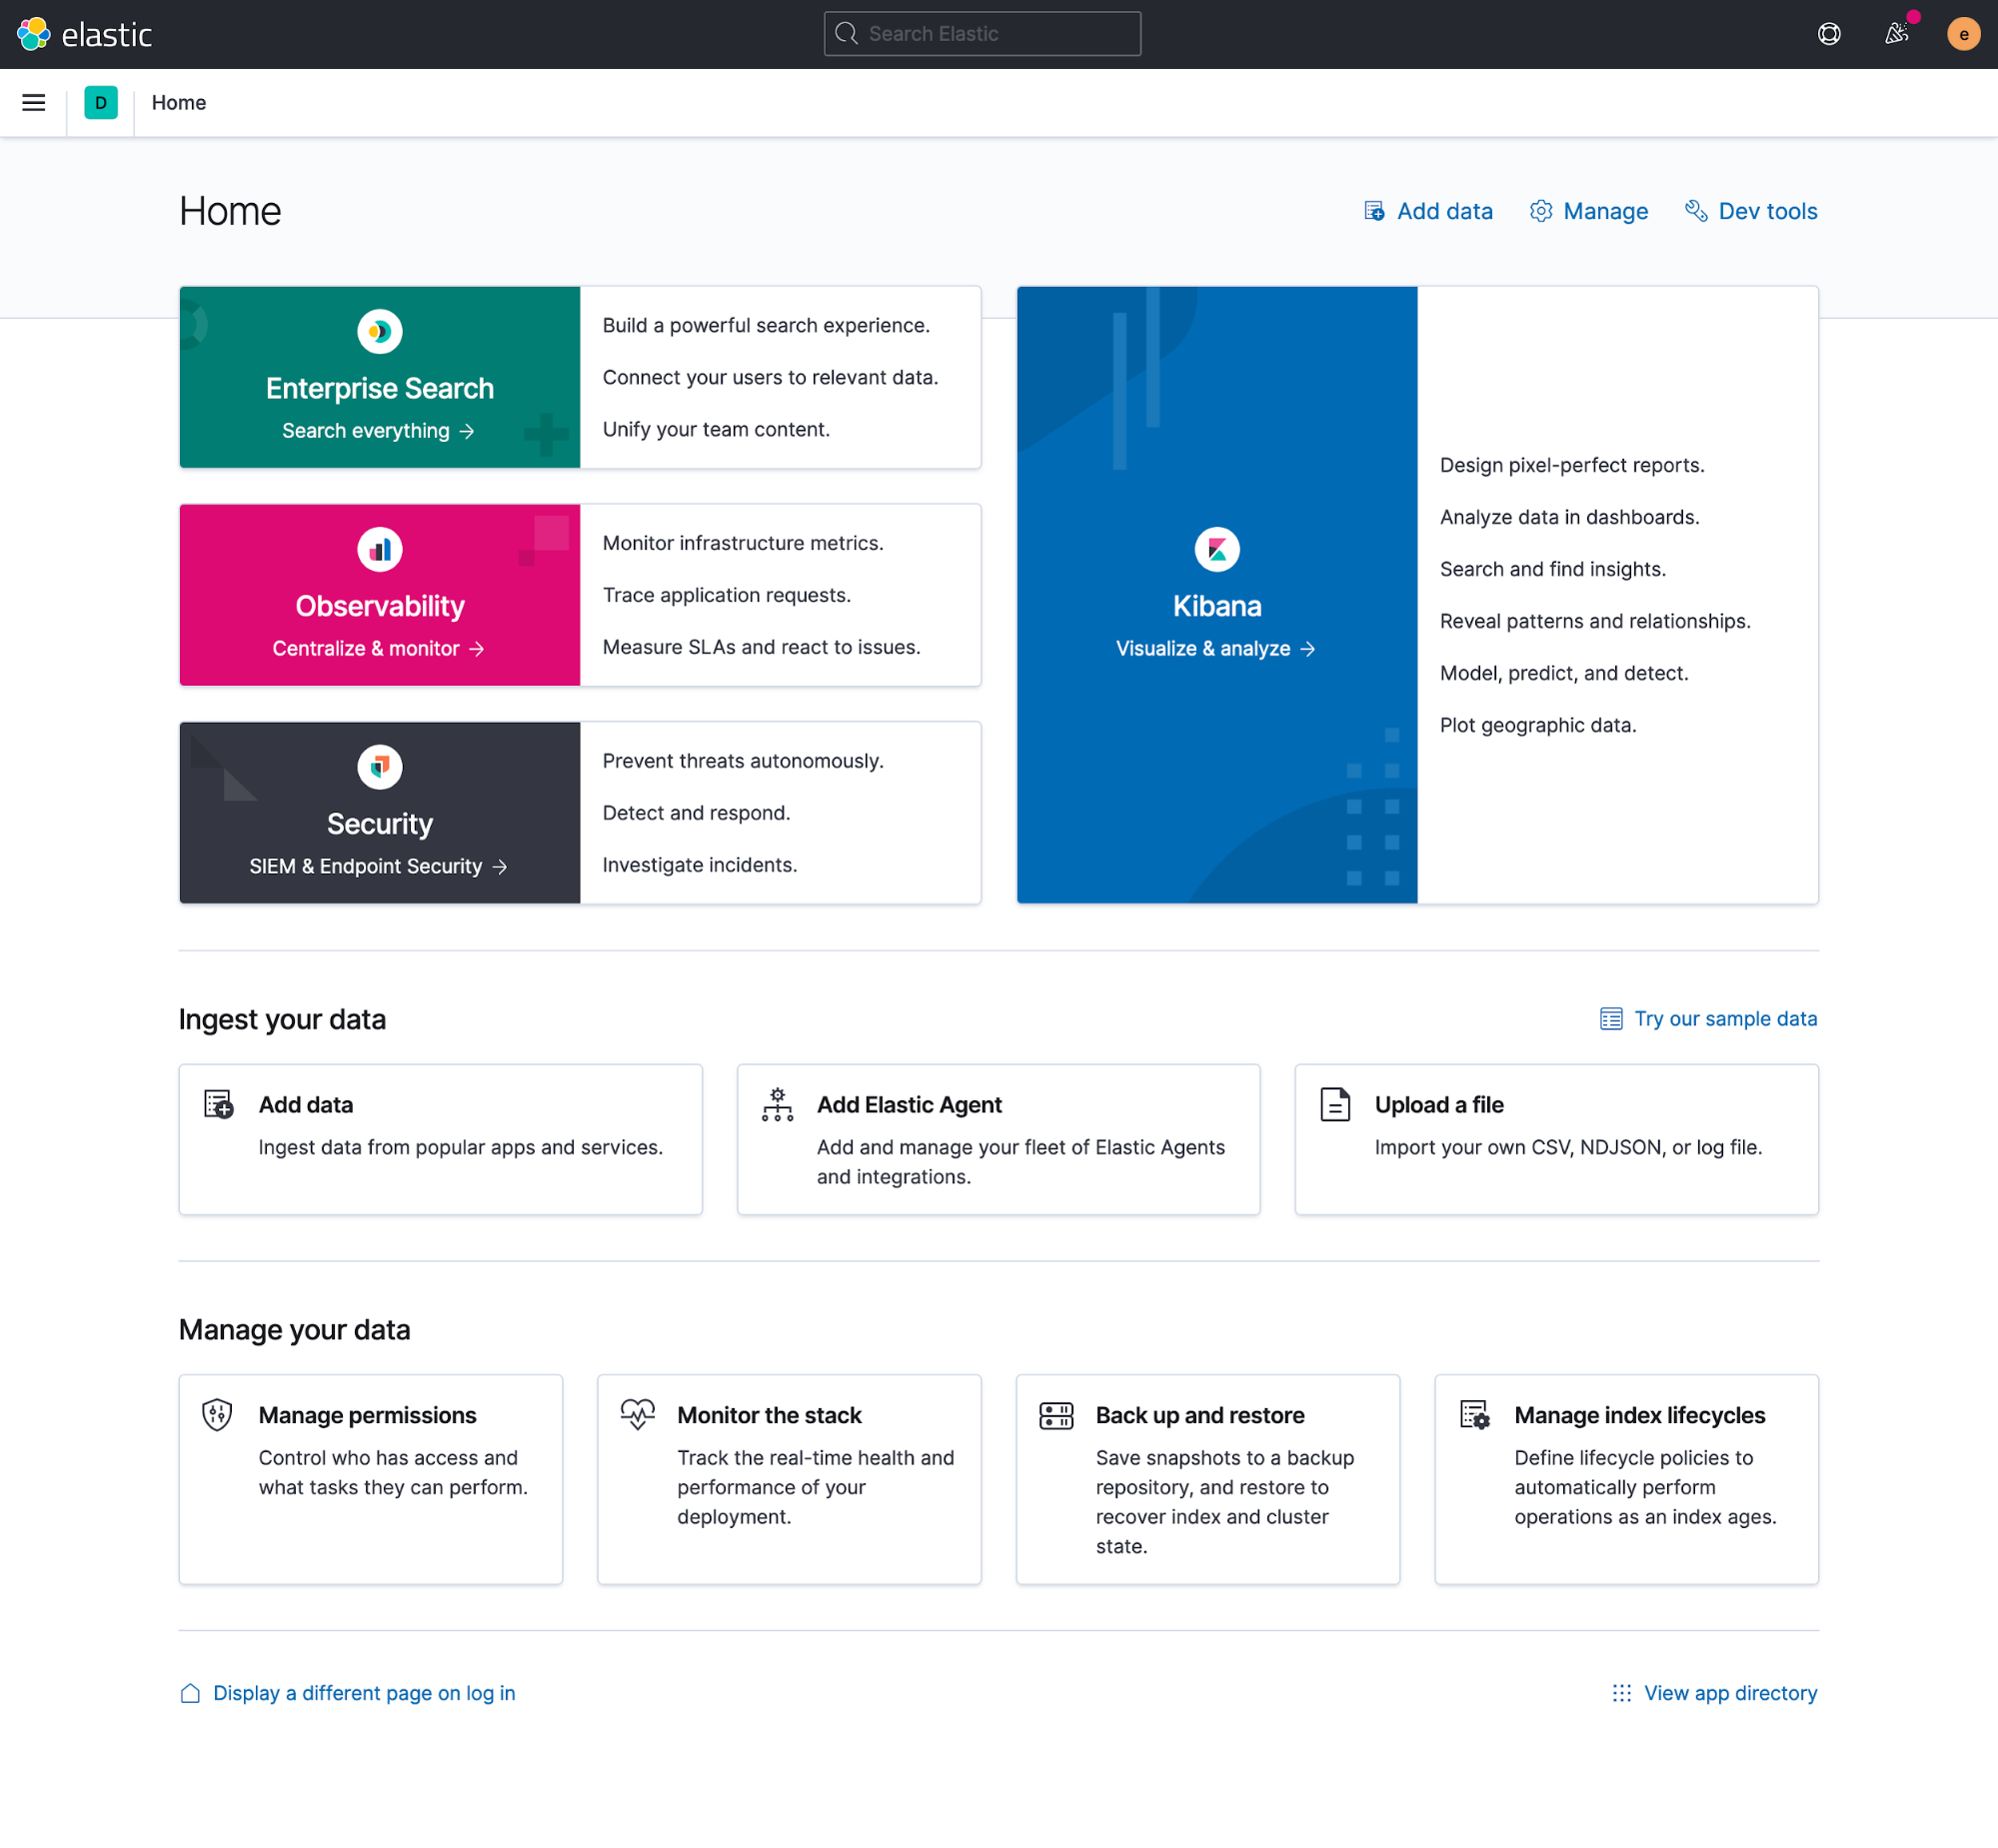
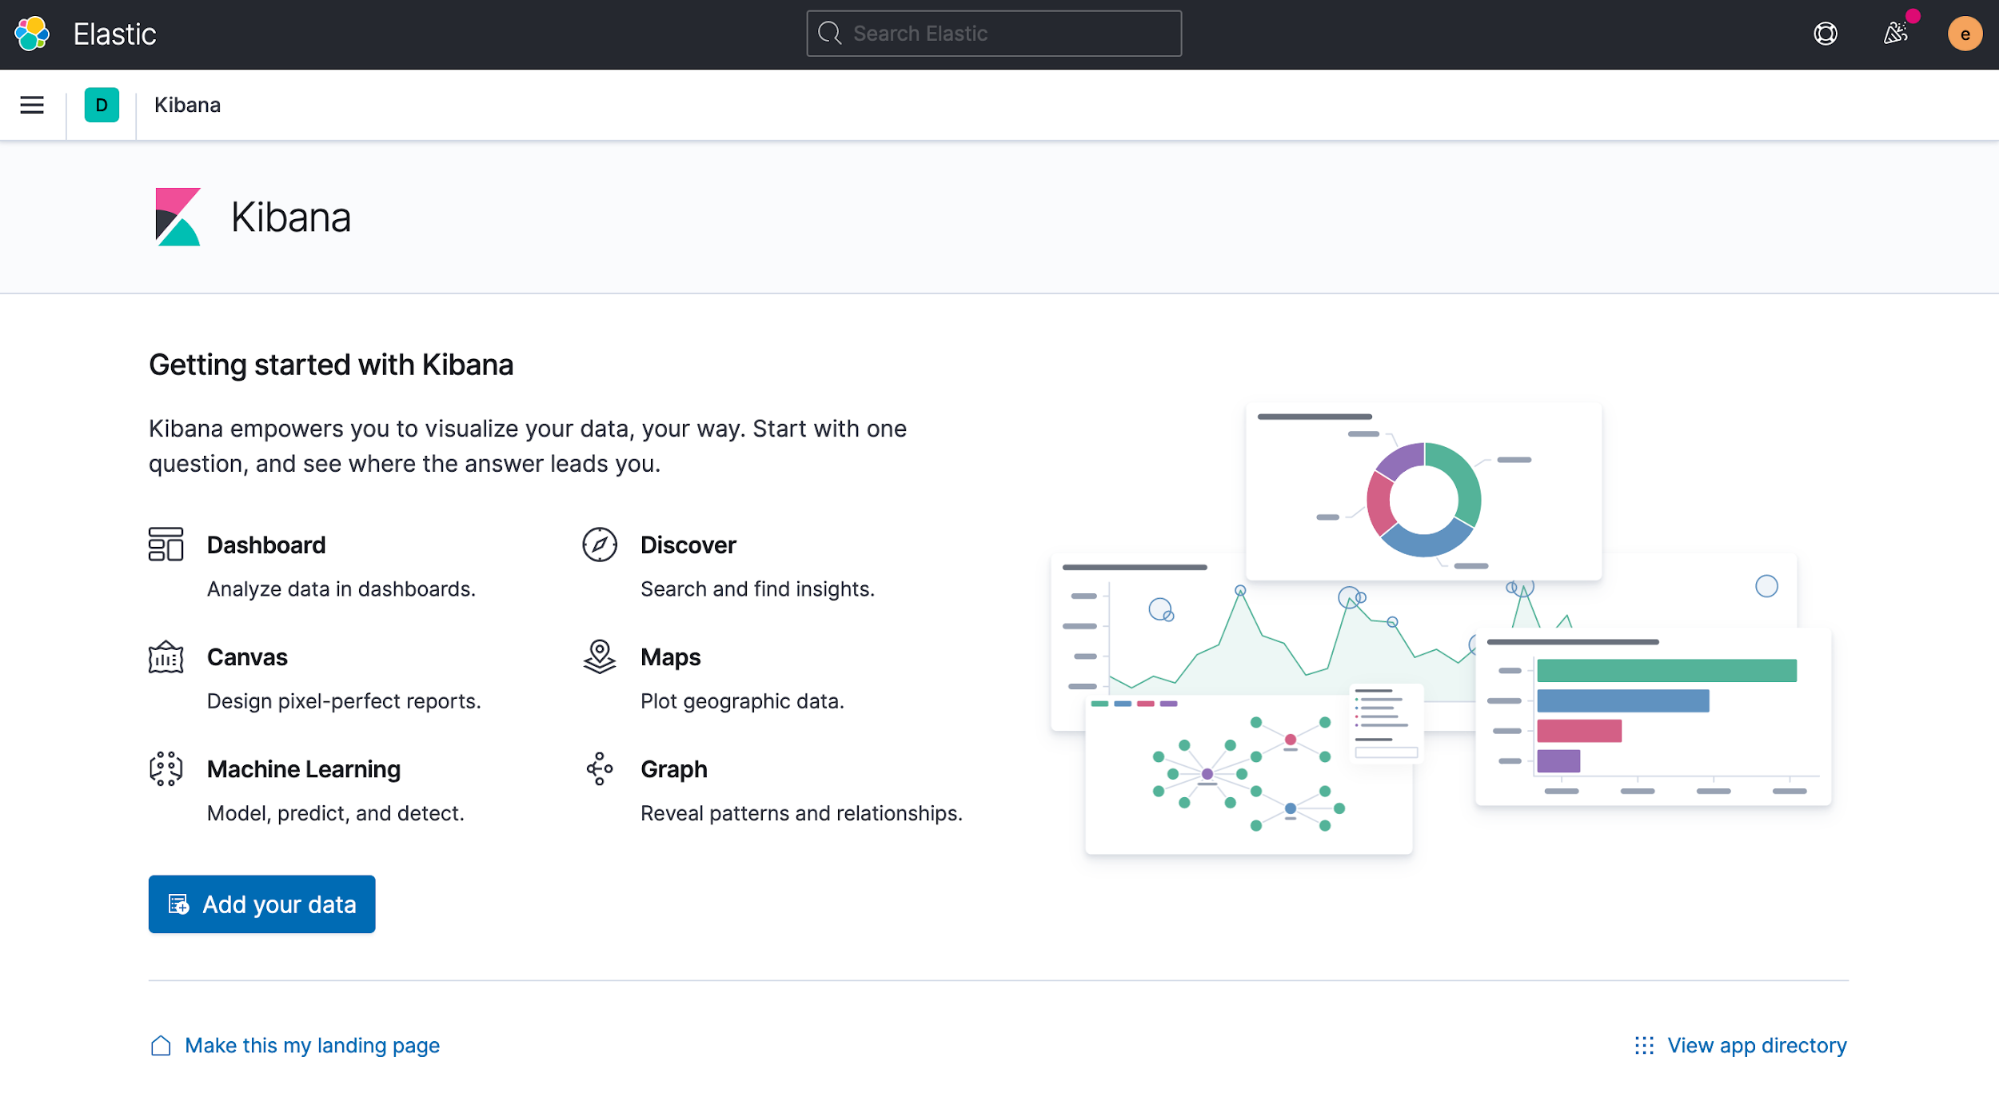
Extending from the home page, you’re now guided toward solution-focused landing pages that assist in adding data and introducing underlying capabilities. These new pages help users, both new and experienced, get started with all that Kibana has to offer.
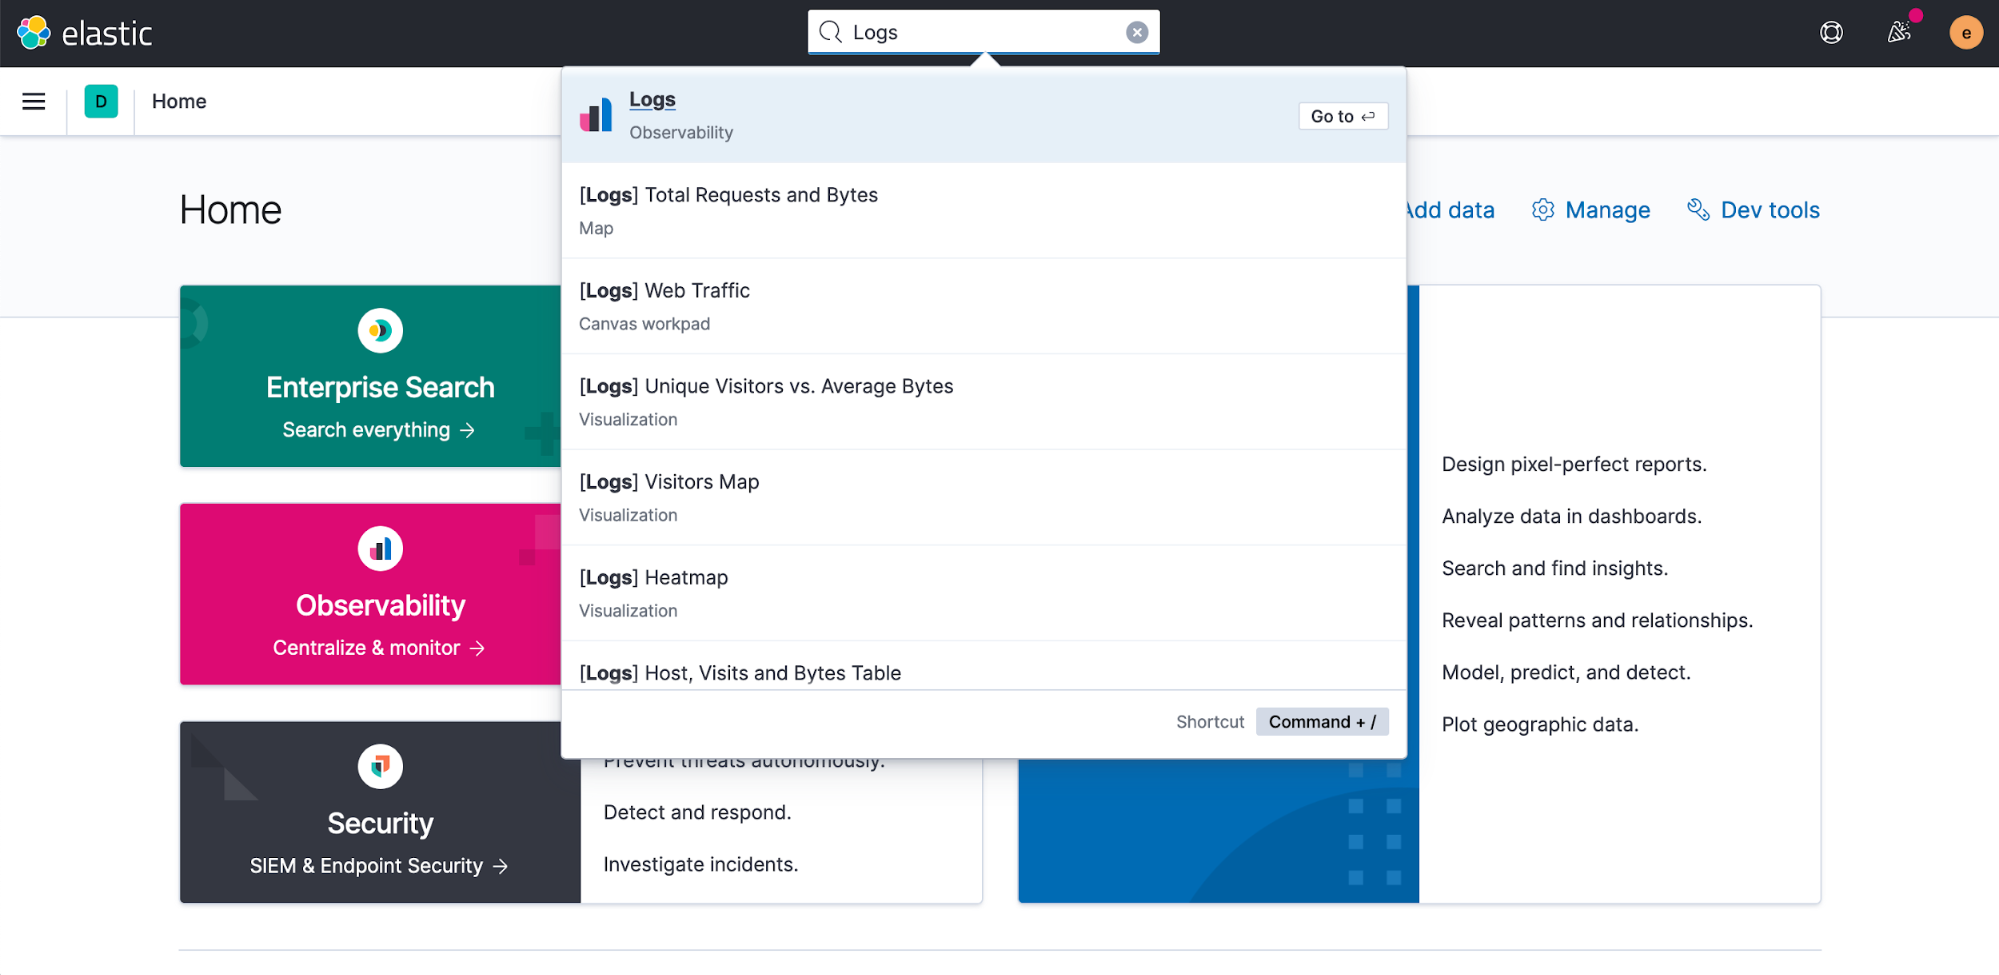
Global header with navigational search
editIn 7.8, we introduced a new and improved main menu as part of our quest for the optimal navigation design. In 7.10, we reveal more of the picture, with the addition of a global header that includes a navigational search. Using a keyboard shortcut (Ctrl+/ on Windows and Linux, Command+/ on MacOS), you can now jump between applications and saved objects, including dashboards, visualizations, workpads, saved searches, and more.
Lens is generally available
editTo further our commitment to the ongoing journey of making Kibana an incredible visual data analytics experience for everyone, regardless of technical background, we’ve made Lens generally available. Now users whose companies limit the use of beta software or services in production can leverage the visualization and analytics capabilities that Lens provides.
Lens also introduces two new chart types. Depending on the type of data you are visualizing, Lens can now build percentage bar charts and percentage area charts.
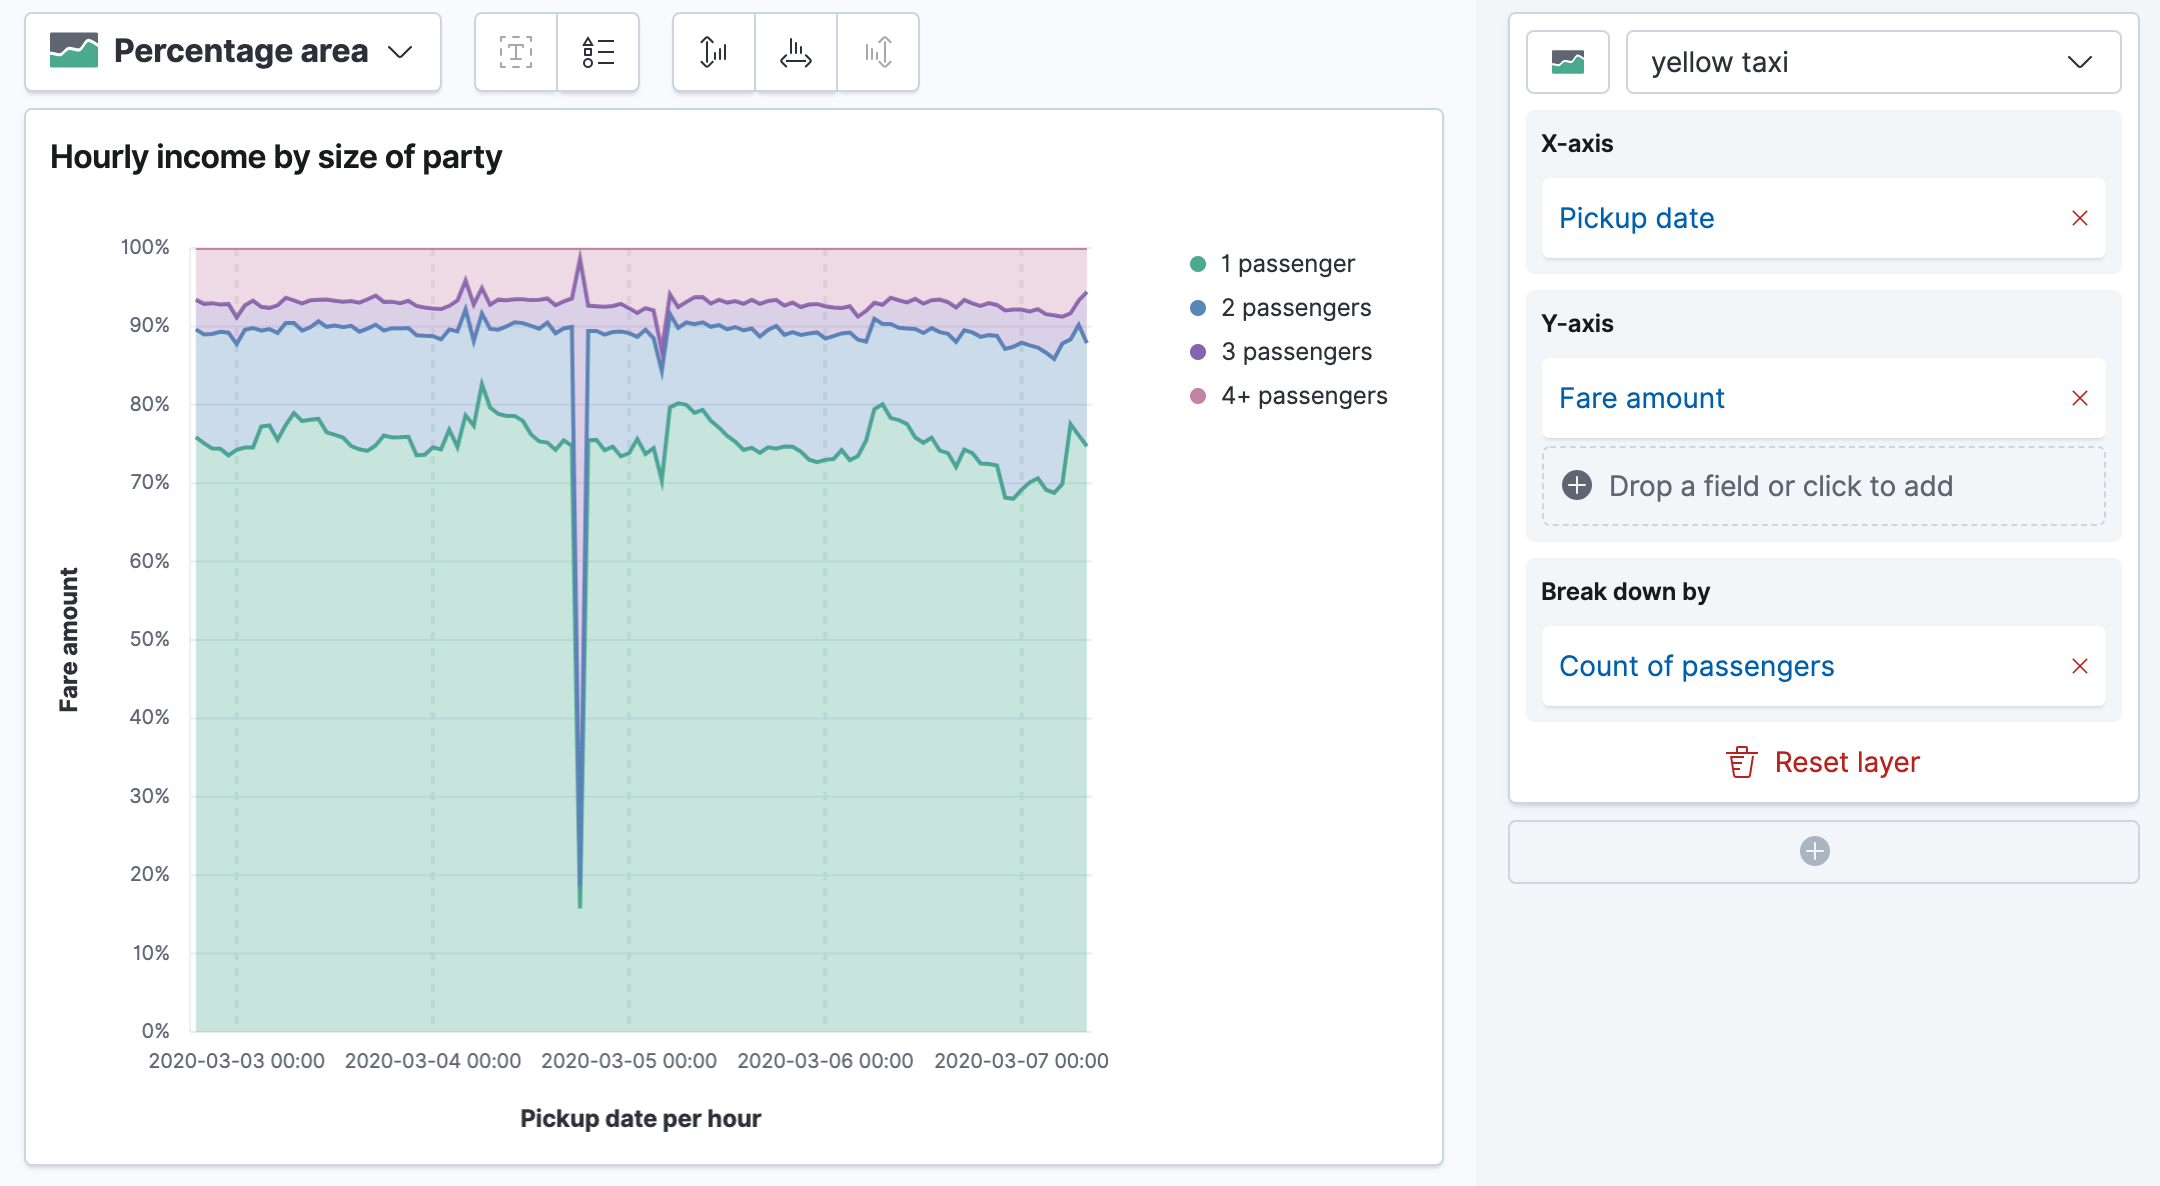
For more information, refer to the documentation.
Drilldown to URL
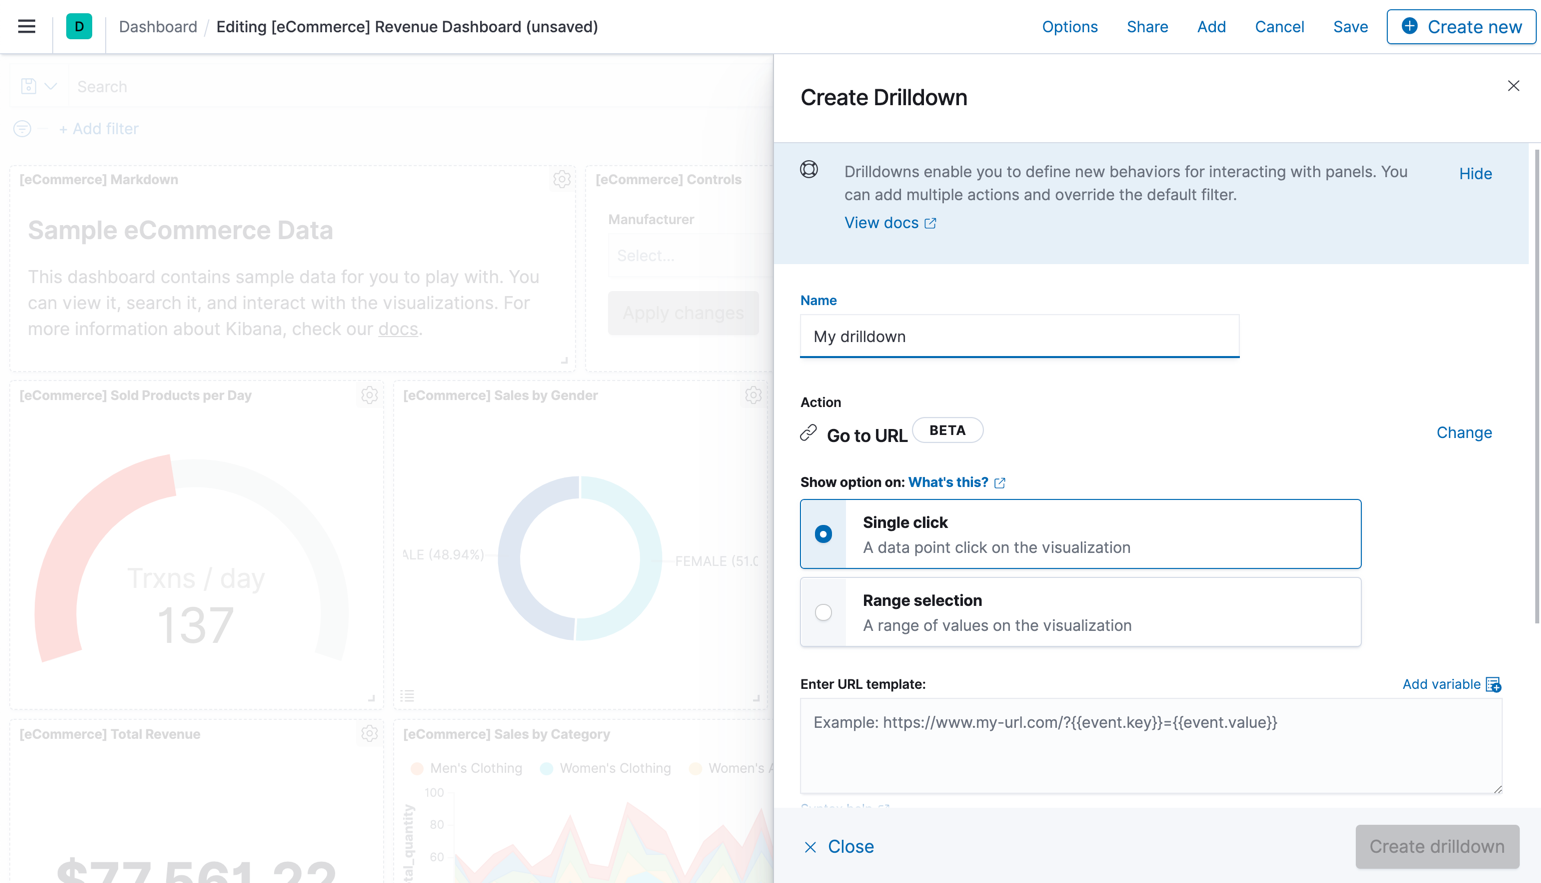
edit[beta] This functionality is in beta and is subject to change. The design and code is less mature than official GA features and is being provided as-is with no warranties. Beta features are not subject to the support SLA of official GA features. In 7.8, we introduced a dashboard-to-dashboard drilldown that lets you quickly create custom navigation paths between dashboards, carrying over the filter and time context. Now you can also create a navigation path from a dashboard to an internal or external URL. This functionality is available with a Gold subscription or higher. For more information, refer to the URL drilldown documentation.
New ways to act on geospatial data
editMaps and dashboards now work better together. First, you can use maps with dashboard drilldowns. Second, when authoring a dashboard, you can create a map, save the map, and then return to the dashboard in your workflow.
Maps also has new ways to work with your data. You can now automatically
fit “data to bounds,” keeping your data at the center of attention.
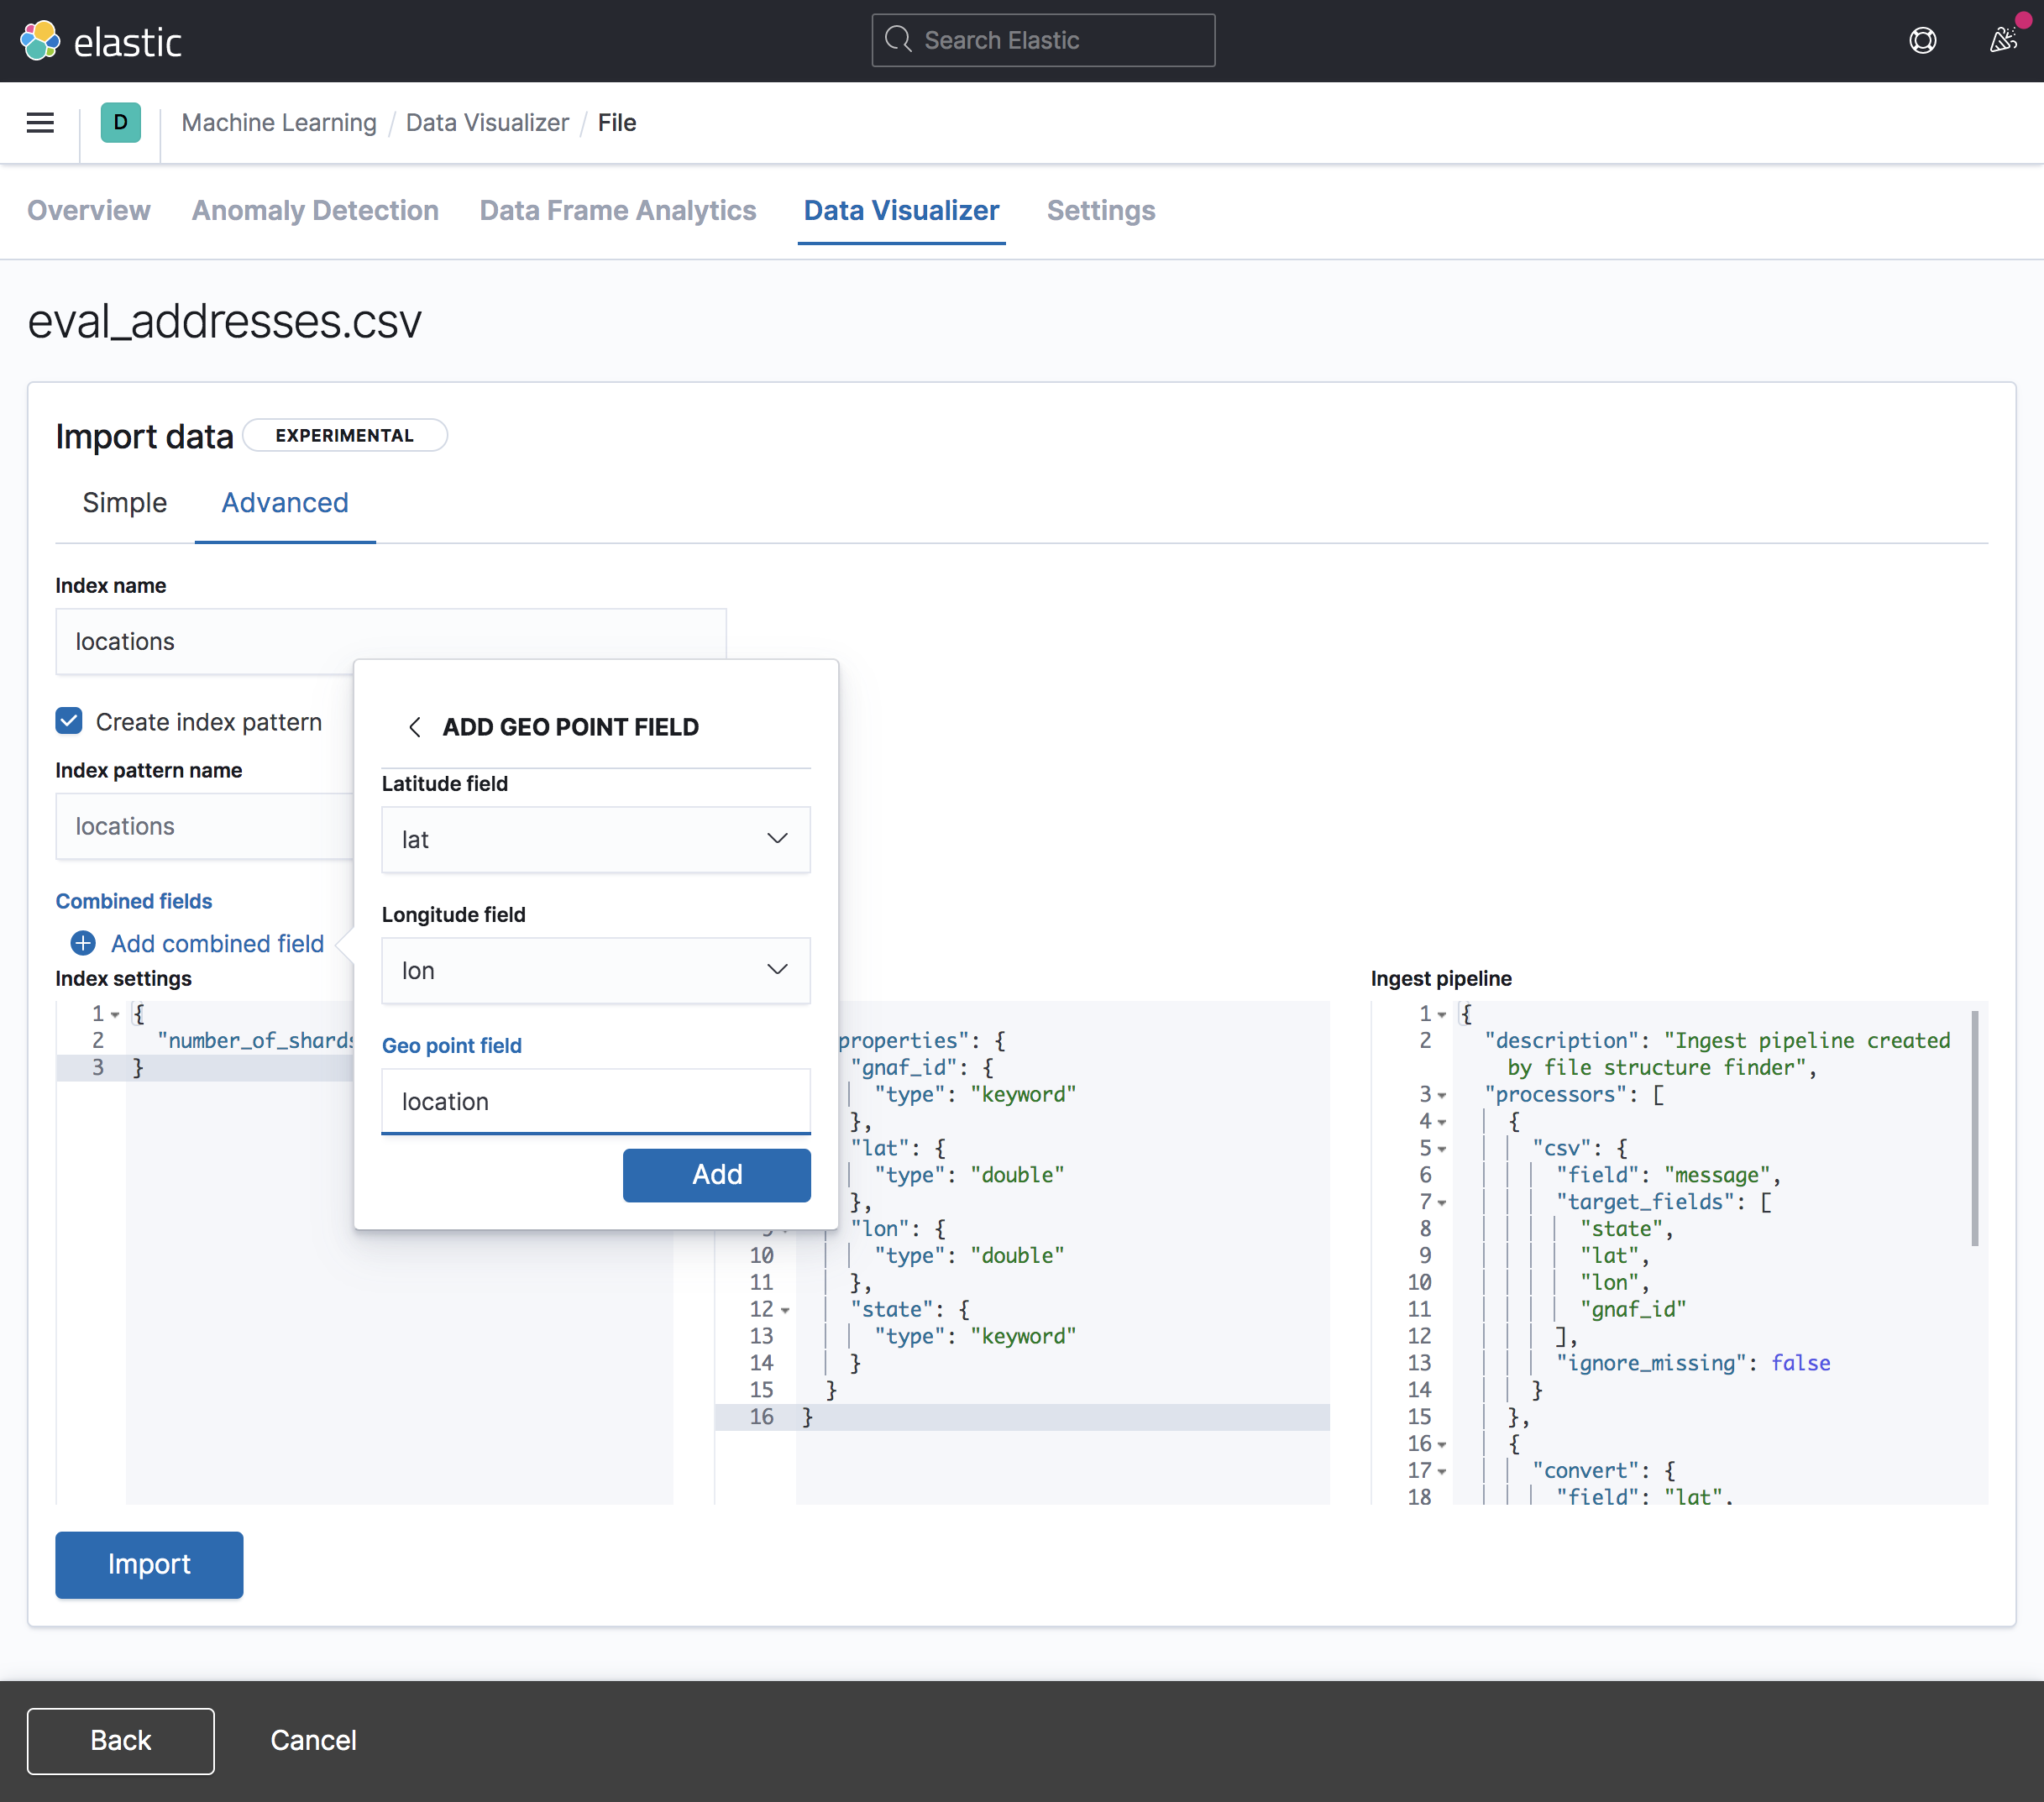
It’s also easier to work with your data if it’s coming from a CSV file. Using the
File Data Visualizer in Machine Learning, if you import a CSV file with latitude and longitude fields,
the fields are automatically converted to a geo_point field.
Maps has a new tracking alert [preview] This functionality is in technical preview and may be changed or removed in a future release. Elastic will work to fix any issues, but features in technical preview are not subject to the support SLA of official GA features. for monitoring the location of entities in relation to area of interest boundaries. Also, the new vector tile rendering enables you to work with more data at faster speeds.
Vega is generally available
editVega, an advanced editor you use to create custom panels in dashboards, is production ready. Now users whose companies limit the use of beta software or services in production can leverage the full visualization customization capabilities that Vega provides.
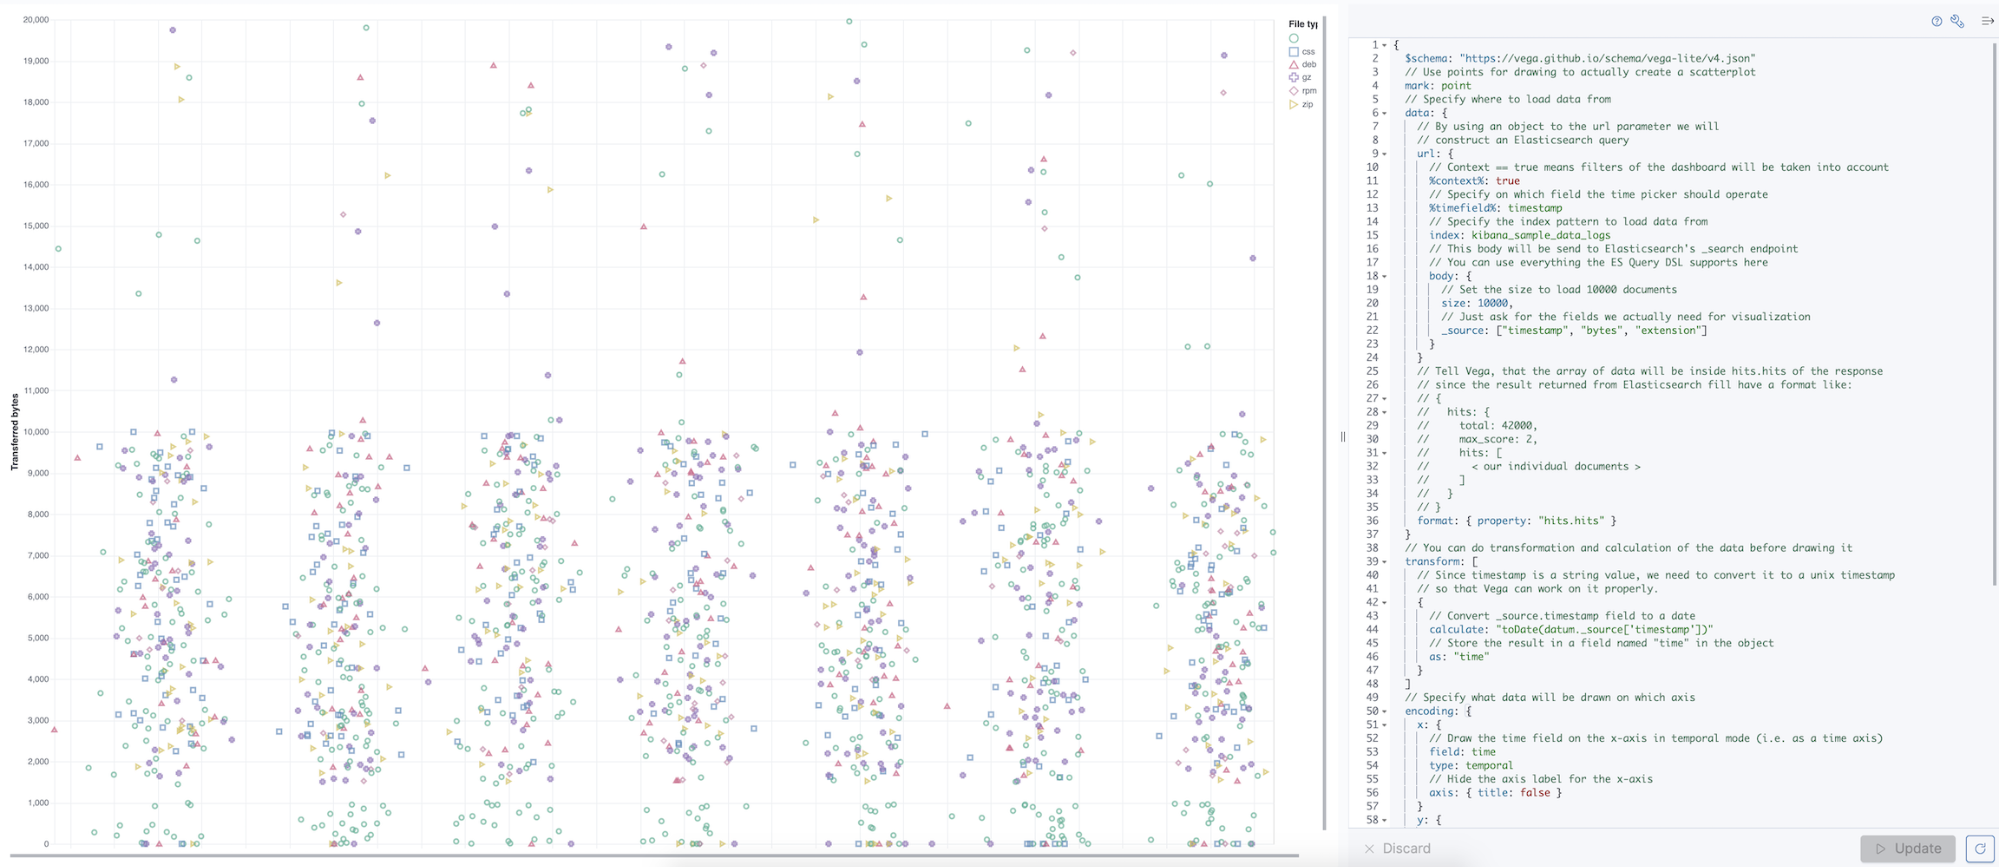
For information about Vega, refer to the documentation.
New connectors for alerts
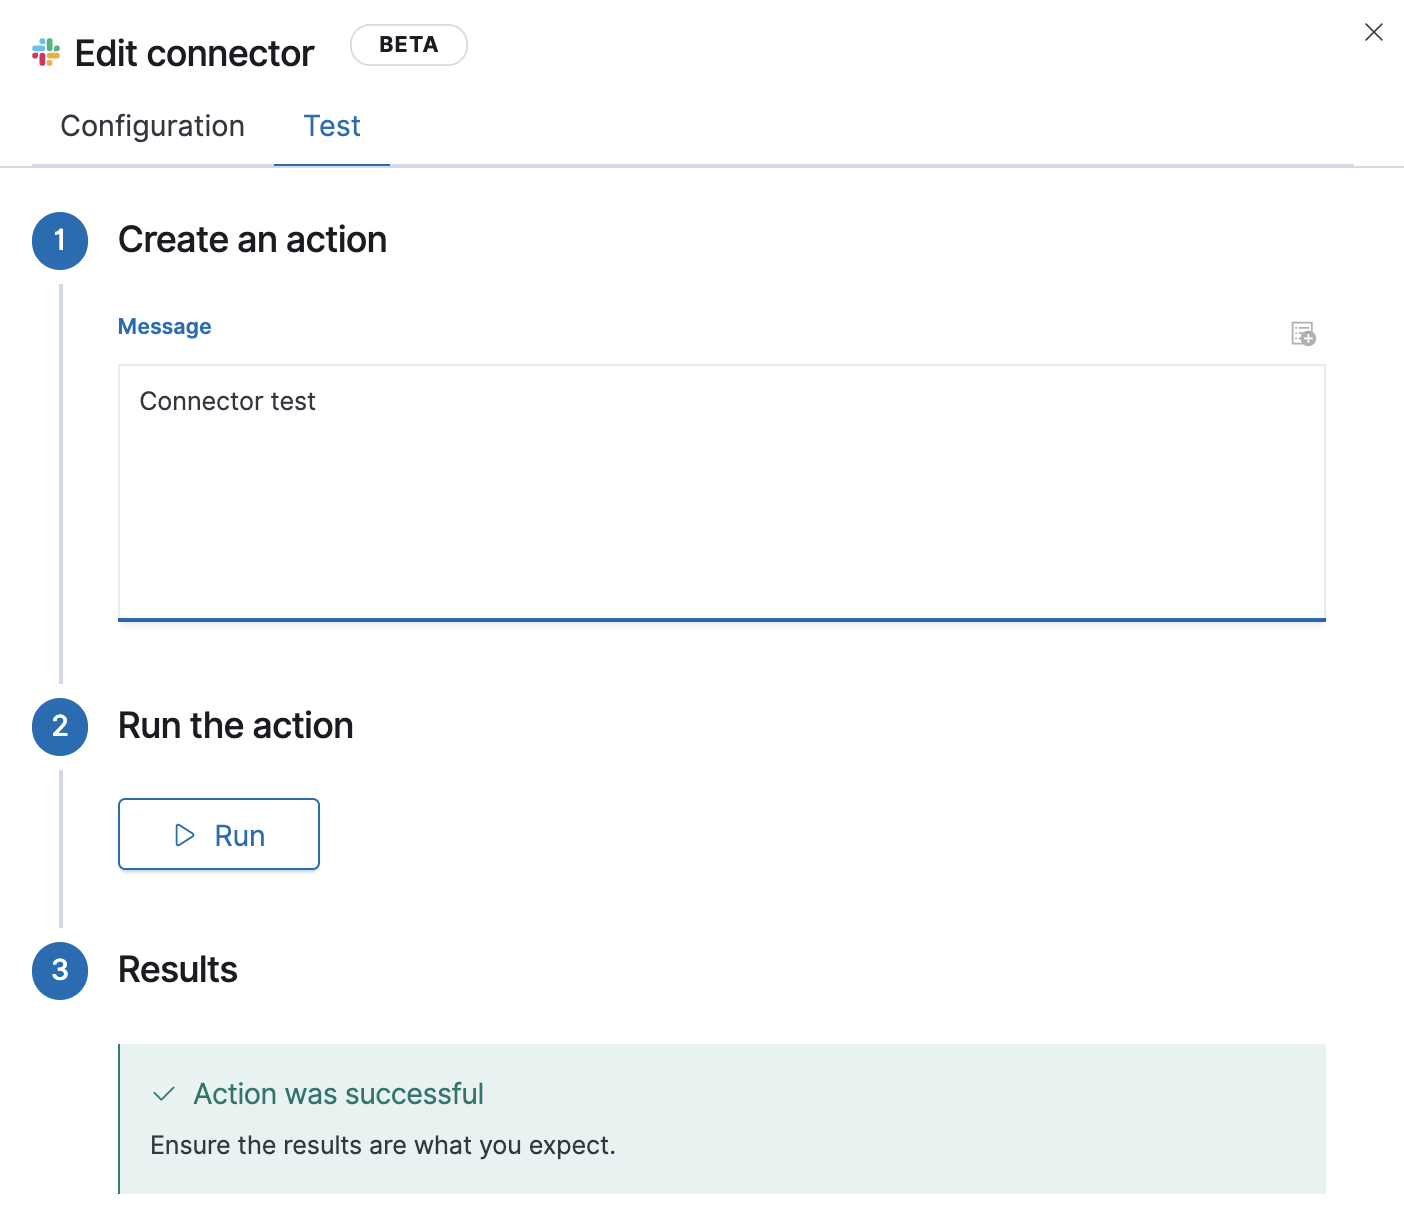
editIn 7.10, we extended our offering of connectors by adding the Jira and IBM Resilient connectors for use with all alert types. Also, you can now test if a connector works before using it with your alerts, so you won’t lose notifications due to setup errors.
Role-based access control in Alerts and Actions
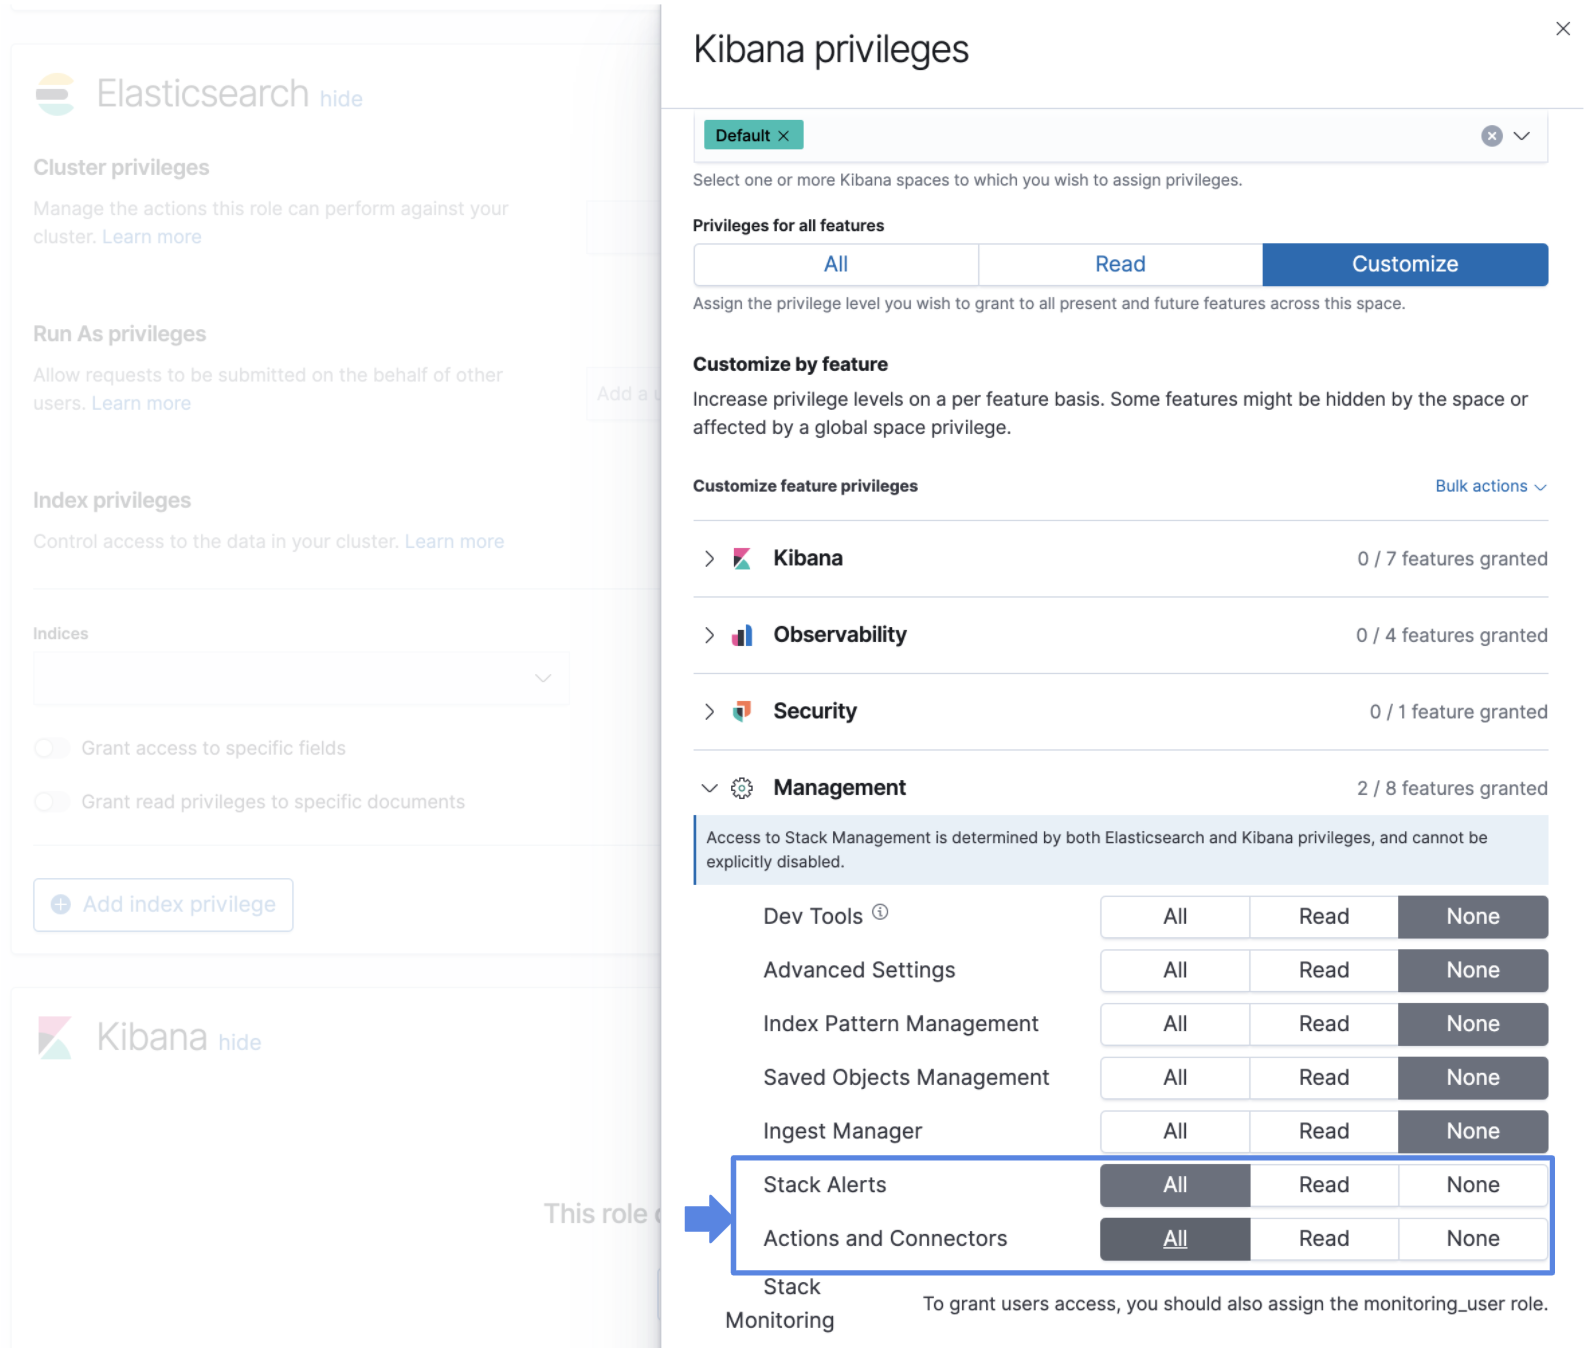
editAlerts and Actions now has role-based access control, so you can secure alerts based on your organization’s access model. Each Elastic solution determines access to its own alert types, and users without access to a solution, will not be able to access its alerts.
A feature control for stack alerts is now included in the
Role definition page. This currently
includes the index threshold alert type, with more stack alerts to follow in future releases.
The all privilege to stack alerts gives users the
ability to create and edit alerts, and the
read privilege allows users to view the alerts.
There’s also a new feature control for actions and connectors.
The all privilege enables users to
create and edit connectors, and the
the read privileges allows users to view connectors and attach actions to alerts.
If you upgrade from a previous version, any alerts created by a user who does not have access to the alert types applied in the 7.10 RBAC model, will stop working. For example, if a user created a metrics-specific alert without having access to the Observability Metrics application, the alert will stop. To resume the alert, a user with the correct access must access and save them.
The Alerts and Actions management views now includes alert statuses that provide immediate feedback on whether an alert is active (the alerting condition is met), inactive, or if there is an error and how you can troubleshoot it.

Hide management based on privileges
editStack Management is home to an ever-growing suite of administrative tools to help manage your stack. These tools have historically been visible to all users, even if they weren’t authorized to take advantage of them. Now, Stack Management only shows the features that users are authorized to use, based on their assigned cluster and index privileges. If a user isn’t authorized to see any of the Stack Management features, then the entire Stack Management is hidden.
This highly-requested feature allows administrators to use feature privileges instead of the deprecated Dashboard-only mode, which will be removed in 8.0. We also updated our documentation to make sure the set of required cluster and index privileges are clearly defined for each Stack Management feature.
Copy and import of saved objects
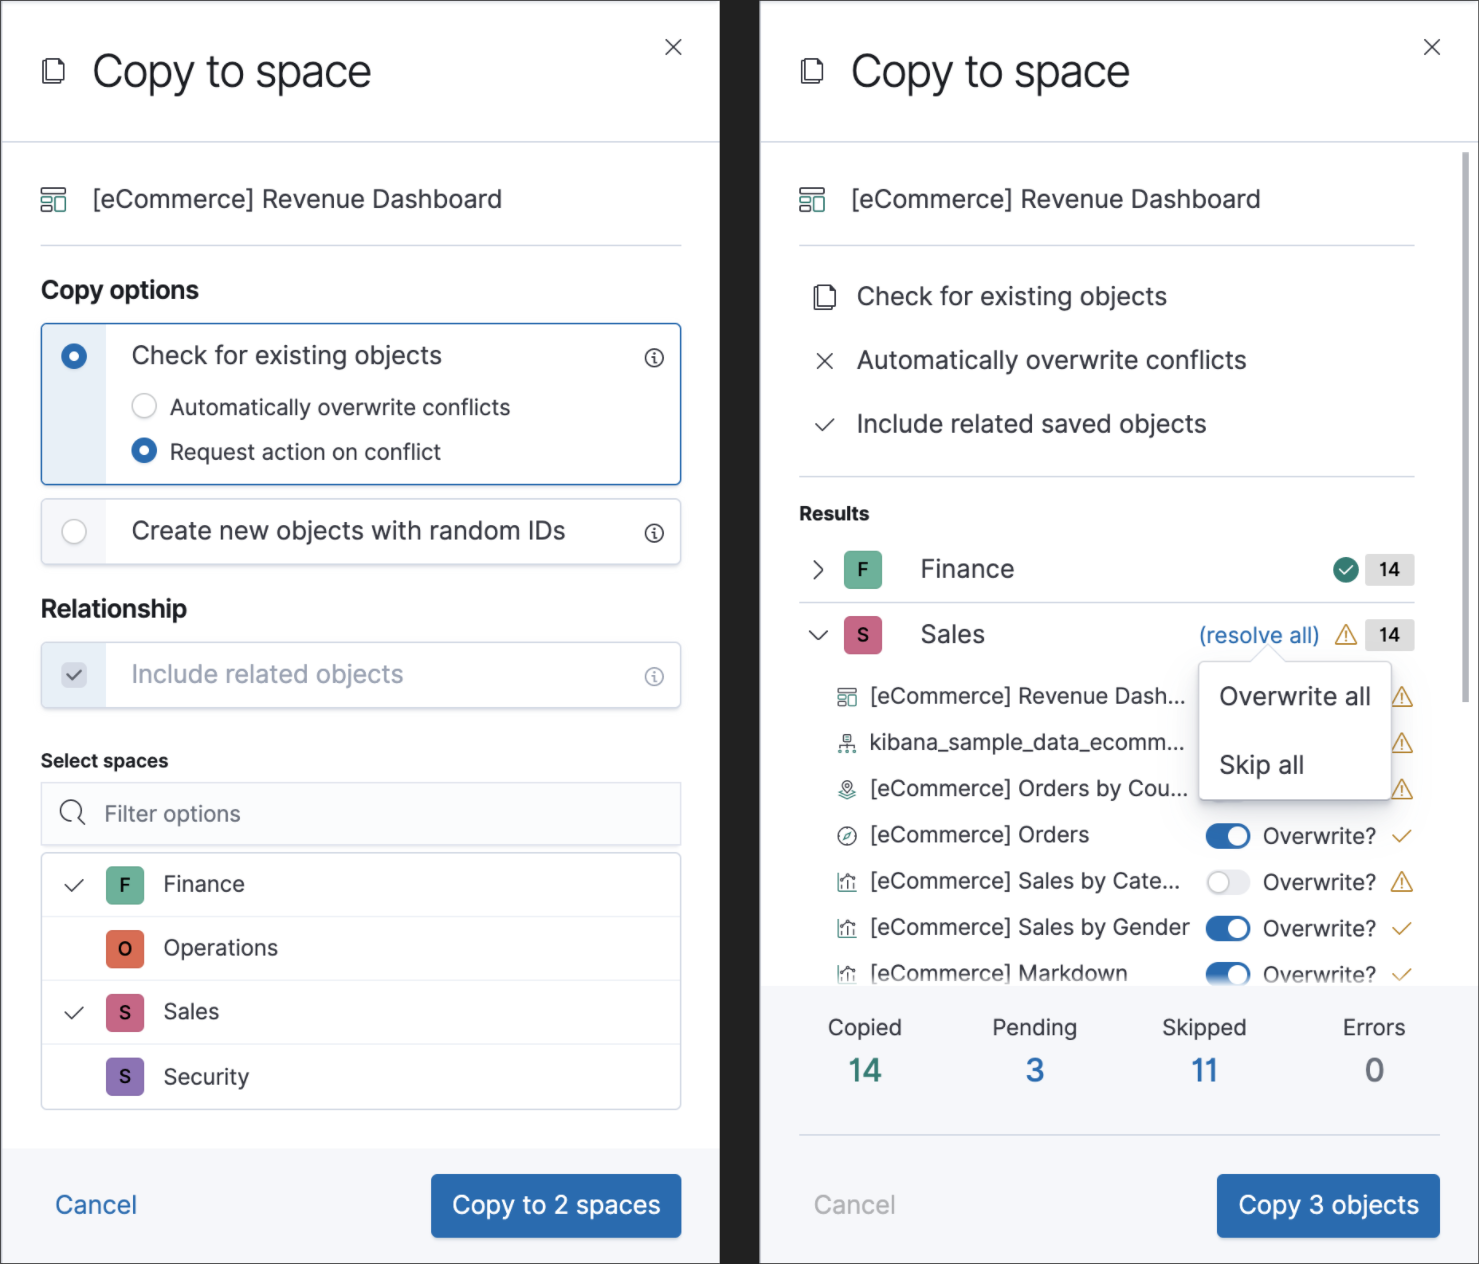
editWhile laying the groundwork for sharing saved objects in multiple spaces, we overhauled the UI for copying and importing saved objects. When copying saved objects, you can now create objects, easily resolve conflicts, and get information on subtotals, object icons, and object titles. After importing saved objects, you’ll see a summary of the objects created.
Data frame analytics model management
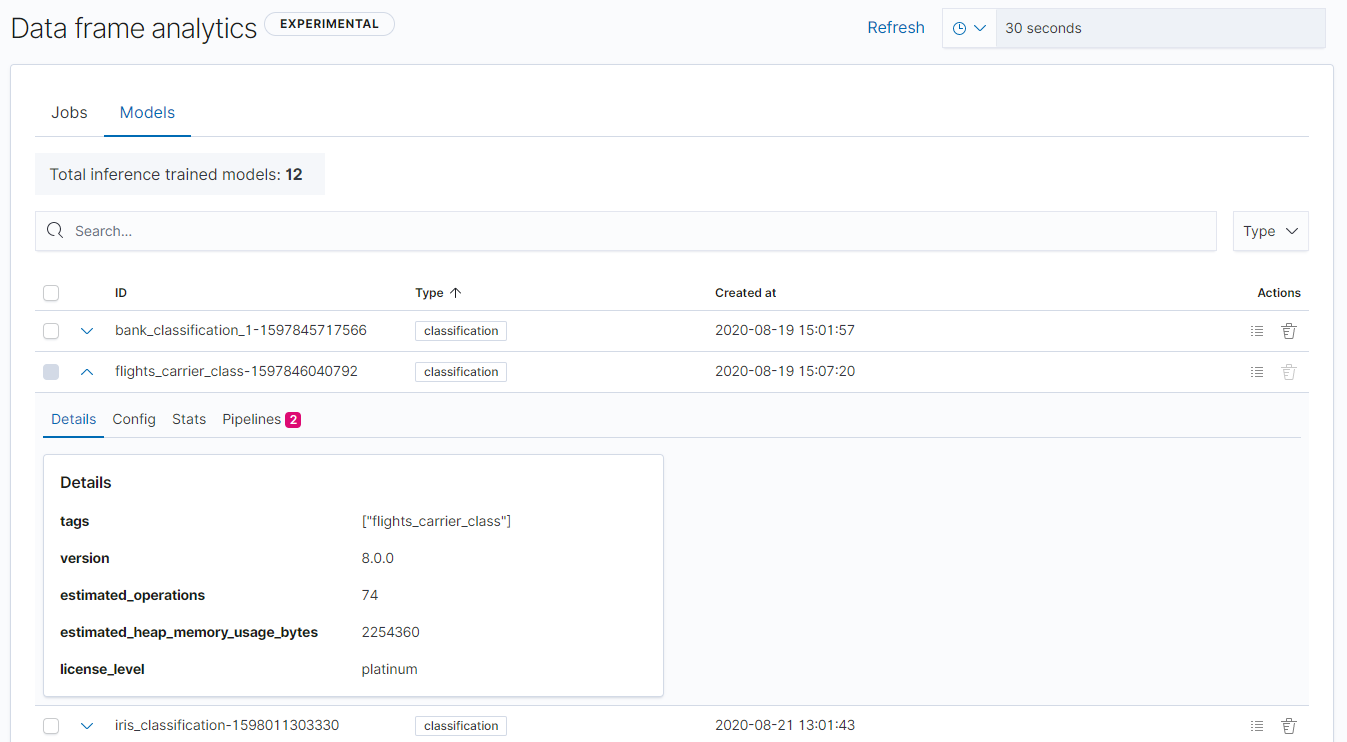
editEnhancing the functionality for data frame analytics supervised learning, you can manage the trained models under Machine Learning. The new tab lists basic information on each model, with more detailed information displayed on row expansion, including the inference and job configuration and stats. It also contains a list of which ingest pipelines make use of each model. Additional controls allow you to search and delete models, and to view the training data used to create each model.
Per-partition categorization in anomaly detection
editCategorization tokenizes a text field, clusters similar data together, classifies it into categories, and then detects anomalous categories in the data. Starting in 7.9, per-partition categorization enabled you to do categorization separately for every value of a partition field. With 7.10, it’s now possible to configure per-partition categorization.
Improved feature importance details for data frame analytics
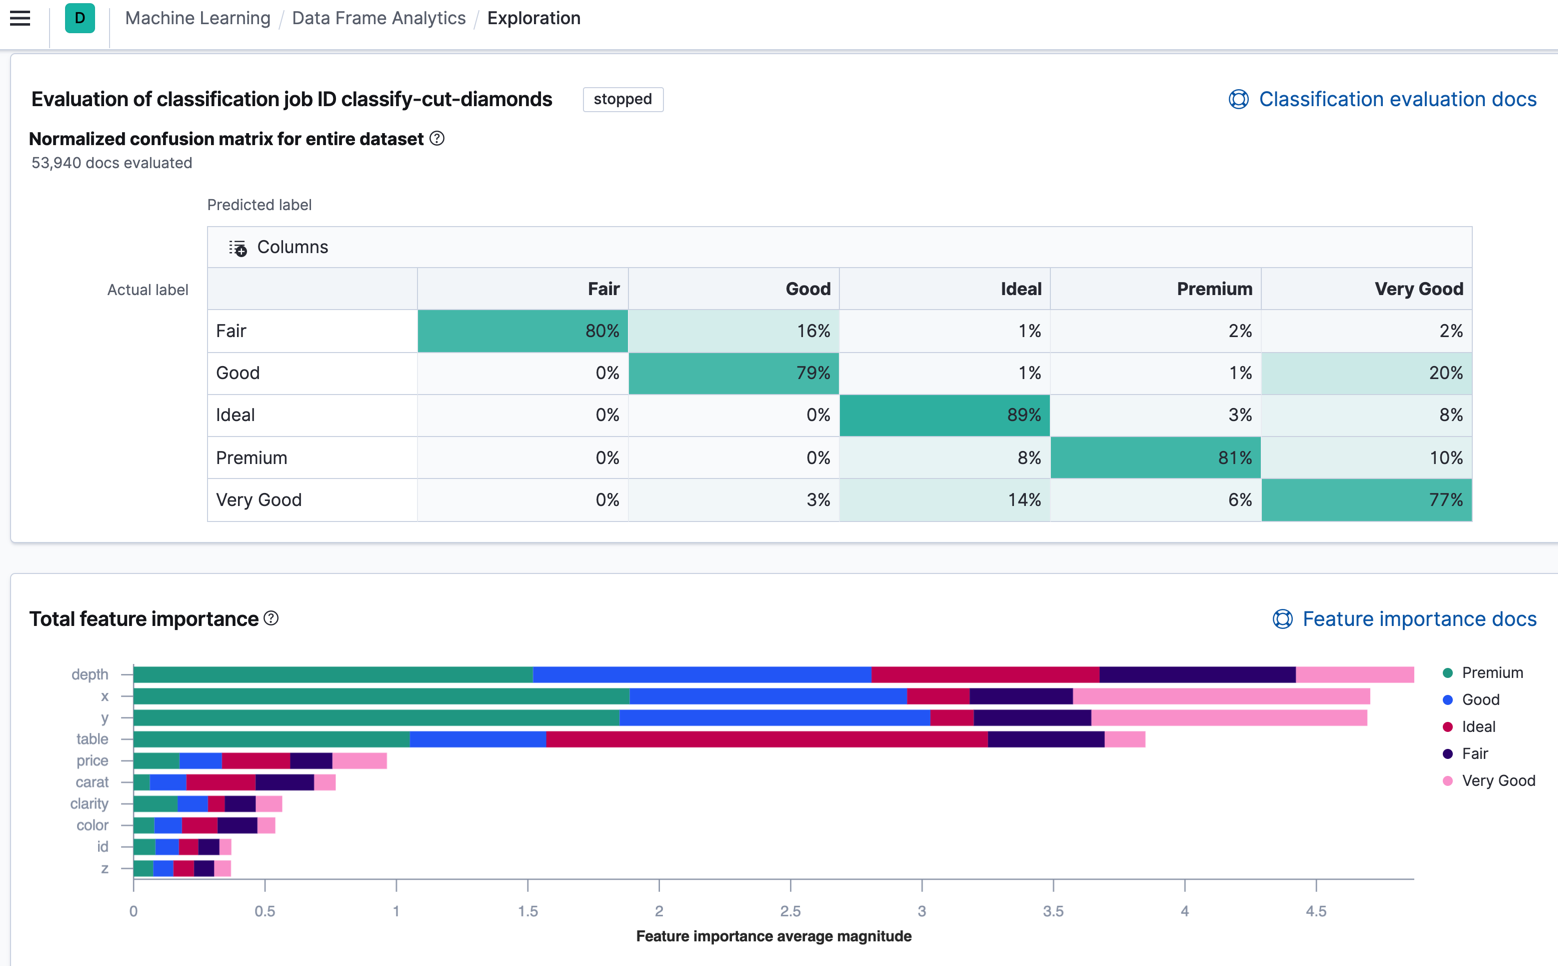
editWhen you examine the results from your classification or regression machine learning jobs, you can use feature importance to understand which fields had the biggest impact on each prediction. In 7.10, you can see the average magnitude of the feature importance values for each field across all the training data. You can also examine the feature importance values for each individual prediction in the format of JSON objects or decision plots.
