Elastic Security highlights
editElastic Security highlights
editThis list summarizes the most important enhancements in Elastic Security 8.1.
Terminology changes
editThe Exceptions page is now named Exception lists.
New features
editRules page enhancements
The following applies to the Rules and Rules monitoring tabs.
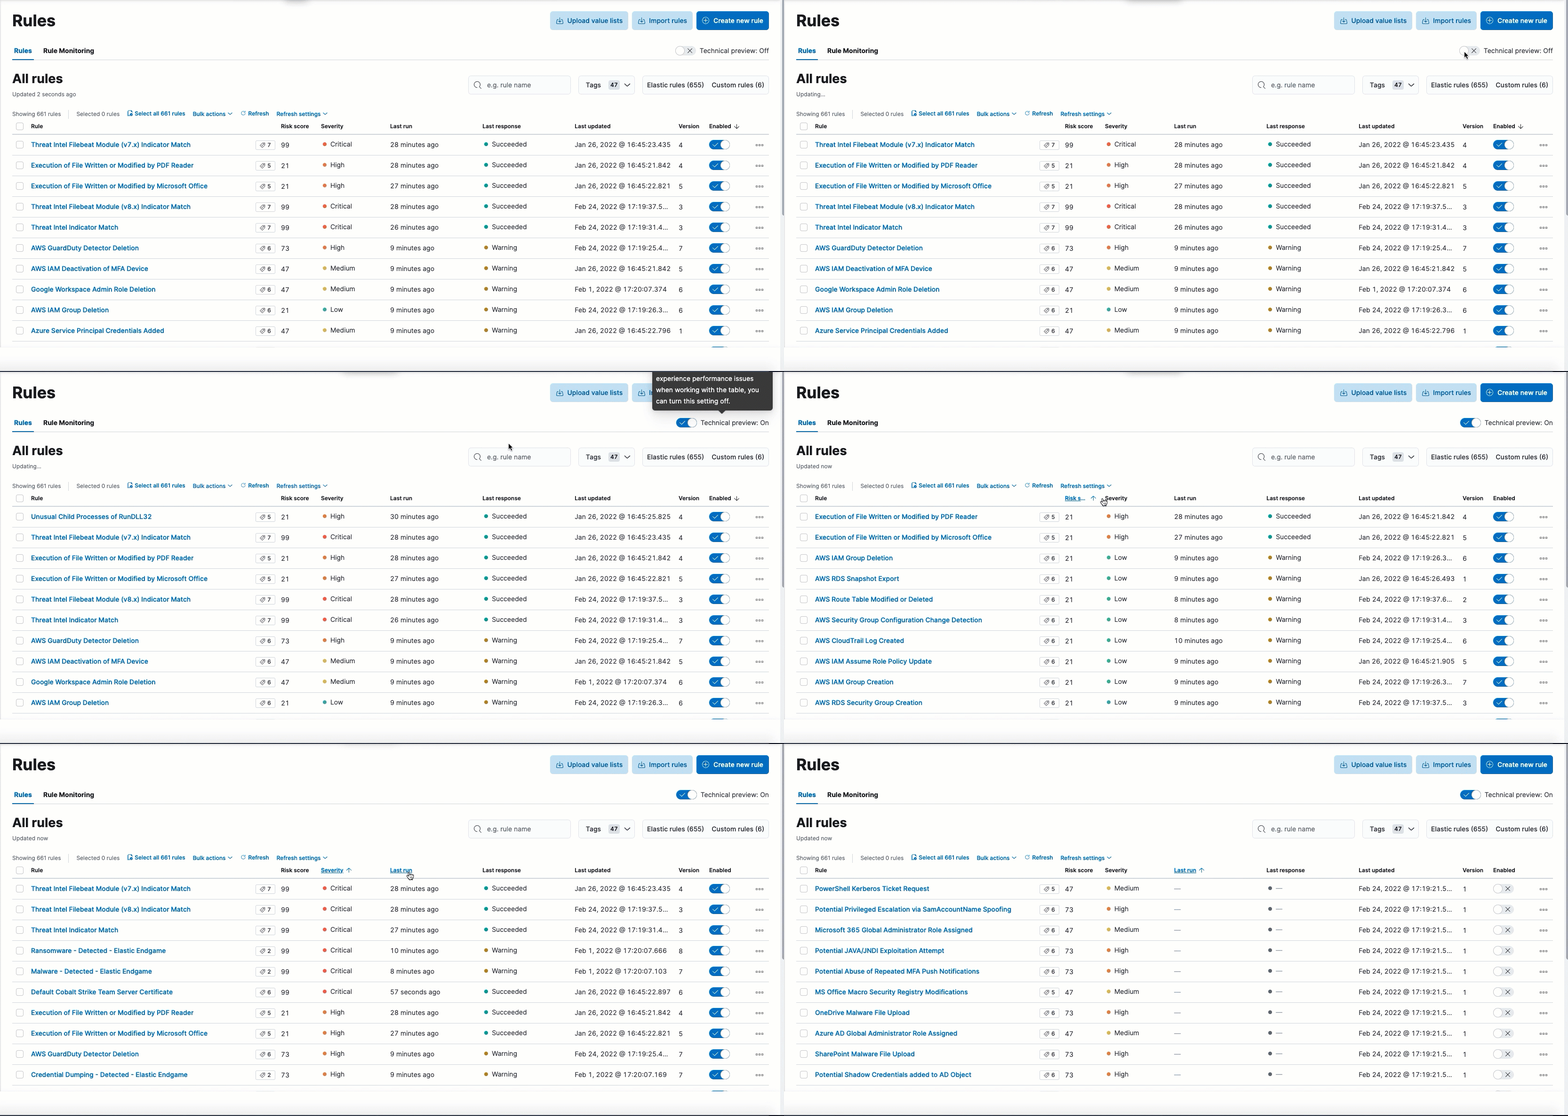
As an optional technical preview, you can now sort these tables by any column. To enable the technical preview, switch the Technical preview toggle on. If you experience performance issues, you can turn this setting off.
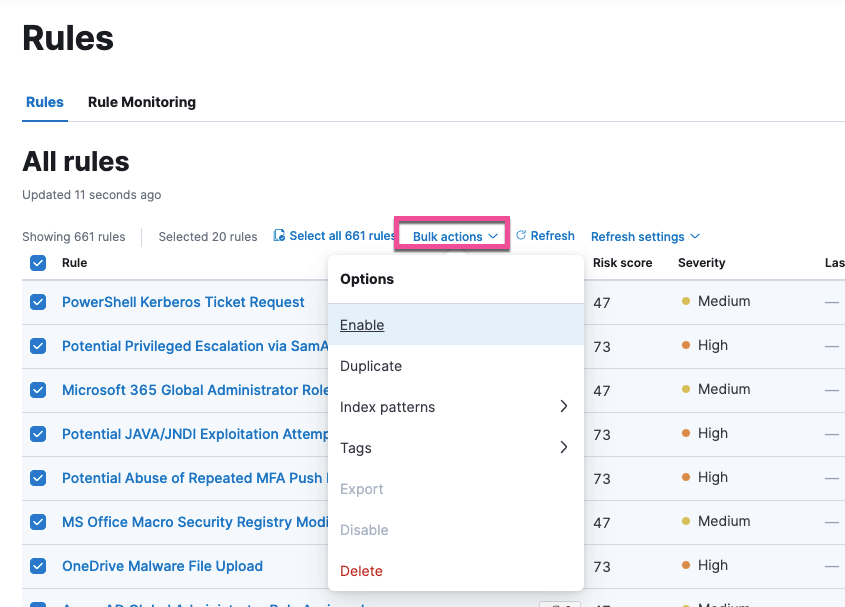
The following new bulk actions can be performed on multiple rules simultaneously:
- Add index patterns
- Delete index patterns
- Add tags
- Delete tags
Select the Bulk actions menu to view all available bulk options.
Event filters and host isolation exceptions can be applied per policy
Users with a Platinum or Enterprise license can apply new or existing event filters and host isolation exceptions to a specific integration policy instead of globally. This allows you to configure settings that may be unique to a specific group within your network.
Network map data requires new permissions
To view network map data, you now need at least Read privileges for Maps. Refer to Configure network map data for more information.
Alert enhancements
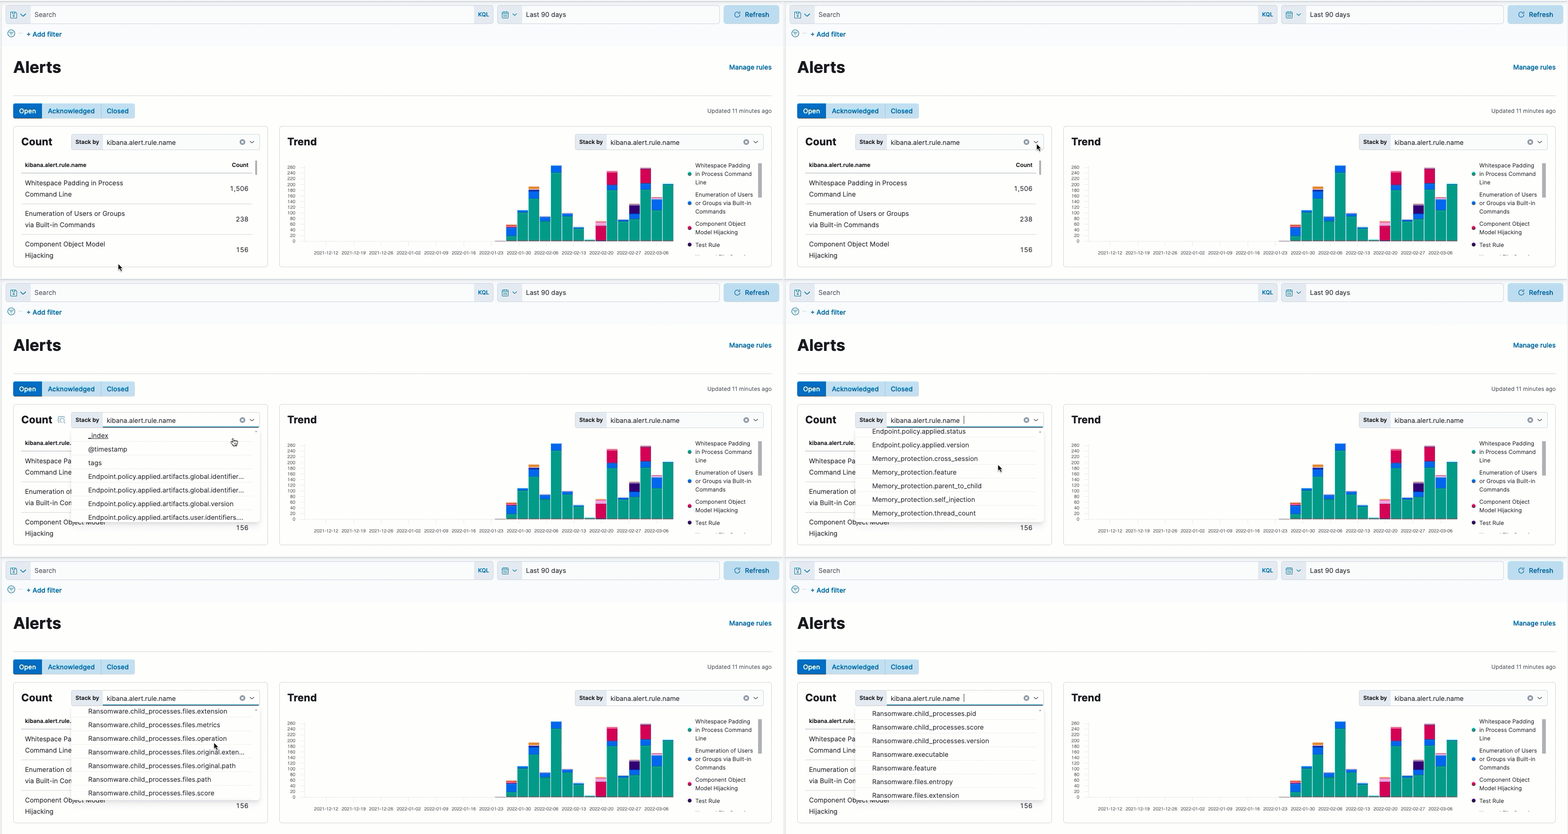
On the Alerts page, the Trend and Count tables now allow you to aggregate alert data based on any aggregatable ECS field. Previously, only a handful of fields were visible.
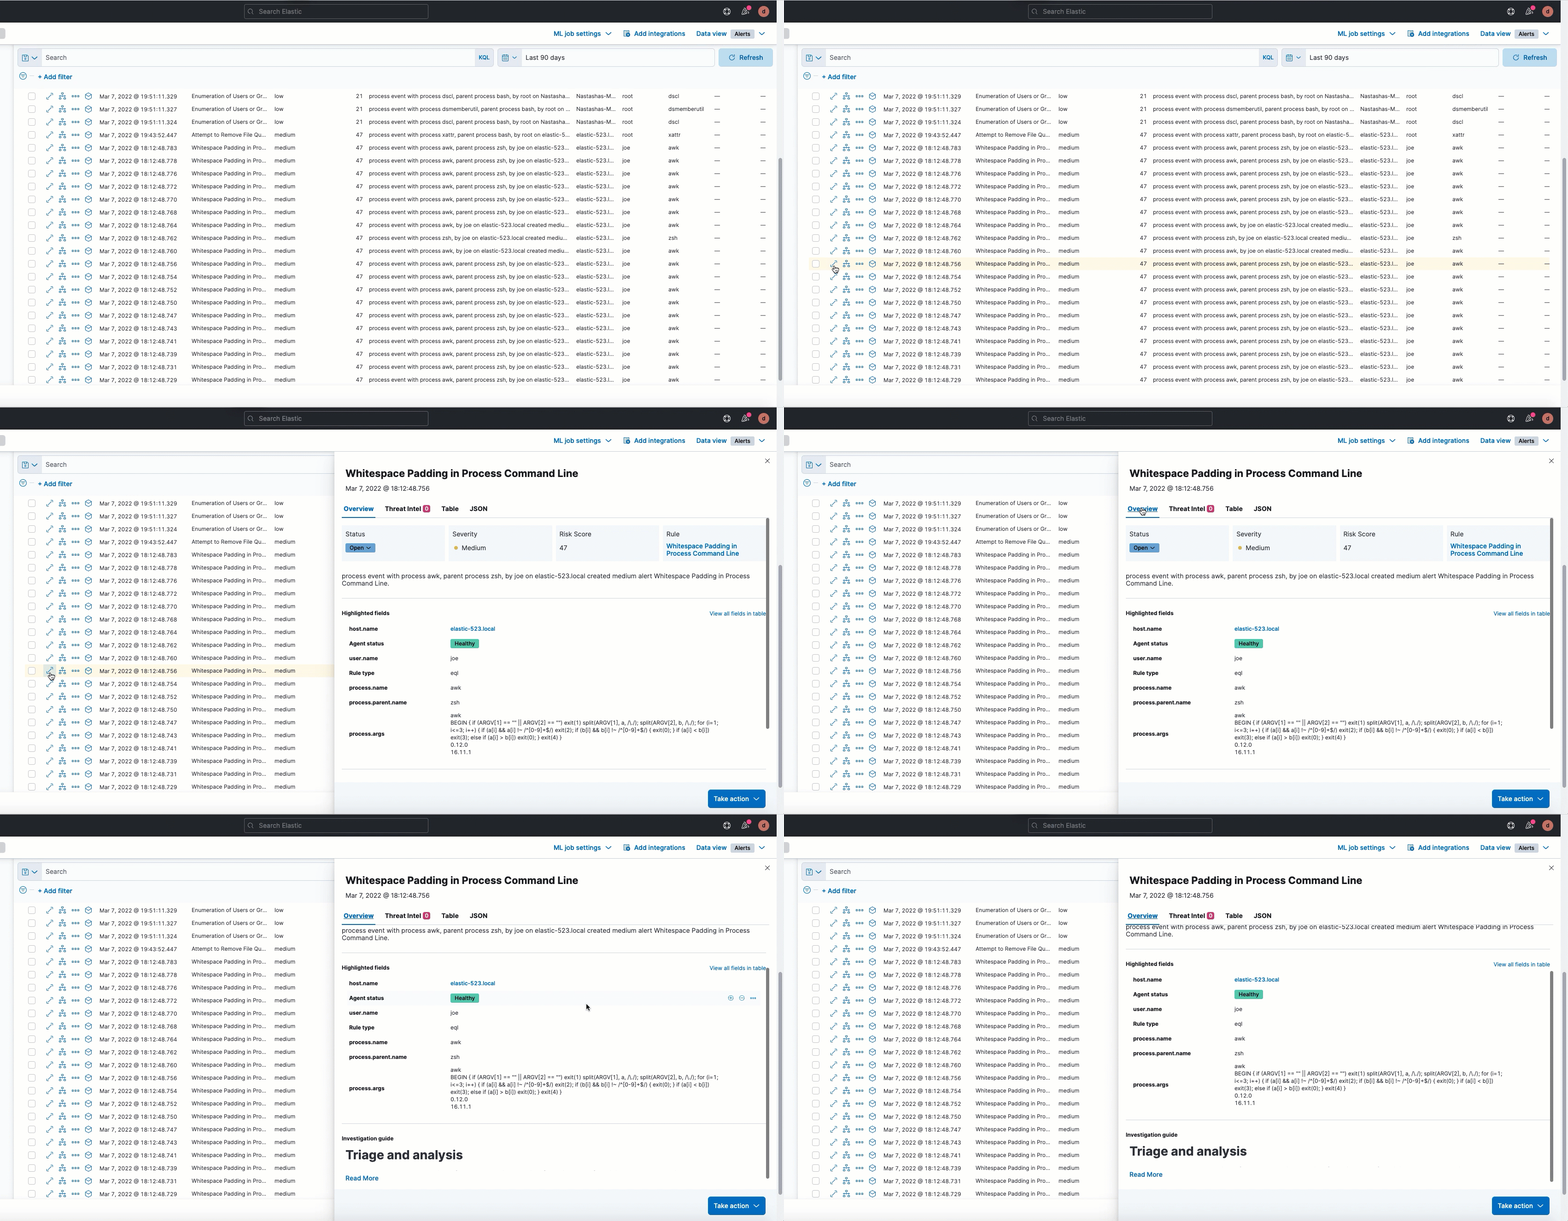
The alert details flyout has a new layout that highlights relevant fields. You can also now update an alert’s status directly from the flyout.
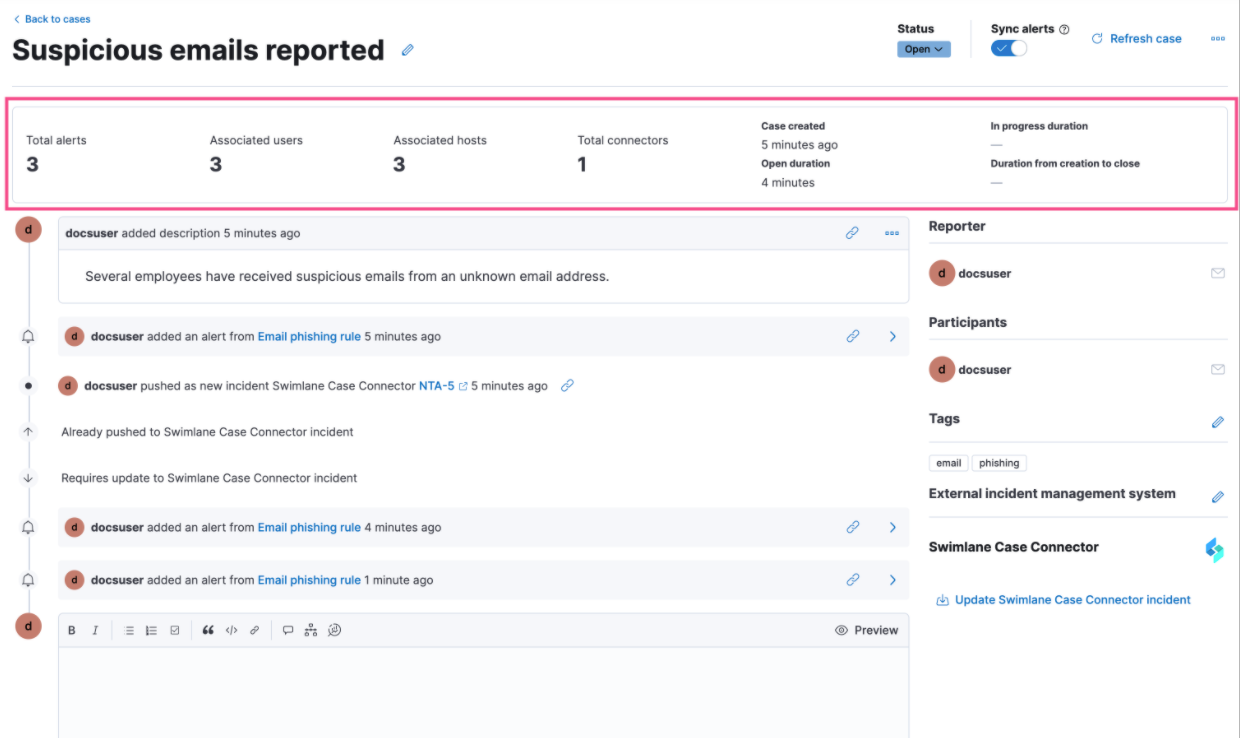
New Cases metrics
Cases now have metrics that summarize alert information and response times.
Indicator match rule enhancements
In addition to improvements to indicator match rule performance, the default indicator index query for custom and prebuilt indicator match rules has been updated to @timestamp > "now-30d/d" to fine-tune the query range and performance.