WARNING: Version 6.0 of Kibana has passed its EOL date.
This documentation is no longer being maintained and may be removed. If you are running this version, we strongly advise you to upgrade. For the latest information, see the current release documentation.
Console
editConsole
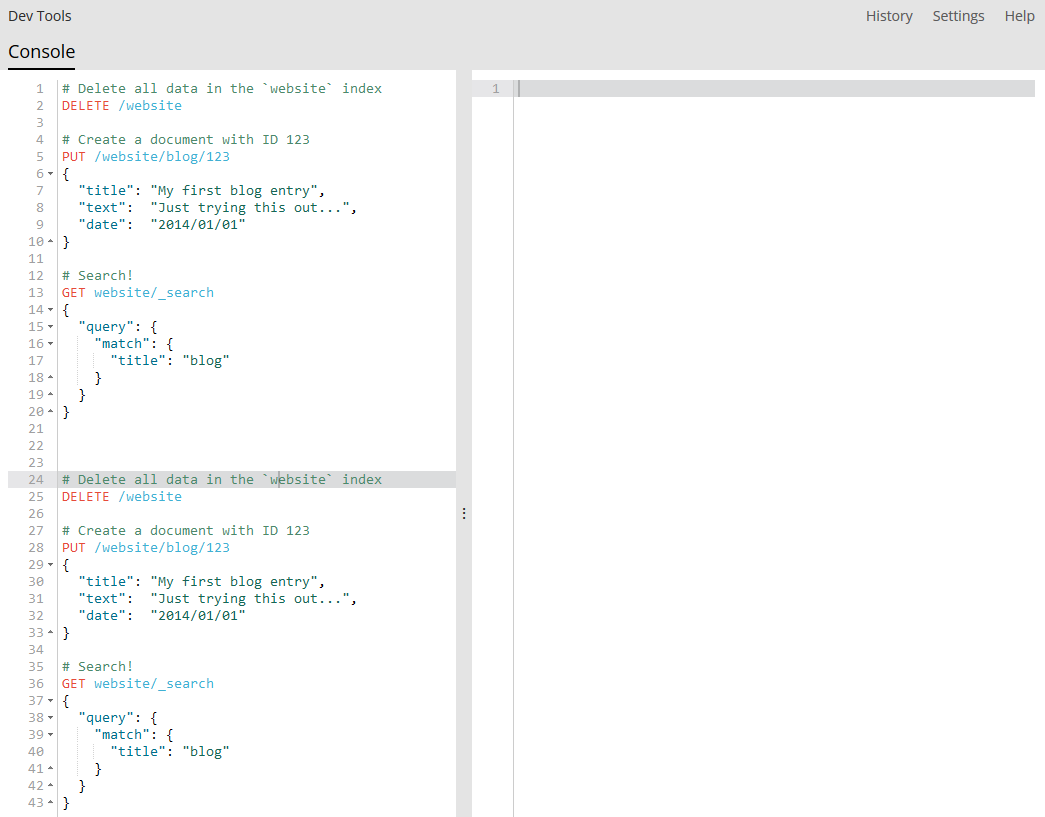
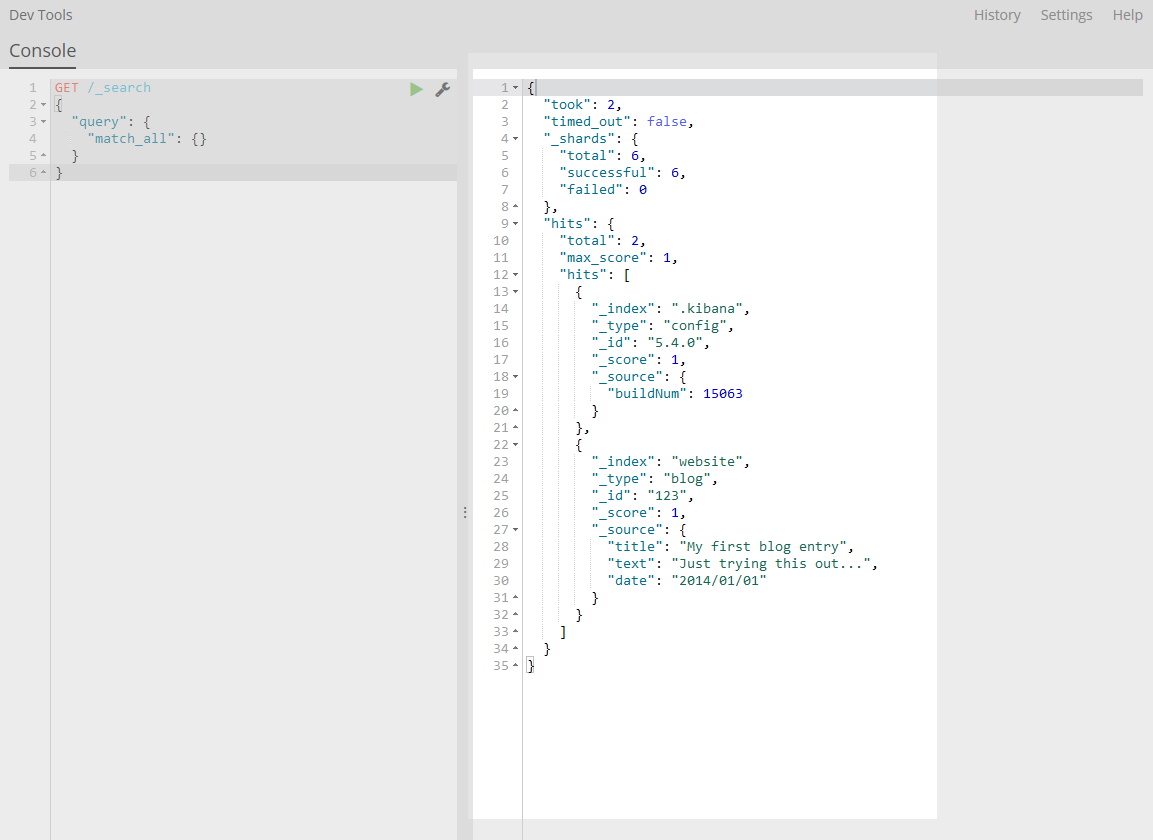
editThe Console plugin provides a UI to interact with the REST API of Elasticsearch. Console has two main areas: the editor, where you compose requests to Elasticsearch, and the response pane, which displays the responses to the request.

Console understands commands in a cURL-like syntax. For example the following Console command
GET /_search
{
  "query": {
    "match_all": {}
  }
}
is a simple GET request to Elasticsearch’s _search API. Here is the equivalent command in cURL.
curl -XGET "http://localhost:9200/_search" -d'
{
  "query": {
    "match_all": {}
  }
}'
In fact, you can paste the above command into Console and it will automatically be converted into the Console syntax.
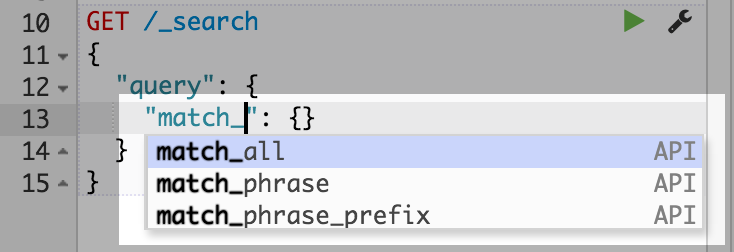
When typing a command, Console will make context sensitive suggestions. These suggestions can help you explore parameters for each API, or to just speed up typing. Console will suggest APIs, indexes and field names.

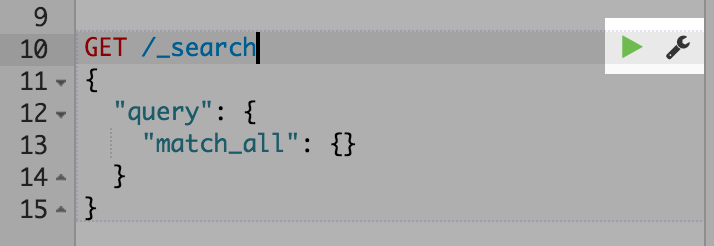
Once you have typed a command in to the left pane, you can submit it to Elasticsearch by clicking the little green triangle that appears next to the URL line of the request. Notice that as you move the cursor around, the little triangle and wrench icons follow you around. We call this the Action Menu. You can also select multiple requests and submit them all at once.
When the response come back, you should see it in the left hand panel:

The Console UI
editIn this section you will find a more detailed description of UI of Console. The basic aspects of the UI are explained in the Console section.
