Alert details
editAlert details
editThe Alert details page tells you about the state of the alert and provides granular control over the actions it is taking.

In this example, alerts detect when a site serves more than a threshold number of bytes in a 24 hour period. Three sites are above the threshold. These are called alert instances - occurrences of the condition being detected - and the instance name, status, time of detection, and duration of the condition are shown in this view.
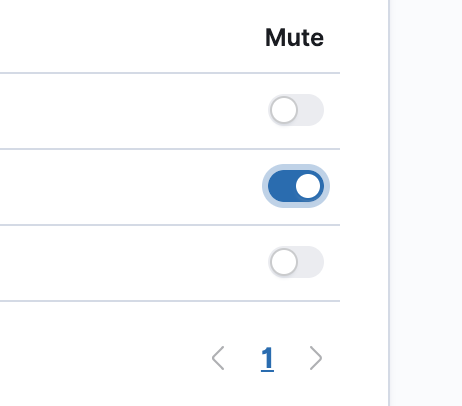
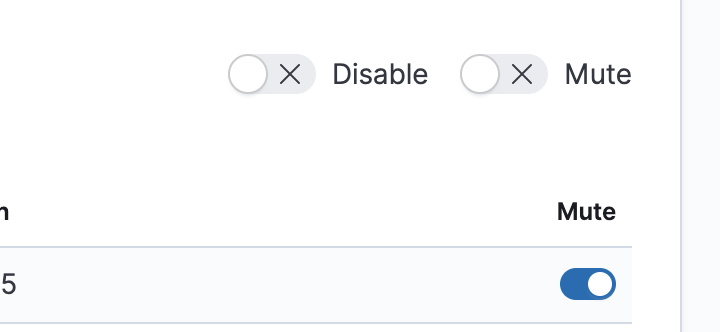
Upon detection, each instance can trigger one or more actions. If the condition persists, the same actions will trigger either on the next scheduled alert check, or (if defined) after the re-notify period on the alert has passed. To prevent re-notification, you can suppress future actions by clicking on the eye icon to mute an individual alert instance. Muting means that the alert checks continue to run on a schedule, but that instance will not trigger any action.

Alert instances will come and go from the list depending on whether they meet the alert conditions or not - unless they are muted. If a muted instance no longer meets the alert conditions, it will appear as inactive in the list. This prevents an instance from triggering actions if it reappears in the future.

If you want to suppress actions on all current and future instances, you can mute the entire alert. Alert checks continue to run and the instance list will update as instances activate or deactivate, but no actions will be triggered.

You can also disable an alert altogether. When disabled, the alert stops running checks altogether and will clear any instances it is tracking. You may want to disable alerts that are not currently needed to reduce the load on Kibana and Elasticsearch.

- For further information on alerting concepts and examples, see Alerting and Actions.