- Kibana Guide: other versions:
- What is Kibana?
- What’s new in 7.11
- Quick start
- Set up
- Discover
- Dashboard
- Canvas
- Maps
- Machine learning
- Graph
- Observability
- APM
- Elastic Security
- Dev Tools
- Stack Monitoring
- Stack Management
- Fleet
- Reporting
- Alerting and Actions
- REST API
- Kibana plugins
- Accessibility
- Breaking Changes
- Release notes
- Kibana 7.11.2
- Kibana 7.11.1
- Kibana 7.11.0
- Kibana 7.10.2
- Kibana 7.10.1
- Kibana 7.10.0
- Kibana 7.9.3
- Kibana 7.9.2
- Kibana 7.9.1
- Kibana 7.9.0
- Kibana 7.8.1
- Kibana 7.8.0
- Kibana 7.7.1
- Kibana 7.7.0
- Kibana 7.6.2
- Kibana 7.6.1
- Kibana 7.6.0
- Kibana 7.5.2
- Kibana 7.5.1
- Kibana 7.5.0
- Kibana 7.4.2
- Kibana 7.4.1
- Kibana 7.4.0
- Kibana 7.3.2
- Kibana 7.3.1
- Kibana 7.3.0
- Kibana 7.2.1
- Kibana 7.2.0
- Kibana 7.1.1
- Kibana 7.1.0
- Kibana 7.0.1
- Kibana 7.0.0
- Kibana 7.0.0-rc2
- Kibana 7.0.0-rc1
- Kibana 7.0.0-beta1
- Kibana 7.0.0-alpha2
- Kibana 7.0.0-alpha1
- Developer guide
Alerts and Actions
editAlerts and Actions
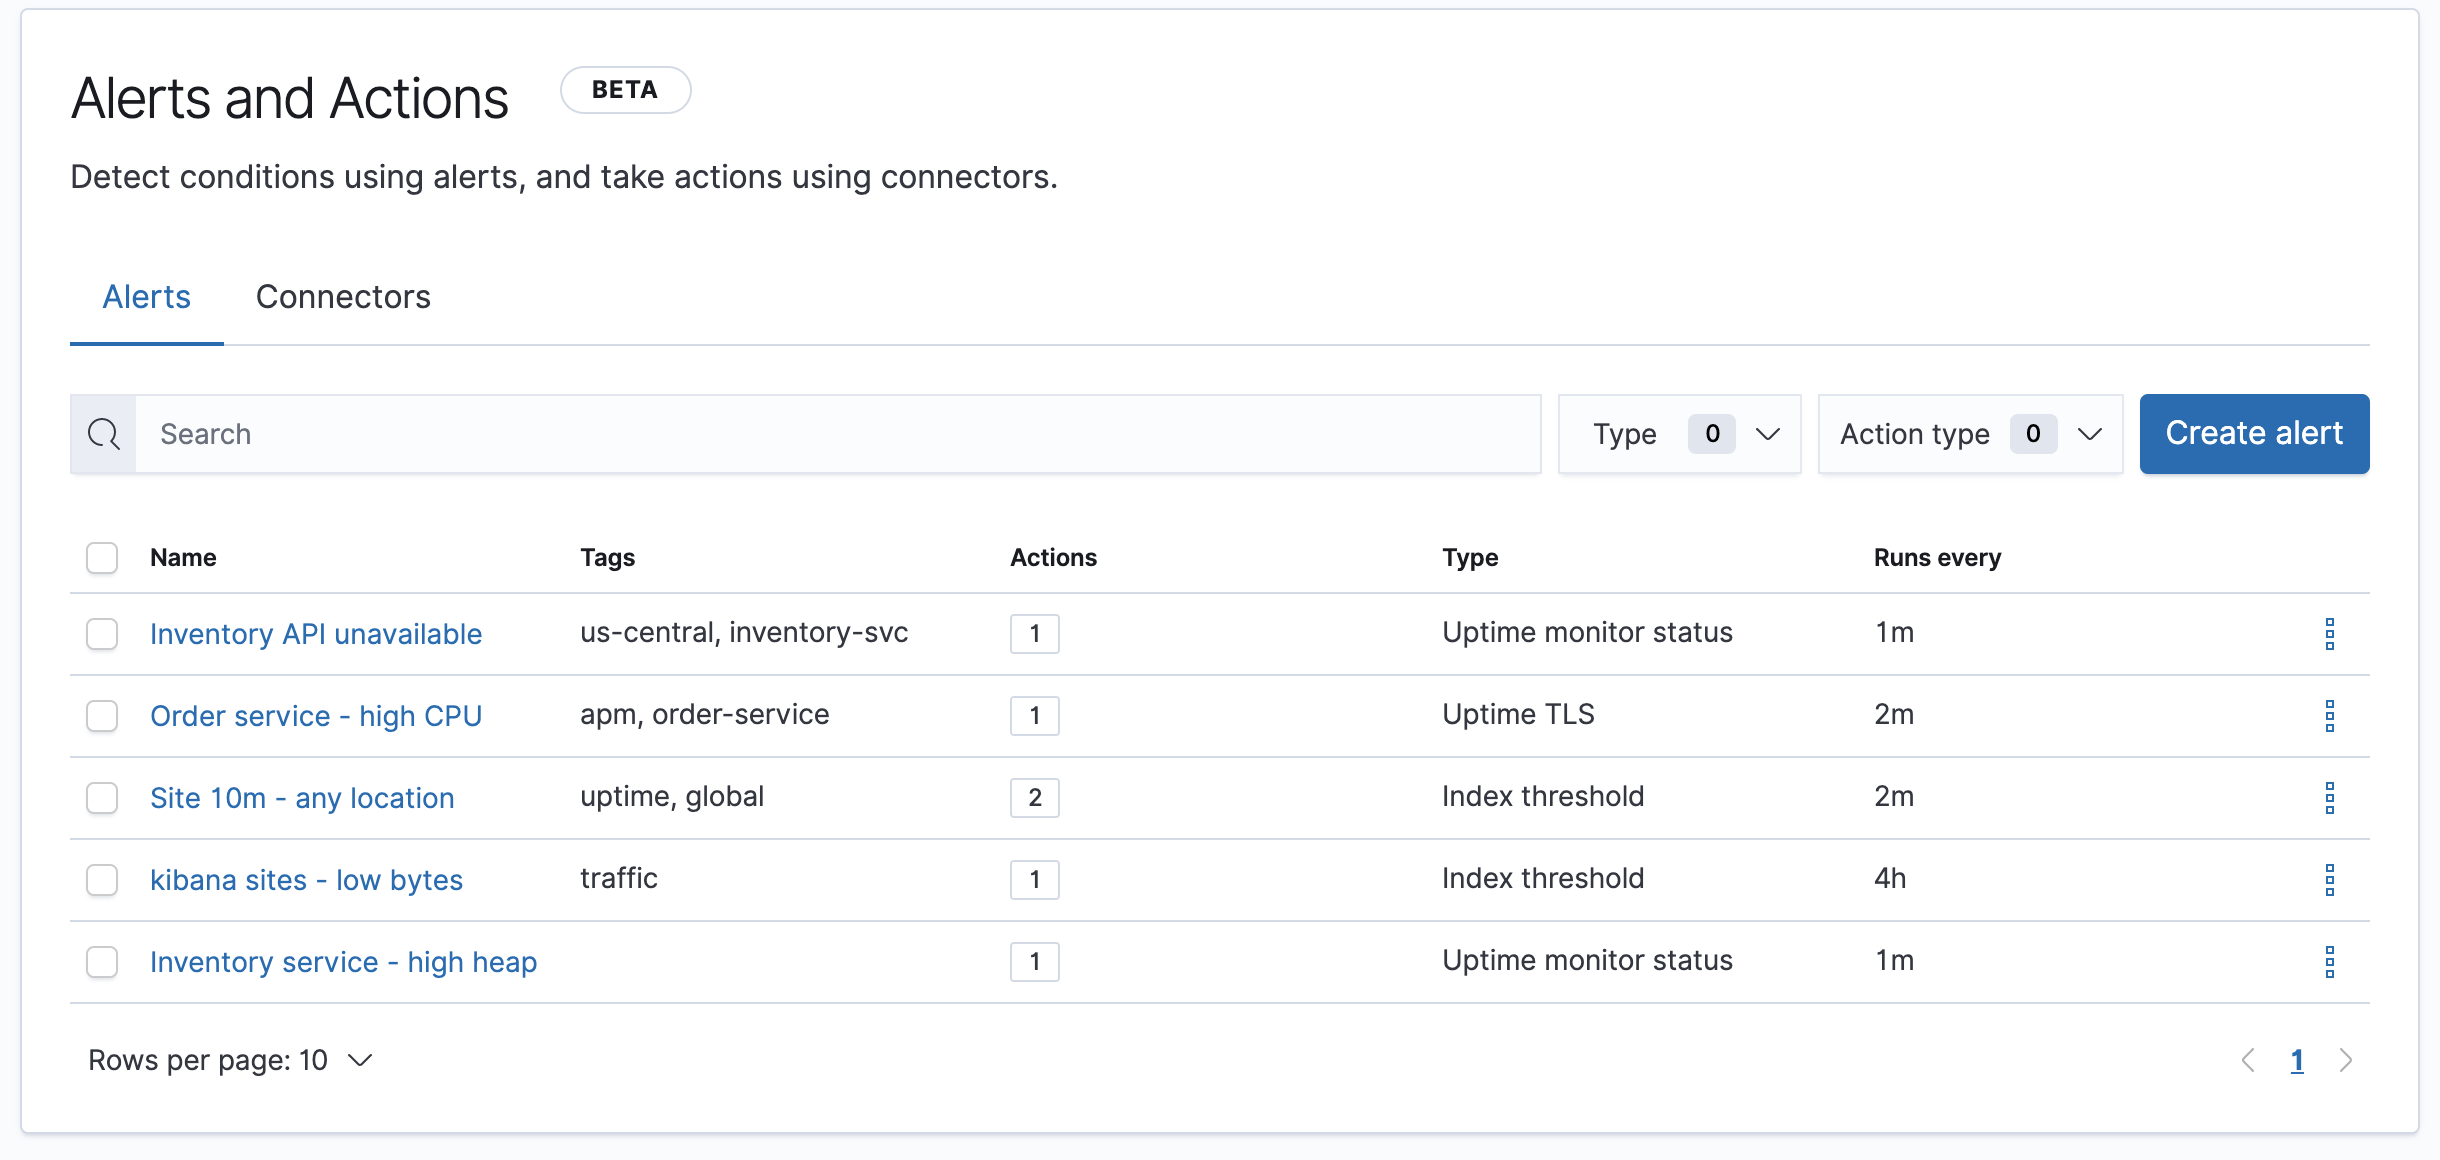
editThe Alerts and Actions UI lets you see and control all the alerts in a space, and provides tools to create and manage connectors so that alerts can trigger actions like notification, indexing, and ticketing.
To manage alerting and connectors, open the main menu, then click Stack Management > Alerts and Insights > Alerts and Actions.
Similar to dashboards, alerts and connectors reside in a space. The Alerts and Actions UI only shows alerts and connectors for the current space.
Elasticsearch also offers alerting capabilities through Watcher, which can be managed through the Watcher UI. See Differences from Watcher for more information.
Required permissions
editAccess to alerts and actions is granted based on your privileges to alerting-enabled features. See Alerting Security for more information.
On this page