- Kibana Guide: other versions:
- What is Kibana?
- What’s new in 7.8
- Get started
- Set up Kibana
- Discover
- Dashboard
- Canvas
- Maps
- Machine learning
- Graph
- Visualize
- Logs
- Metrics
- APM
- Uptime
- SIEM
- Dev Tools
- Stack Monitoring
- Management
- Advanced Settings
- Alerts and Actions
- Beats Central Management
- Cross-Cluster Replication
- Index Lifecycle Policies
- Index Management
- Ingest Node Pipelines
- Index patterns and fields
- License Management
- Numeral Formatting
- Remote Clusters
- Rollup Jobs
- Saved Objects
- Security
- Snapshot and Restore
- Spaces
- Upgrade Assistant
- Watcher
- Ingest Manager
- Reporting
- Alerting and Actions
- REST API
- Kibana plugins
- Accessibility
- Limitations
- Breaking Changes
- Release Notes
- Kibana 7.8.1
- Kibana 7.8.0
- Kibana 7.7.1
- Kibana 7.7.0
- Kibana 7.6.2
- Kibana 7.6.1
- Kibana 7.6.0
- Kibana 7.5.2
- Kibana 7.5.1
- Kibana 7.5.0
- Kibana 7.4.2
- Kibana 7.4.1
- Kibana 7.4.0
- Kibana 7.3.2
- Kibana 7.3.1
- Kibana 7.3.0
- Kibana 7.2.1
- Kibana 7.2.0
- Kibana 7.1.1
- Kibana 7.1.0
- Kibana 7.0.1
- Kibana 7.0.0
- Kibana 7.0.0-rc2
- Kibana 7.0.0-rc1
- Kibana 7.0.0-beta1
- Kibana 7.0.0-alpha2
- Kibana 7.0.0-alpha1
- Developer guide
Change your expression, change your output
editChange your expression, change your output
editYou can substitute one function for another to change the output. For example, you could change the visualization by swapping out the pie function for another renderer, a function that returns a render data type.
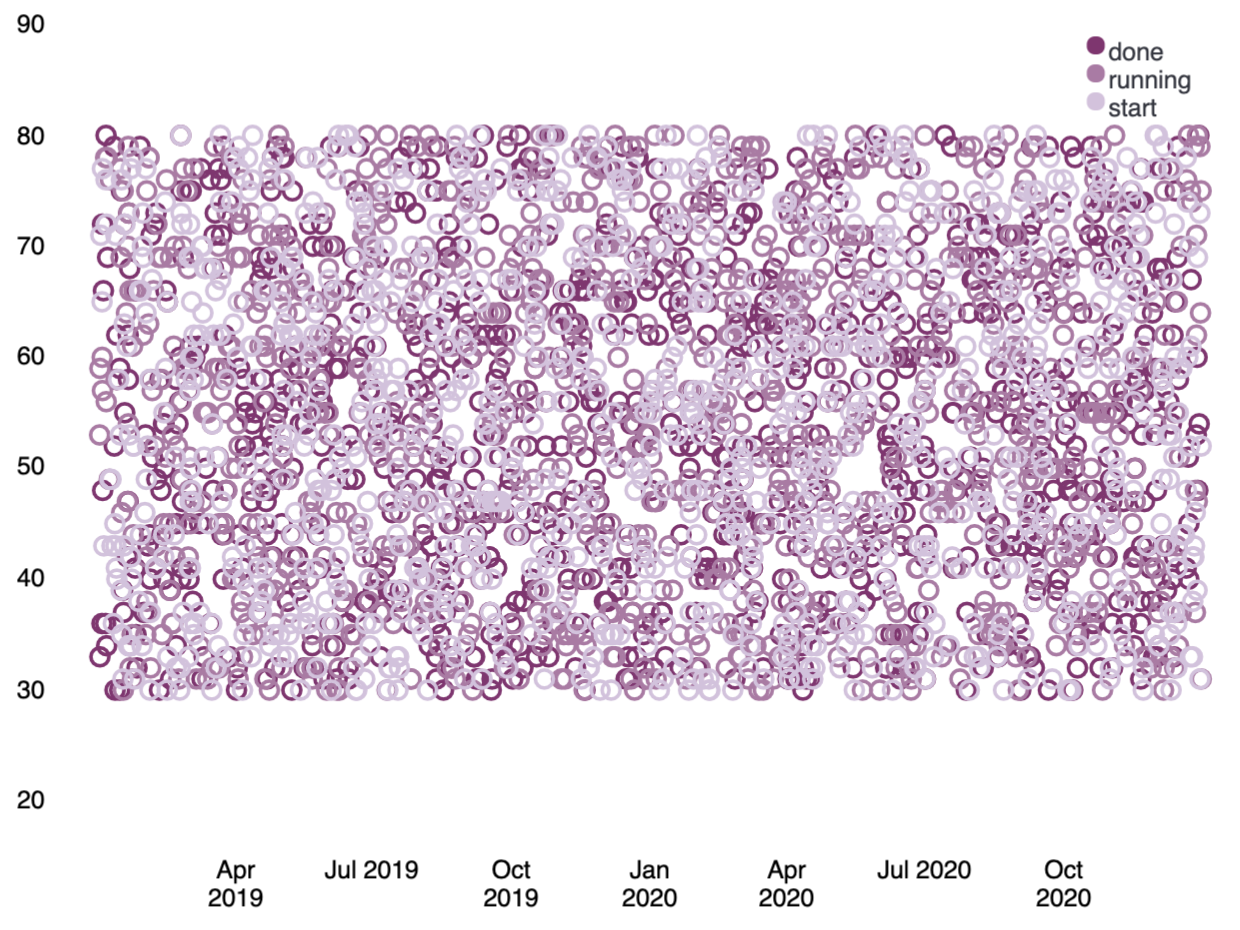
Let’s change that last pie chart into a bubble chart by replacing the pie function with the plot function. This is possible because both functions can accept a pointseries data type as their context. Switching the functions will work, but it won’t produce a useful visualization on its own since you don’t have the x-axis and y-axis defined. You will also need to modify the pointseries function to change its output. In this case, you can change the size argument to y, so the maximum price values are plotted on the y-axis, and add an x argument using the @timestamp field in the data to plot those values over time. This leaves you with the following expression and produces a bubble chart showing the max price of each state over time:

filters
| demodata
| pointseries color="state" y="max(price)" x="@timestamp"
| plot
| render
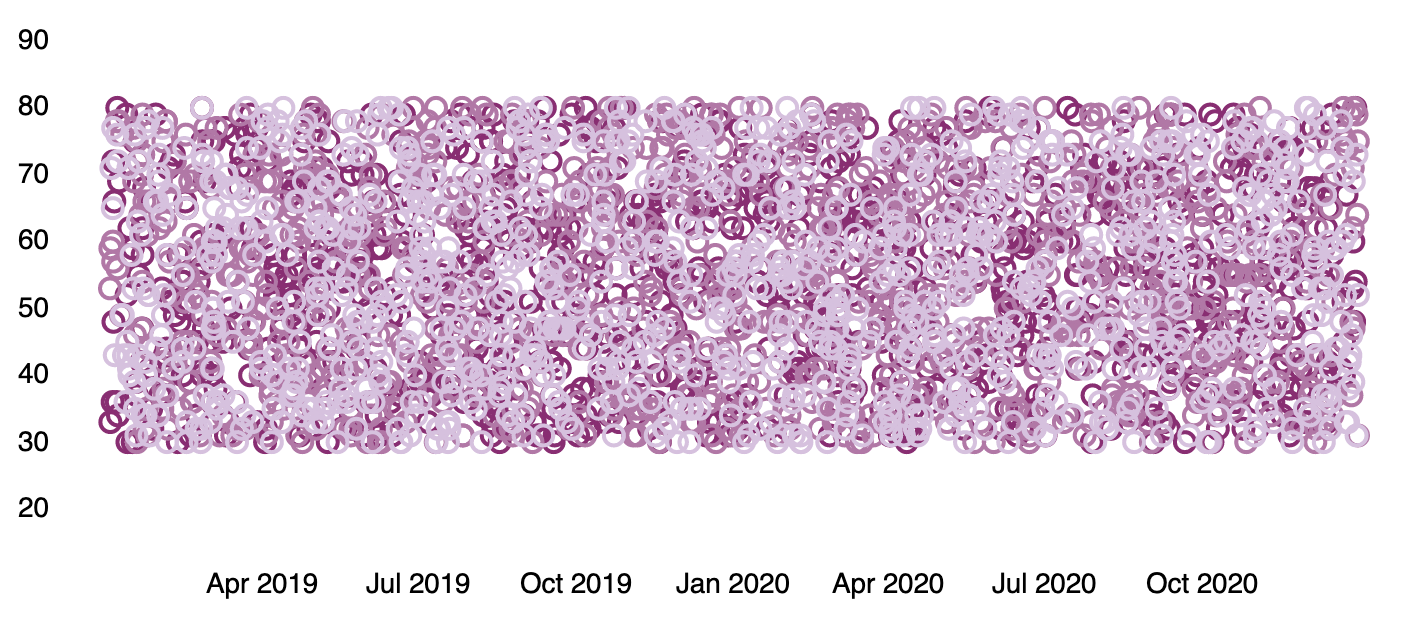
Similar to the pie function, the plot function takes arguments that control the design elements of the visualization. As one example, passing a legend argument with a value of false to the function will hide the legend on the chart.

filters
| demodata
| pointseries color="state" y="max(price)" x="@timestamp"
| plot legend=false
| render