- Kibana Guide: other versions:
- What is Kibana?
- What’s new in 7.8
- Get started
- Set up Kibana
- Discover
- Dashboard
- Canvas
- Maps
- Machine learning
- Graph
- Visualize
- Logs
- Metrics
- APM
- Uptime
- SIEM
- Dev Tools
- Stack Monitoring
- Management
- Advanced Settings
- Alerts and Actions
- Beats Central Management
- Cross-Cluster Replication
- Index Lifecycle Policies
- Index Management
- Ingest Node Pipelines
- Index patterns and fields
- License Management
- Numeral Formatting
- Remote Clusters
- Rollup Jobs
- Saved Objects
- Security
- Snapshot and Restore
- Spaces
- Upgrade Assistant
- Watcher
- Ingest Manager
- Reporting
- Alerting and Actions
- REST API
- Kibana plugins
- Accessibility
- Limitations
- Breaking Changes
- Release Notes
- Kibana 7.8.1
- Kibana 7.8.0
- Kibana 7.7.1
- Kibana 7.7.0
- Kibana 7.6.2
- Kibana 7.6.1
- Kibana 7.6.0
- Kibana 7.5.2
- Kibana 7.5.1
- Kibana 7.5.0
- Kibana 7.4.2
- Kibana 7.4.1
- Kibana 7.4.0
- Kibana 7.3.2
- Kibana 7.3.1
- Kibana 7.3.0
- Kibana 7.2.1
- Kibana 7.2.0
- Kibana 7.1.1
- Kibana 7.1.0
- Kibana 7.0.1
- Kibana 7.0.0
- Kibana 7.0.0-rc2
- Kibana 7.0.0-rc1
- Kibana 7.0.0-beta1
- Kibana 7.0.0-alpha2
- Kibana 7.0.0-alpha1
- Developer guide
IMPORTANT: No additional bug fixes or documentation updates
will be released for this version. For the latest information, see the
current release documentation.
Canvas
editCanvas
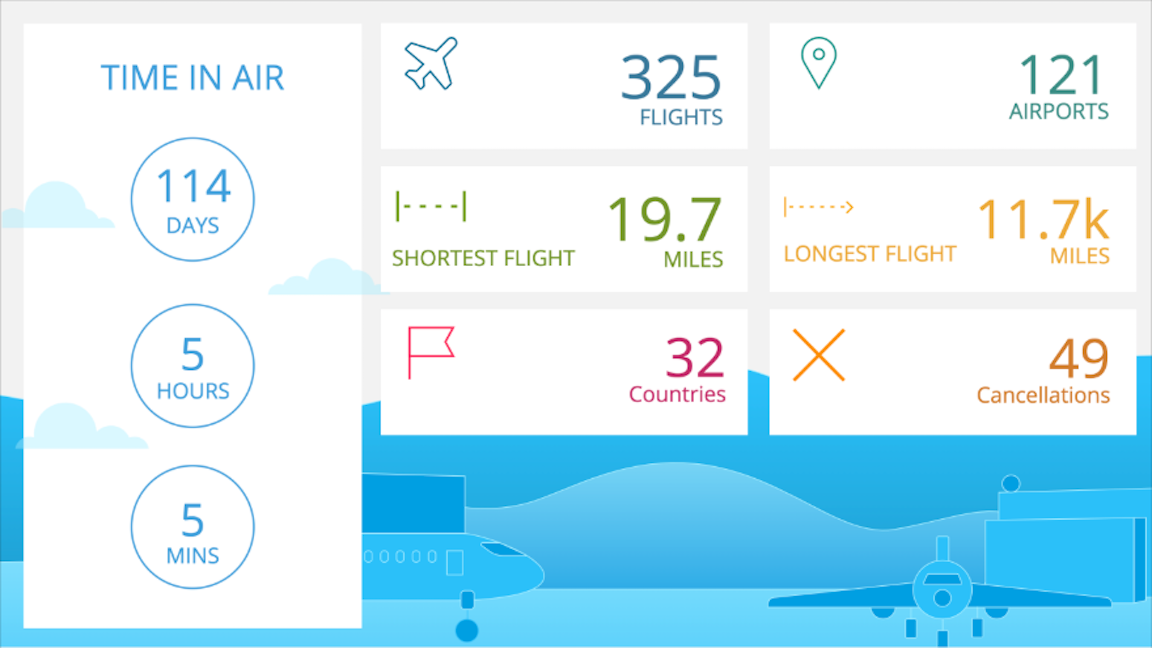
editCanvas is a data visualization and presentation tool that sits within Kibana. With Canvas, you can pull live data directly from Elasticsearch, and combine the data with colors, images, text, and your imagination to create dynamic, multi-page, pixel-perfect displays. If you are a little bit creative, a little bit technical, and a whole lot curious, then Canvas is for you.
With Canvas, you can:
- Create and personalize your work space with backgrounds, borders, colors, fonts, and more.
- Customize your workpad with your own visualizations, such as images and text.
- Pull your data directly from Elasticsearch, then show it off with charts, graphs, progress monitors, and more.
- Focus the data you want to display with filters.
For a quick overview of Canvas, watch Stand out with Canvas.
Was this helpful?
Thank you for your feedback.