- Kibana Guide: other versions:
- What is Kibana?
- What’s new in 7.8
- Get started
- Set up Kibana
- Discover
- Dashboard
- Canvas
- Maps
- Machine learning
- Graph
- Visualize
- Logs
- Metrics
- APM
- Uptime
- SIEM
- Dev Tools
- Stack Monitoring
- Management
- Advanced Settings
- Alerts and Actions
- Beats Central Management
- Cross-Cluster Replication
- Index Lifecycle Policies
- Index Management
- Ingest Node Pipelines
- Index patterns and fields
- License Management
- Numeral Formatting
- Remote Clusters
- Rollup Jobs
- Saved Objects
- Security
- Snapshot and Restore
- Spaces
- Upgrade Assistant
- Watcher
- Ingest Manager
- Reporting
- Alerting and Actions
- REST API
- Kibana plugins
- Accessibility
- Limitations
- Breaking Changes
- Release Notes
- Kibana 7.8.1
- Kibana 7.8.0
- Kibana 7.7.1
- Kibana 7.7.0
- Kibana 7.6.2
- Kibana 7.6.1
- Kibana 7.6.0
- Kibana 7.5.2
- Kibana 7.5.1
- Kibana 7.5.0
- Kibana 7.4.2
- Kibana 7.4.1
- Kibana 7.4.0
- Kibana 7.3.2
- Kibana 7.3.1
- Kibana 7.3.0
- Kibana 7.2.1
- Kibana 7.2.0
- Kibana 7.1.1
- Kibana 7.1.0
- Kibana 7.0.1
- Kibana 7.0.0
- Kibana 7.0.0-rc2
- Kibana 7.0.0-rc1
- Kibana 7.0.0-beta1
- Kibana 7.0.0-alpha2
- Kibana 7.0.0-alpha1
- Developer guide
integration
editintegration
editThe Machine Learning integration initiates a new job predefined to calculate anomaly scores on APM transaction durations. Jobs can be created per transaction type, and are based on the service’s average response time.
After a machine learning job is created, results are shown in two places:
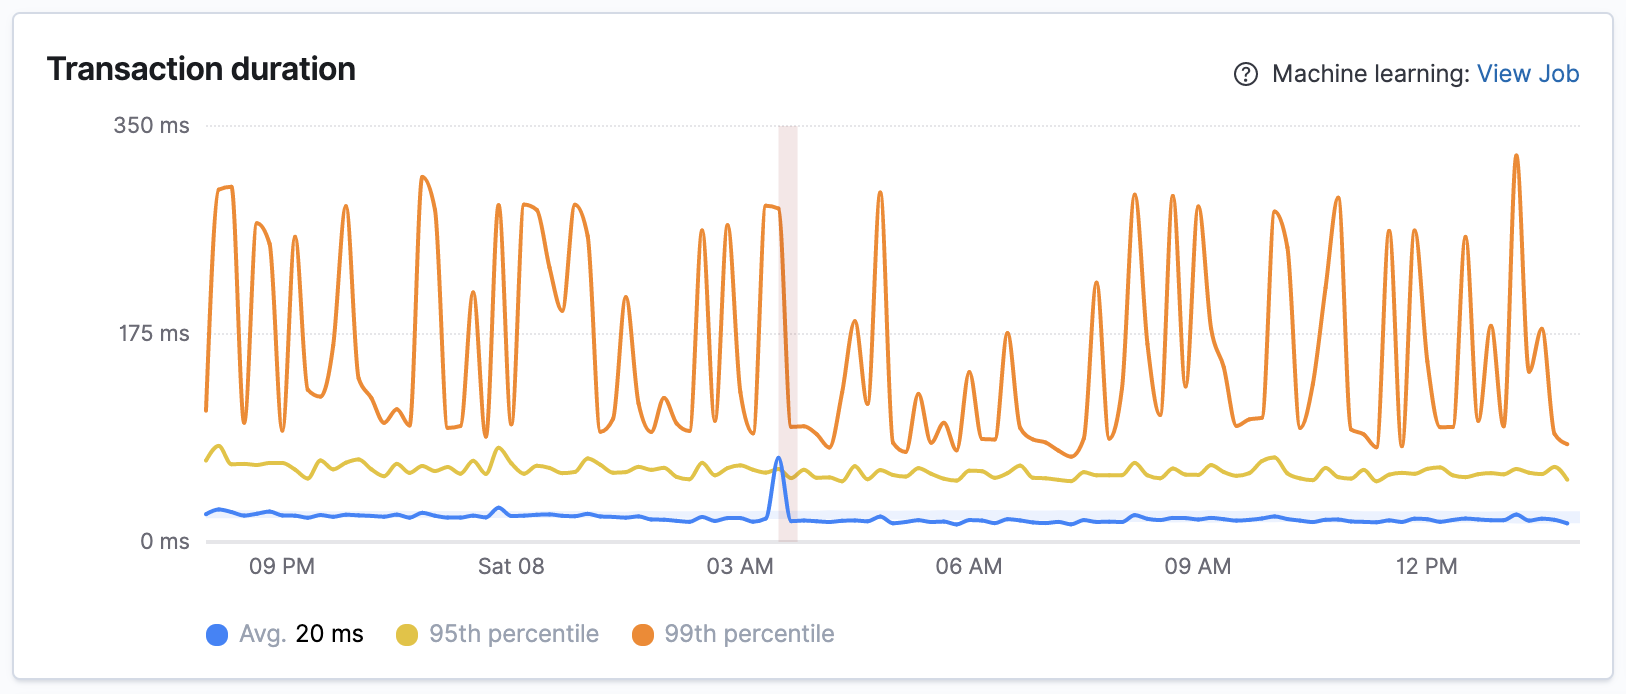
The transaction duration graph will show the expected bounds and add an annotation when the anomaly score is 75 or above.
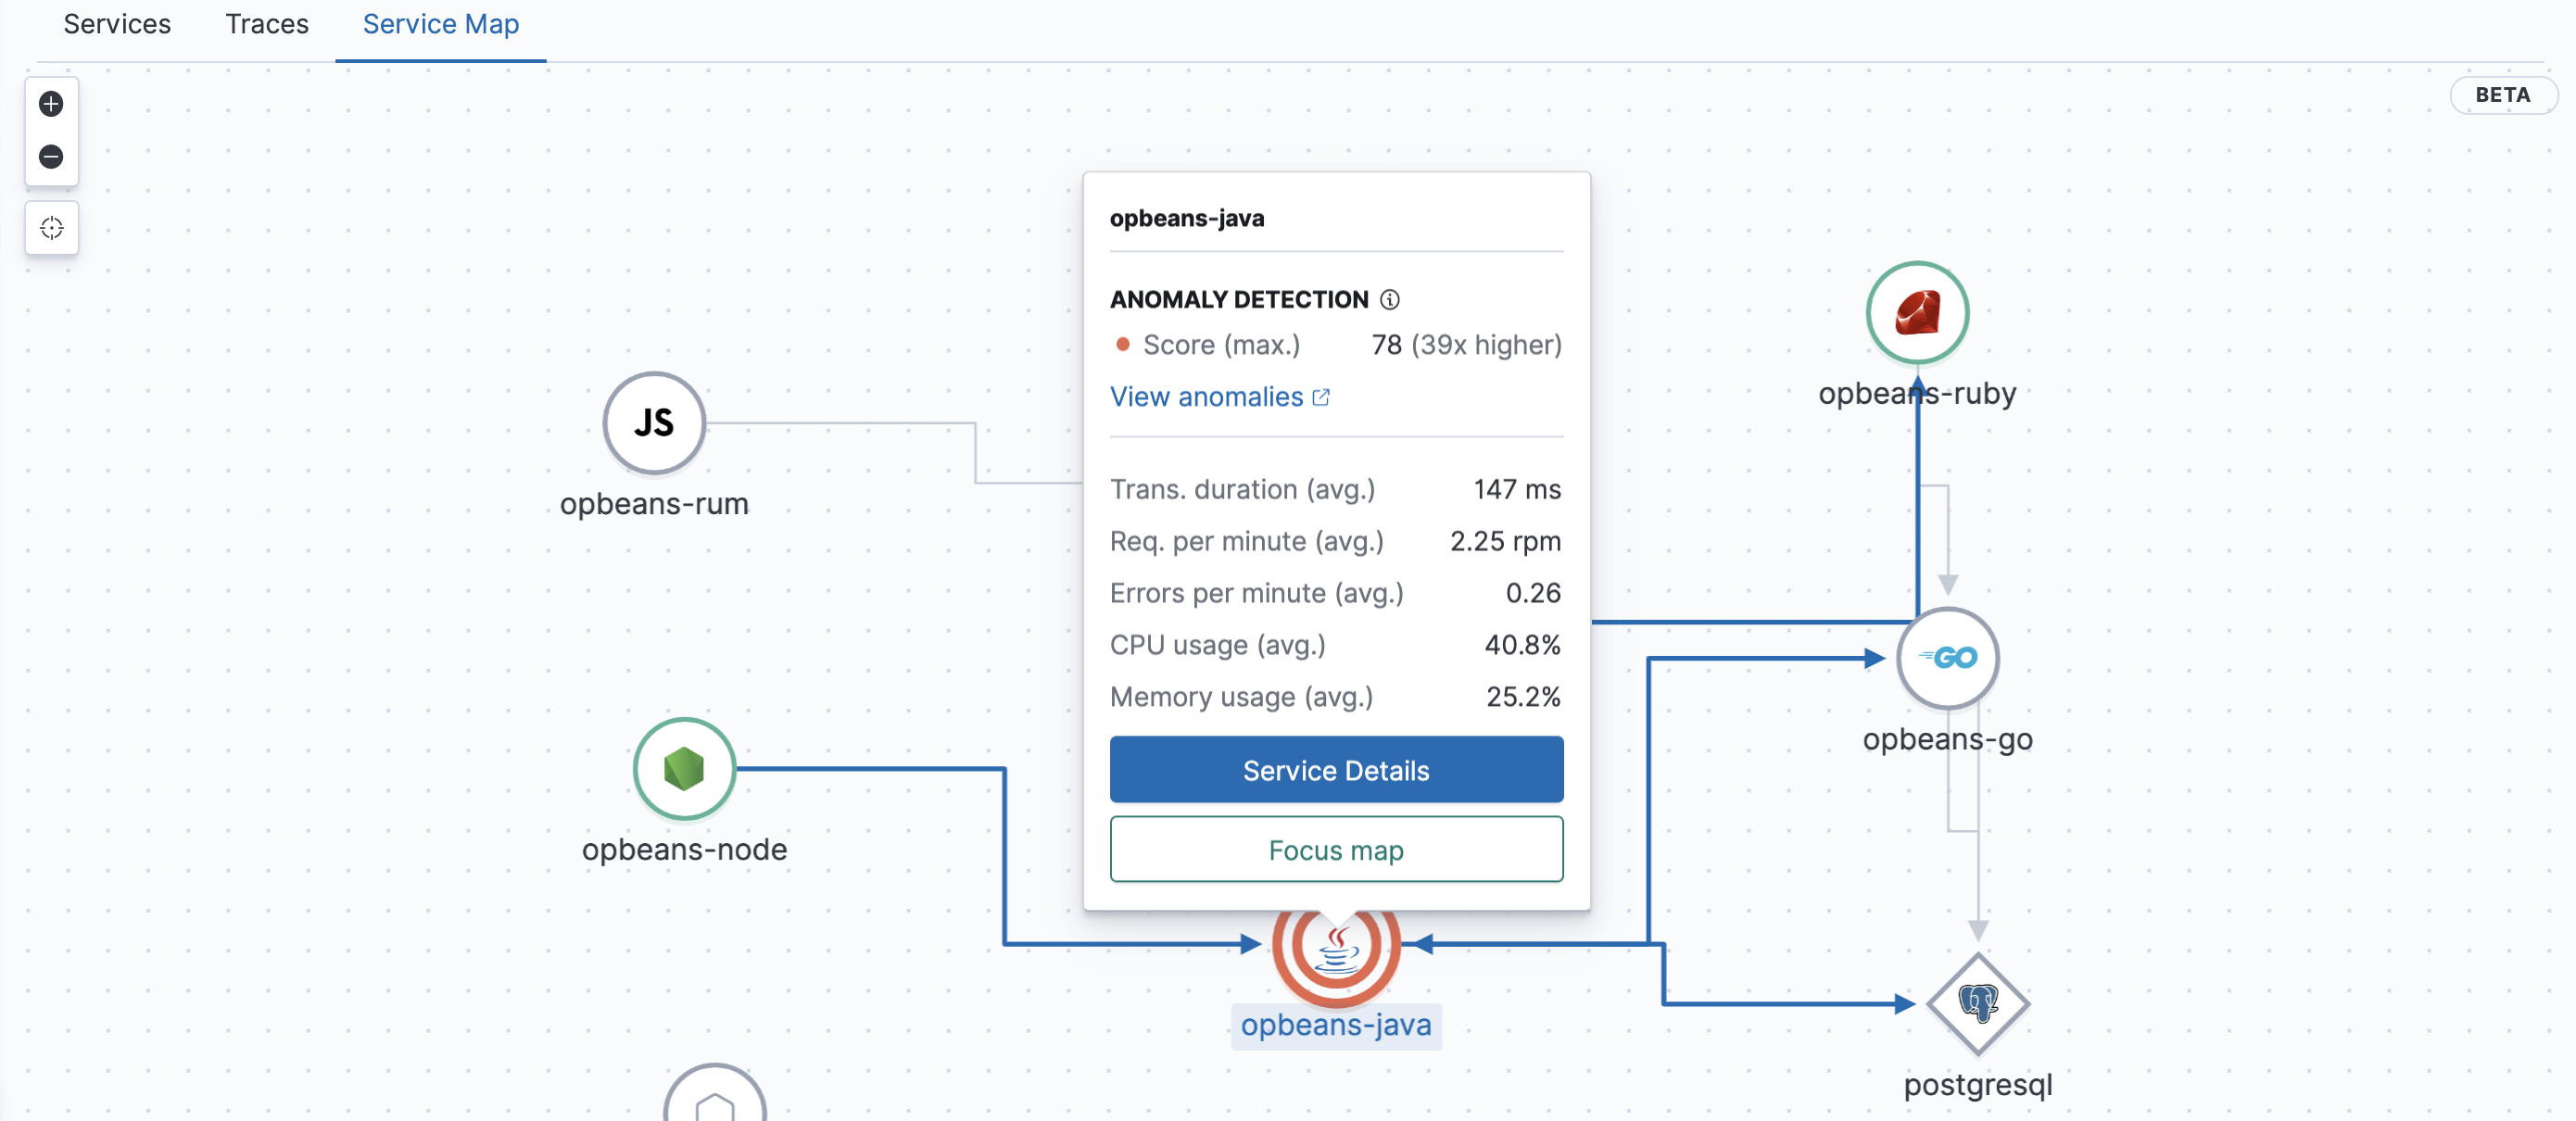
Service maps will display a color-coded anomaly indicator based on the detected anomaly score.
Create a new machine learning job
editTo enable machine learning anomaly detection, first choose a service to monitor. Then, select Integrations > Enable ML anomaly detection and click Create job.
That’s it! After a few minutes, the job will begin calculating results; it might take additional time for results to appear on your graph. Jobs can be managed in Machine Learning jobs management.
APM specific anomaly detection wizards are also available for certain Agents. See the machine learning APM anomaly detection configurations for more information.
On this page