Working with Logstash Modules
editWorking with Logstash Modules
editLogstash modules provide a quick, end-to-end solution for ingesting data and visualizing it with purpose-built dashboards.
These modules are available:
Each module comes pre-packaged with Logstash configurations, Kibana dashboards, and other meta files that make it easier for you to set up the Elastic Stack for specific use cases or data sources.
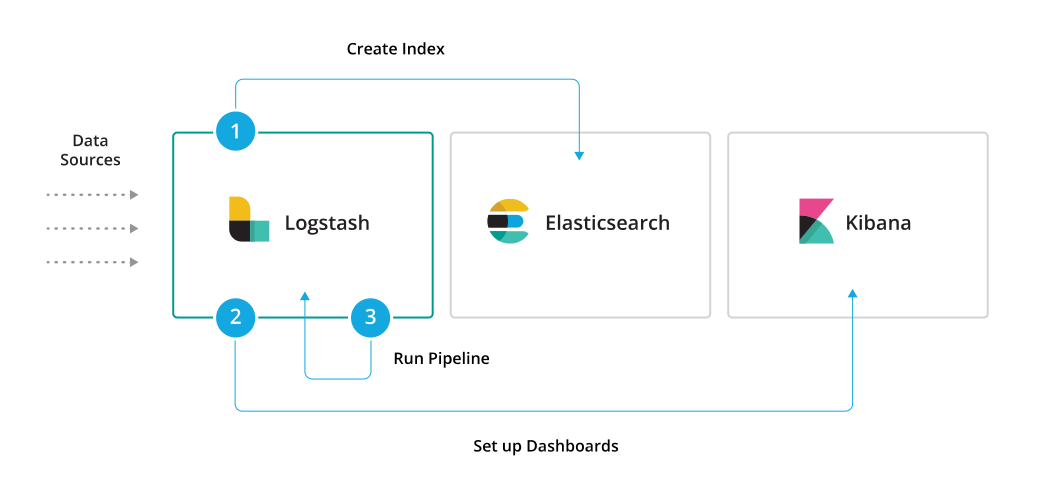
You can think of modules as providing three essential functions that make it easier for you to get started. When you run a module, it will:
- Create the Elasticsearch index.
- Set up the Kibana dashboards, including the index pattern, searches, and visualizations required to visualize your data in Kibana.
- Run the Logstash pipeline with the configurations required to read and parse the data.

Running modules
editTo run a module and set up dashboards, you specify the following options:
bin/logstash --modules MODULE_NAME --setup [-M "CONFIG_SETTING=VALUE"]
Where:
-
--modulesruns the Logstash module specified byMODULE_NAME. -
-M "CONFIG_SETTING=VALUE"is optional and overrides the specified configuration setting. You can specify multiple overrides. Each override must start with-M. See Specify module settings at the command line for more info. -
--setupcreates an index pattern in Elasticsearch and imports Kibana dashboards and visualizations. Running--setupis a one-time setup step. Omit this option for subsequent runs of the module to avoid overwriting existing Kibana dashboards.
For example, the following command runs the Netflow module with the default settings, and sets up the netflow index pattern and dashboards:
bin/logstash --modules netflow --setup
The following command runs the Netflow module and overrides the Elasticsearch
host setting. Here it’s assumed that you’ve already run the setup step.
bin/logstash --modules netflow -M "netflow.var.elasticsearch.host=es.mycloud.com"
Configuring modules
editTo configure a module, you can either
specify configuration settings in the
logstash.yml settings file, or use command-line overrides to
specify settings at the command line.
Specify module settings in logstash.yml
editTo specify module settings in the logstash.yml
settings file file, you add a module definition to
the modules array. Each module definition begins with a dash (-) and is followed
by name: module_name then a series of name/value pairs that specify module
settings. For example:
modules:
- name: netflow
  var.elasticsearch.hosts: "es.mycloud.com"
  var.elasticsearch.username: "foo"
  var.elasticsearch.password: "password"
  var.kibana.host: "kb.mycloud.com"
  var.kibana.username: "foo"
  var.kibana.password: "password"
  var.input.tcp.port: 5606
For a list of available module settings, see the documentation for the module.
Specify module settings at the command line
editYou can override module settings by specifying one or more configuration
overrides when you start Logstash. To specify an override, you use the -M
command line option:
-M MODULE_NAME.var.PLUGINTYPE1.PLUGINNAME1.KEY1=VALUE
Notice that the fully-qualified setting name includes the module name.
You can specify multiple overrides. Each override must start with -M.
The following command runs the Netflow module and overrides both the
Elasticsearch host setting and the udp.port setting:
bin/logstash --modules netflow -M "netflow.var.input.udp.port=3555" -M "netflow.var.elasticsearch.hosts=my-es-cloud"
Any settings defined in the command line are ephemeral and will not persist across
subsequent runs of Logstash. If you want to persist a configuration, you need to
set it in the logstash.yml settings file.
Settings that you specify at the command line are merged with any settings
specified in the logstash.yml file. If an option is set in both
places, the value specified at the command line takes precedence.